Two Graphs
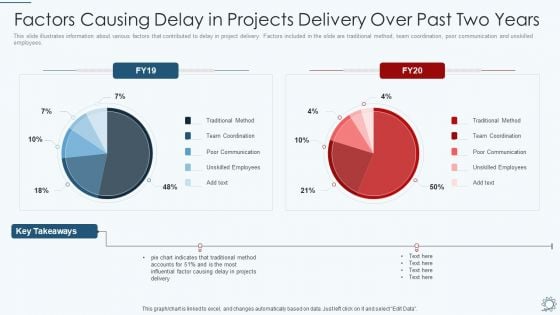
Development And Operations Pipeline IT Factors Causing Delay In Projects Delivery Over Past Two Years Infographics PDF
This slide illustrates information about various factors that contributed to delay in project delivery. Factors included in the slide are traditional method, team coordination, poor communication and unskilled employees. Deliver and pitch your topic in the best possible manner with this development and operations pipeline it factors causing delay in projects delivery over past two years infographics pdf. Use them to share invaluable insights on communication, team coordination, traditional method and impress your audience. This template can be altered and modified as per your expectations. So, grab it now.
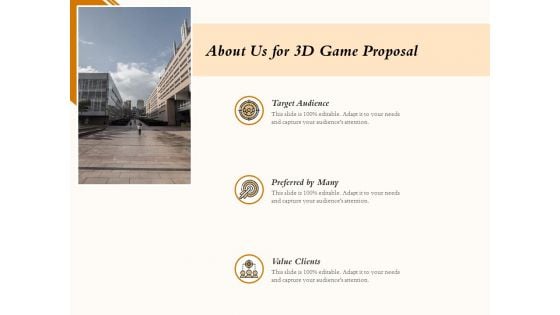
Three Dimensional Games Proposal About Us For 3D Game Proposal Target Ppt Diagram Graph Charts PDF
Presenting this set of slides with name three dimensional games proposal about us for 3d game proposal target ppt diagram graph charts pdf. This is a two stage process. The stages in this process are vision, mission, core values. This is a completely editable PowerPoint presentation and is available for immediate download. Download now and impress your audience.
Graph For Fluctuation In Business Cycle Ppt PowerPoint Presentation File Infographic Template PDF
Presenting this set of slides with name graph for fluctuation in business cycle ppt powerpoint presentation file infographic template pdf. This is a two stage process. The stages in this process are graph for fluctuation in business cycle. This is a completely editable PowerPoint presentation and is available for immediate download. Download now and impress your audience.
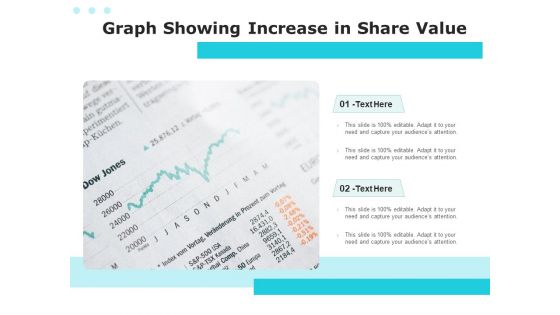
Graph Showing Increase In Share Value Ppt PowerPoint Presentation Backgrounds PDF
Presenting graph showing increase in share value ppt powerpoint presentation backgrounds pdf to dispense important information. This template comprises two stages. It also presents valuable insights into the topics including graph showing increase in share value. This is a completely customizable PowerPoint theme that can be put to use immediately. So, download it and address the topic impactfully.
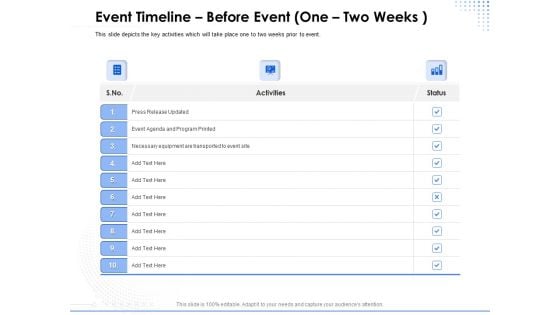
Amusement Event Coordinator Event Timeline Before Event One Two Weeks Ppt PowerPoint Presentation Summary Graphics Template PDF
Presenting this set of slides with name amusement event coordinator event timeline before event one two weeks ppt powerpoint presentation summary graphics template pdf. The topics discussed in these slides are press release updated, press release updated, necessary equipment transported event, activities. This is a completely editable PowerPoint presentation and is available for immediate download. Download now and impress your audience.
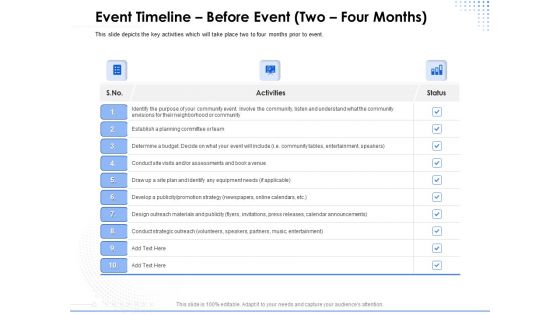
Amusement Event Coordinator Event Timeline Before Event Two Four Months Ppt PowerPoint Presentation Infographic Template Background Image PDF
Presenting this set of slides with name amusement event coordinator event timeline before event two four months ppt powerpoint presentation infographic template background image pdf. The topics discussed in these slides are establish planning, committee team, community tables, entertainment, equipment needs, promotion strategy. This is a completely editable PowerPoint presentation and is available for immediate download. Download now and impress your audience.
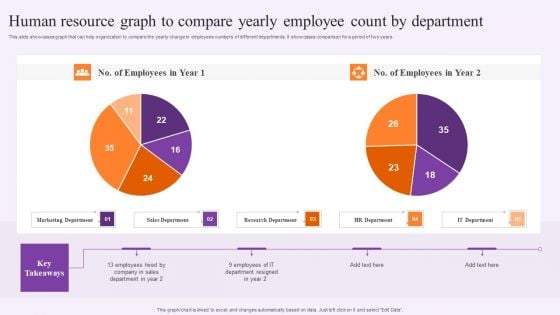
Human Resource Graph To Compare Yearly Employee Count By Department Professional PDF
This slide showcases graph that can help organization to compare the yearly change in employees numbers of different departments. It showcases comparison for a period of two years. Showcasing this set of slides titled Human Resource Graph To Compare Yearly Employee Count By Department Professional PDF. The topics addressed in these templates are Marketing Department, Sales Department, Research Department. All the content presented in this PPT design is completely editable. Download it and make adjustments in color, background, font etc. as per your unique business setting.
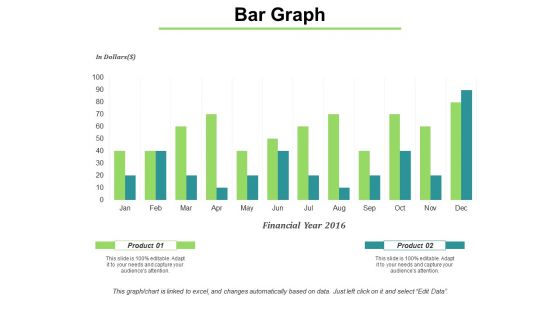
Bar Graph Shows Financial Values Ppt PowerPoint Presentation Infographic Template Gridlines
This is a bar graph shows financial values ppt powerpoint presentation infographic template gridlines. This is a two stage process. The stages in this process are bar, marketing, strategy, finance, planning.
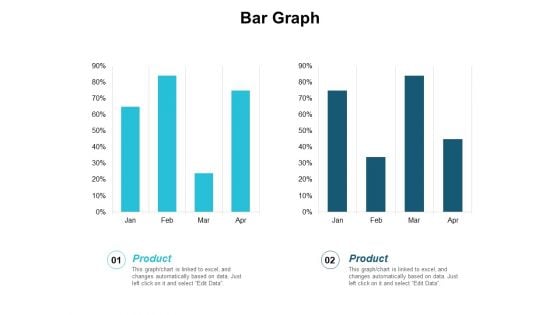
Bar Graph Finance Planning Ppt PowerPoint Presentation Infographic Template Master Slide
This is a bar graph finance planning ppt powerpoint presentation infographic template master slide. This is a two stage process. The stages in this process are finance, analysis, business, investment, marketing.
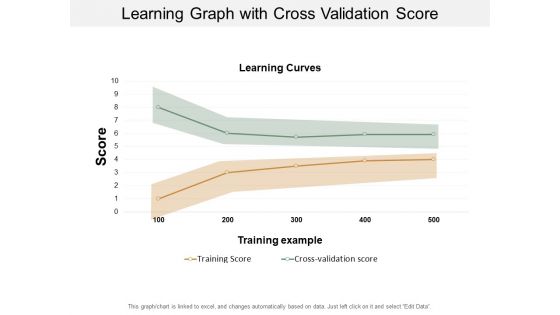
Learning Graph With Cross Validation Score Ppt PowerPoint Presentation Visual Aids Inspiration
This is a learning graph with cross validation score ppt powerpoint presentation visual aids inspiration. This is a two stage process. The stages in this process are experience curve, learning curve.
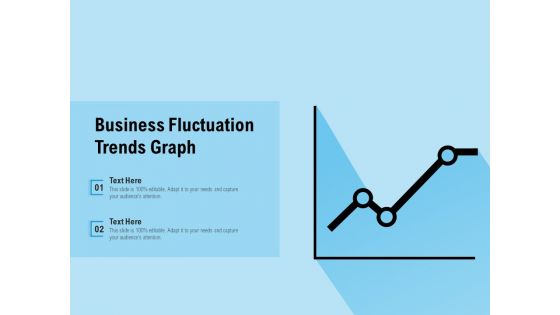
Business Fluctuation Trends Graph Ppt PowerPoint Presentation Gallery Graphics Design PDF
Presenting this set of slides with name business fluctuation trends graph ppt powerpoint presentation gallery graphics design pdf. This is a two stage process. The stages in this process are business fluctuation trends graph. This is a completely editable PowerPoint presentation and is available for immediate download. Download now and impress your audience.

Financial Manager Assessing Business Growth Using Bar Graph Ppt PowerPoint Presentation Gallery Graphics PDF
Presenting financial manager assessing business growth using bar graph ppt powerpoint presentation gallery graphics pdf to dispense important information. This template comprises two stages. It also presents valuable insights into the topics including financial manager assessing business growth using bar graph. This is a completely customizable PowerPoint theme that can be put to use immediately. So, download it and address the topic impactfully.
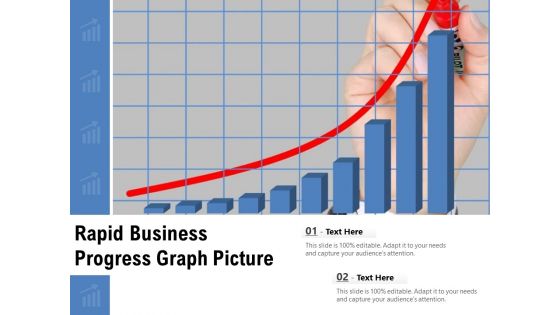
Rapid Business Progress Graph Picture Ppt PowerPoint Presentation Gallery File Formats PDF
Presenting rapid business progress graph picture ppt powerpoint presentation gallery file formats pdf to dispense important information. This template comprises two stages. It also presents valuable insights into the topics including rapid business progress graph picture. This is a completely customizable PowerPoint theme that can be put to use immediately. So, download it and address the topic impactfully.
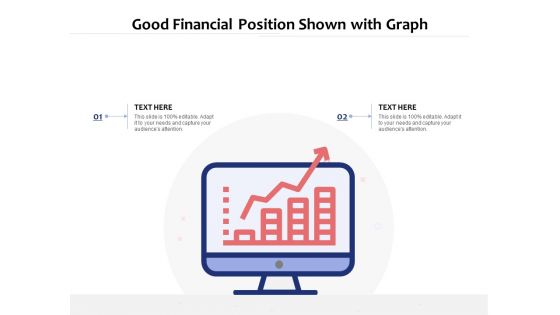
Good Financial Position Shown With Graph Ppt PowerPoint Presentation Model Elements PDF
Presenting good financial position shown with graph ppt powerpoint presentation model elements pdf to dispense important information. This template comprises two stages. It also presents valuable insights into the topics including good financial position shown with graph. This is a completely customizable PowerPoint theme that can be put to use immediately. So, download it and address the topic impactfully.
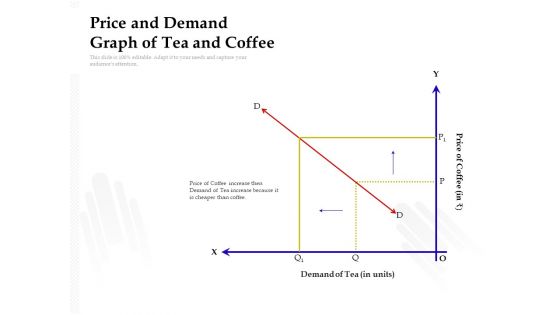
Price And Demand Graph Of Tea And Coffee Ppt PowerPoint Presentation Layouts Infographic Template PDF
Presenting this set of slides with name price and demand graph of tea and coffee ppt powerpoint presentation layouts infographic template pdf. This is a two stage process. The stages in this process are price of coffee, demand of tea. This is a completely editable PowerPoint presentation and is available for immediate download. Download now and impress your audience.
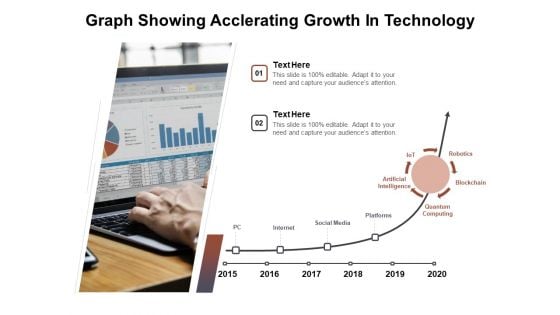
Graph Showing Acclerating Growth In Technology Ppt PowerPoint Presentation Summary Example Introduction PDF
Presenting this set of slides with name graph showing acclerating growth in technology ppt powerpoint presentation summary example introduction pdf. This is a two stage process. The stages in this process are pc, internet, social media, platforms, artificial intelligence, quantum computing, blockchain, robotics, iot. This is a completely editable PowerPoint presentation and is available for immediate download. Download now and impress your audience.
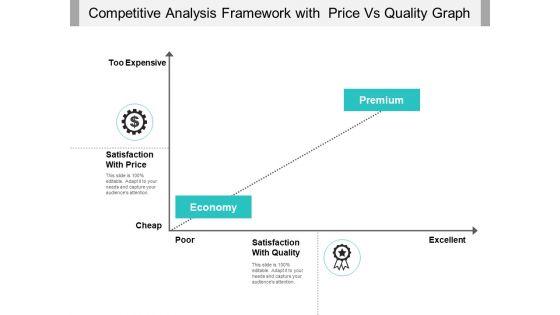
Competitive Analysis Framework With Price Vs Quality Graph Ppt PowerPoint Presentation File Gallery PDF
Presenting this set of slides with name competitive analysis framework with price vs quality graph ppt powerpoint presentation file gallery pdf. This is a two stage process. The stages in this process are price, expensive, excellent. This is a completely editable PowerPoint presentation and is available for immediate download. Download now and impress your audience.
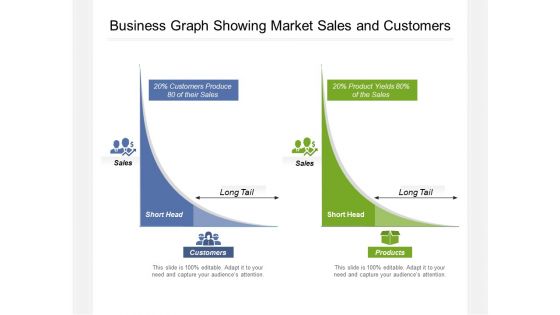
Business Graph Showing Market Sales And Customers Ppt PowerPoint Presentation Ideas Inspiration PDF
Presenting this set of slides with name business graph showing market sales and customers ppt powerpoint presentation ideas inspiration pdf. This is a two stage process. The stages in this process are Short Head, Customers, Sales, Long Tail, Short Head, Products. This is a completely editable PowerPoint presentation and is available for immediate download. Download now and impress your audience.

Empowering The Future Statistical Graph Showcasing Smart Meter Market Growth IoT SS V
This slide showcases information about the global market size of smart meters. It includes key reasons such as government initiatives to promote energy conversation, smart city initiatives, accurate billing process, etc. The Empowering The Future Statistical Graph Showcasing Smart Meter Market Growth IoT SS V is a compilation of the most recent design trends as a series of slides. It is suitable for any subject or industry presentation, containing attractive visuals and photo spots for businesses to clearly express their messages. This template contains a variety of slides for the user to input data, such as structures to contrast two elements, bullet points, and slides for written information. Slidegeeks is prepared to create an impression. This slide showcases information about the global market size of smart meters. It includes key reasons such as government initiatives to promote energy conversation, smart city initiatives, accurate billing process, etc.

Stock Market Growth Rate Graph Image Ppt PowerPoint Presentation Professional Influencers PDF
Persuade your audience using this stock market growth rate graph image ppt powerpoint presentation professional influencers pdf. This PPT design covers two stages, thus making it a great tool to use. It also caters to a variety of topics including stock market growth rate graph image. Download this PPT design now to present a convincing pitch that not only emphasizes the topic but also showcases your presentation skills.
Growth Graph With Dollar Symbol Vector Icon Ppt PowerPoint Presentation Gallery Example PDF
Persuade your audience using this growth graph with dollar symbol vector icon ppt powerpoint presentation gallery example pdf. This PPT design covers two stages, thus making it a great tool to use. It also caters to a variety of topics including growth graph with dollar symbol vector icon. Download this PPT design now to present a convincing pitch that not only emphasizes the topic but also showcases your presentation skills.
Handshake With Bar Graph Vector Icon Ppt PowerPoint Presentation File Clipart PDF
Persuade your audience using this handshake with bar graph vector icon ppt powerpoint presentation file clipart pdf. This PPT design covers two stages, thus making it a great tool to use. It also caters to a variety of topics including handshake with bar graph vector icon. Download this PPT design now to present a convincing pitch that not only emphasizes the topic but also showcases your presentation skills.
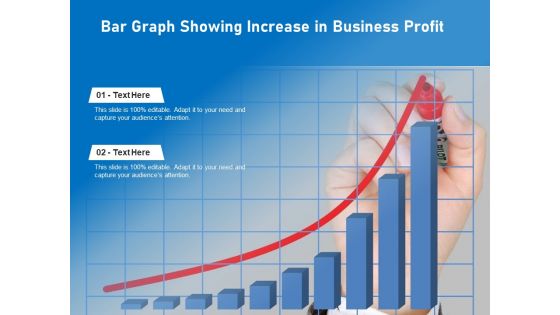
Bar Graph Showing Increase In Business Profit Ppt PowerPoint Presentation Infographic Template Show PDF
Persuade your audience using this bar graph showing increase in business profit ppt powerpoint presentation infographic template show pdf. This PPT design covers two stages, thus making it a great tool to use. It also caters to a variety of topics including bar graph showing increase in business profit. Download this PPT design now to present a convincing pitch that not only emphasizes the topic but also showcases your presentation skills.
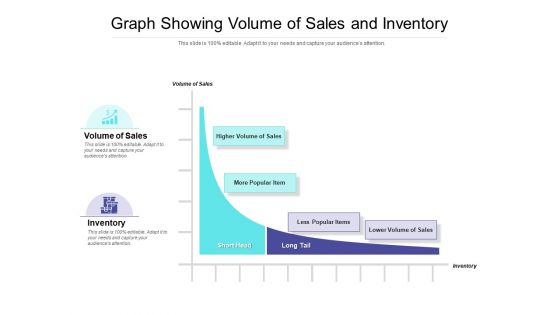
Graph Showing Volume Of Sales And Inventory Ppt PowerPoint Presentation Outline Professional PDF
Presenting this set of slides with name graph showing volume of sales and inventory ppt powerpoint presentation outline professional pdf. This is a two stage process. The stages in this process are volume of sales, inventory, higher volume of sales, higher volume of sales, less popular items, lower volume of sales. This is a completely editable PowerPoint presentation and is available for immediate download. Download now and impress your audience.
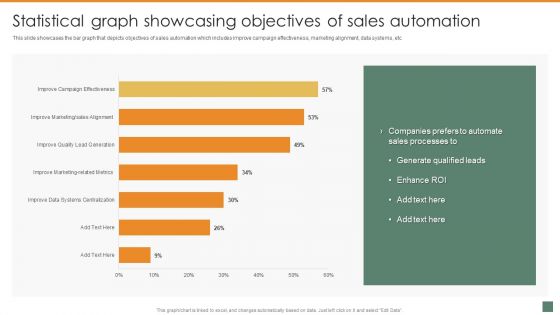
Statistical Graph Showcasing Objectives Of Sales Automation Summary And Significance Of Sales Automation Inspiration PDF
This slide showcases the bar graph that depicts objectives of sales automation which includes improve campaign effectiveness, marketing alignment, data systems, etc. The Statistical Graph Showcasing Objectives Of Sales Automation Summary And Significance Of Sales Automation Inspiration PDF is a compilation of the most recent design trends as a series of slides. It is suitable for any subject or industry presentation, containing attractive visuals and photo spots for businesses to clearly express their messages. This template contains a variety of slides for the user to input data, such as structures to contrast two elements, bullet points, and slides for written information. Slidegeeks is prepared to create an impression.
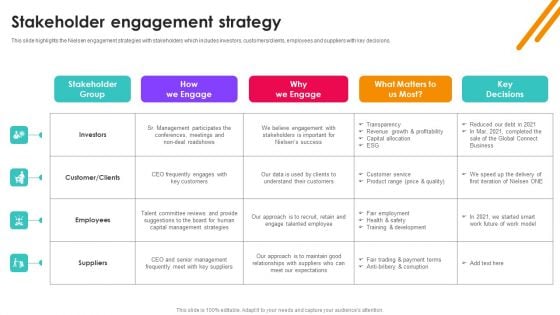
Nielsen Business Profile Stakeholder Engagement Strategy Ppt PowerPoint Presentation Diagram Graph Charts PDF
This slide highlights the Nielsen engagement strategies with stakeholders which includes investors, customers or clients, employees and suppliers with key decisions. The Nielsen Business Profile Stakeholder Engagement Strategy Ppt PowerPoint Presentation Diagram Graph Charts PDF is a compilation of the most recent design trends as a series of slides. It is suitable for any subject or industry presentation, containing attractive visuals and photo spots for businesses to clearly express their messages. This template contains a variety of slides for the user to input data, such as structures to contrast two elements, bullet points, and slides for written information. Slidegeeks is prepared to create an impression.
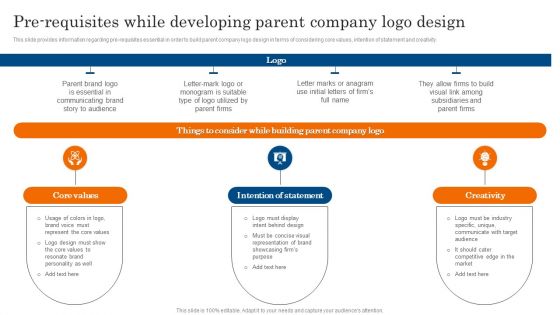
Pre Requisites While Developing Parent Company Logo Design Ppt PowerPoint Presentation Diagram Graph Charts PDF
This slide provides information regarding pre requisites essential in order to build parent company logo design in terms of considering core values, intention of statement and creativity. The Pre Requisites While Developing Parent Company Logo Design Ppt PowerPoint Presentation Diagram Graph Charts PDF is a compilation of the most recent design trends as a series of slides. It is suitable for any subject or industry presentation, containing attractive visuals and photo spots for businesses to clearly express their messages. This template contains a variety of slides for the user to input data, such as structures to contrast two elements, bullet points, and slides for written information. Slidegeeks is prepared to create an impression.
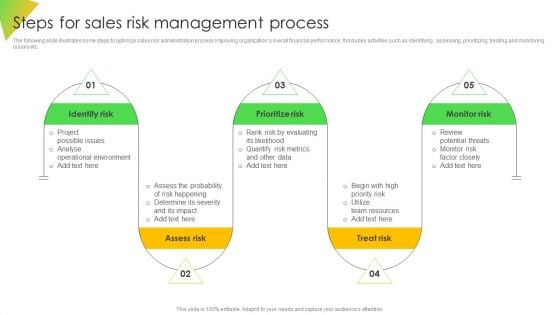
Steps For Sales Risk Management Process Ppt Diagram Graph Charts PDF
The following slide illustrates some steps to optimize sales risk administration process improving organizations overall financial performance. It includes activities such as identifying , assessing, prioritizing, treating and monitoring issues etc. The Steps For Sales Risk Management Process Ppt Diagram Graph Charts PDF is a compilation of the most recent design trends as a series of slides. It is suitable for any subject or industry presentation, containing attractive visuals and photo spots for businesses to clearly express their messages. This template contains a variety of slides for the user to input data, such as structures to contrast two elements, bullet points, and slides for written information. Slidegeeks is prepared to create an impression.
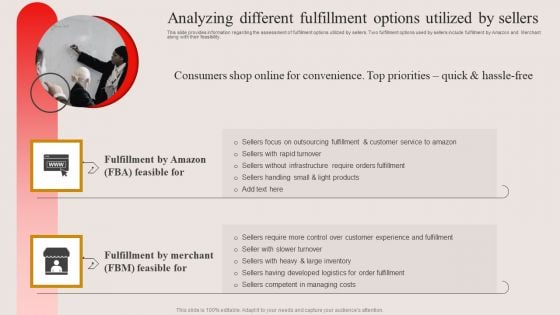
Analyzing Different Fulfillment Options Utilized By Sellers Ppt PowerPoint Presentation Diagram Graph Charts PDF
This slide provides information regarding the assessment of fulfillment options utilized by sellers. Two fulfillment options used by sellers include fulfillment by Amazon and Merchant along with their feasibility. Slidegeeks is one of the best resources for PowerPoint templates. You can download easily and regulate Analyzing Different Fulfillment Options Utilized By Sellers Ppt PowerPoint Presentation Diagram Graph Charts PDF for your personal presentations from our wonderful collection. A few clicks is all it takes to discover and get the most relevant and appropriate templates. Use our Templates to add a unique zing and appeal to your presentation and meetings. All the slides are easy to edit and you can use them even for advertisement purposes.
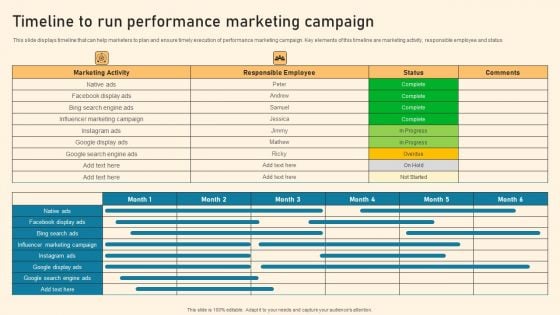
Timeline To Run Performance Marketing Campaign Ppt PowerPoint Presentation Diagram Graph Charts PDF
This slide displays timeline that can help marketers to plan and ensure timely execution of performance marketing campaign. Key elements of this timeline are marketing activity, responsible employee and status The Timeline To Run Performance Marketing Campaign Ppt PowerPoint Presentation Diagram Graph Charts PDF is a compilation of the most recent design trends as a series of slides. It is suitable for any subject or industry presentation, containing attractive visuals and photo spots for businesses to clearly express their messages. This template contains a variety of slides for the user to input data, such as structures to contrast two elements, bullet points, and slides for written information. Slidegeeks is prepared to create an impression.
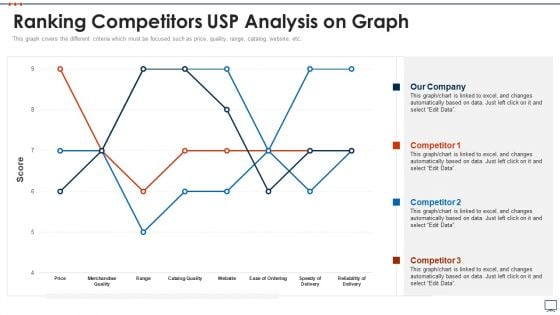
Business Plan Methods Tools And Templates Set 2 Ranking Competitors USP Analysis On Graph Elements PDF
This graph covers the different criteria which must be focused such as price, quality, range, catalog, website, etc. Deliver and pitch your topic in the best possible manner with this business plan methods tools and templates set 2 ranking competitors usp analysis on graph elements pdf. Use them to share invaluable insights on ranking competitors usp analysis on graph and impress your audience. This template can be altered and modified as per your expectations. So, grab it now.
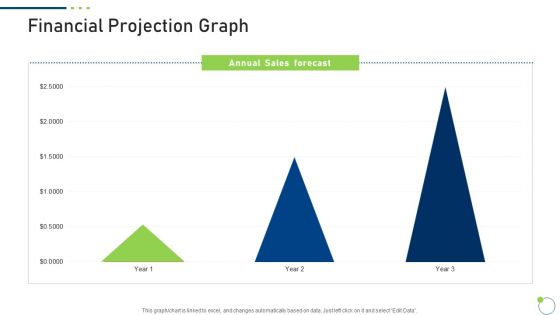
Investor Pitch Deck New Venture Capital Raising Financial Projection Graph Slide2 Portrait PDF
Deliver and pitch your topic in the best possible manner with this investor pitch deck new venture capital raising financial projection graph slide2 portrait pdf. Use them to share invaluable insights on annual sales, gross margin, net profit and impress your audience. This template can be altered and modified as per your expectations. So, grab it now.
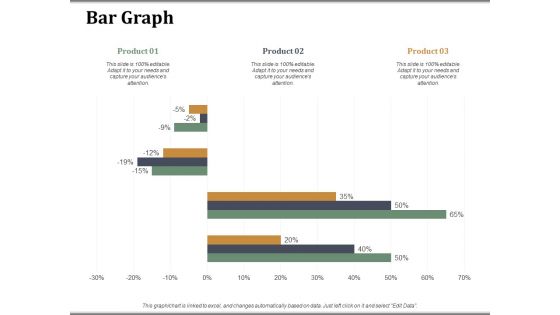
Bar Graph Companys Business Model Canvas Ppt PowerPoint Presentation Visual Aids Model
This is a bar graph companys business model canvas ppt powerpoint presentation visual aids model. This is a three stage process. The stages in this process are bar graph, finance, marketing, strategy, analysis, business.
Interconnect Graph Layout With Icons And Text Holders Ppt PowerPoint Presentation Inspiration Example Introduction
This is a interconnect graph layout with icons and text holders ppt powerpoint presentation inspiration example introduction. This is a three stage process. The stages in this process are graph theory, chart theory, business.
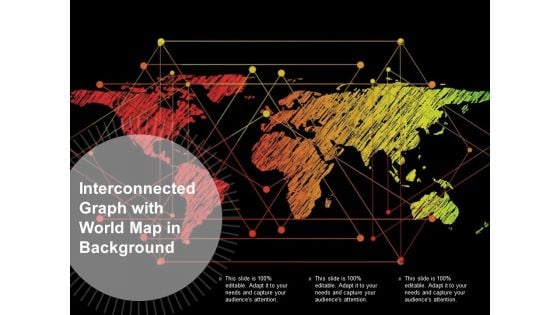
Interconnected Graph With World Map In Background Ppt PowerPoint Presentation Infographics Slide
This is a interconnected graph with world map in background ppt powerpoint presentation infographics slide. This is a three stage process. The stages in this process are graph theory, chart theory, business.
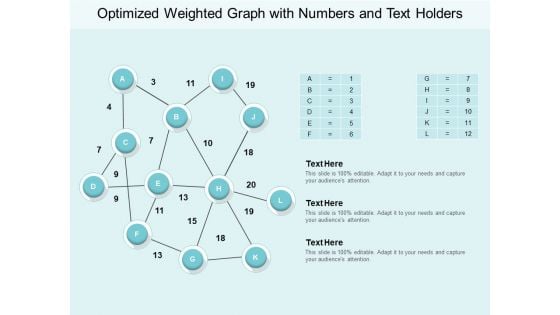
Optimized Weighted Graph With Numbers And Text Holders Ppt PowerPoint Presentation Outline Picture
This is a optimized weighted graph with numbers and text holders ppt powerpoint presentation outline picture. This is a three stage process. The stages in this process are graph theory, chart theory, business.
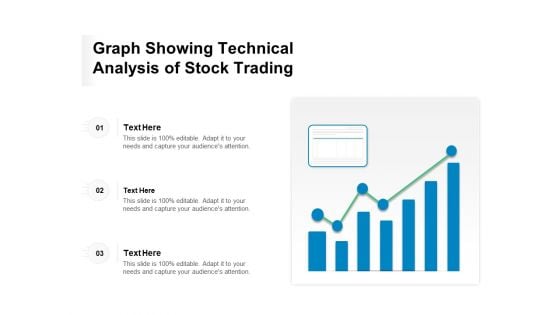
Graph Showing Technical Analysis Of Stock Trading Ppt PowerPoint Presentation Infographic Template Portrait PDF
Presenting this set of slides with name graph showing technical analysis of stock trading ppt powerpoint presentation infographic template portrait pdf. This is a three stage process. The stages in this process are graph showing technical analysis of stock trading. This is a completely editable PowerPoint presentation and is available for immediate download. Download now and impress your audience.
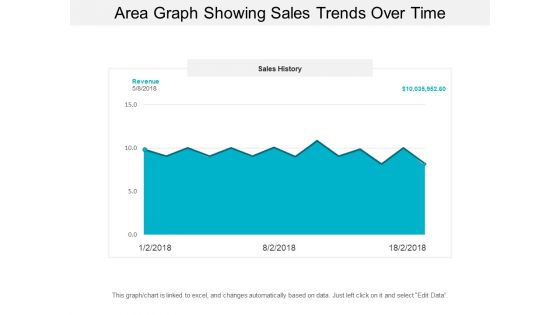
Area Graph Showing Sales Trends Over Time Ppt PowerPoint Presentation Model Background Designs
This is a area graph showing sales trends over time ppt powerpoint presentation model background designs. This is a three stage process. The stages in this process are financial analysis, quantitative, statistical modelling.
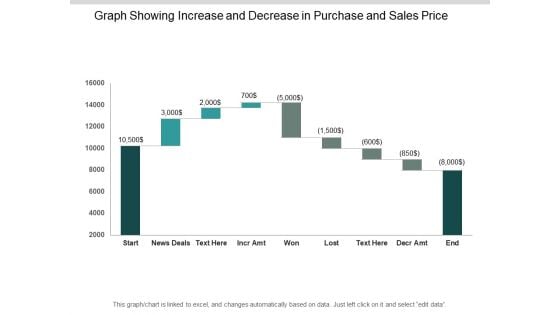
Graph Showing Increase And Decrease In Purchase And Sales Price Ppt PowerPoint Presentation Outline Gallery
This is a graph showing increase and decrease in purchase and sales price ppt powerpoint presentation outline gallery. This is a nine stage process. The stages in this process are sales waterfall, waterfall chart, business.
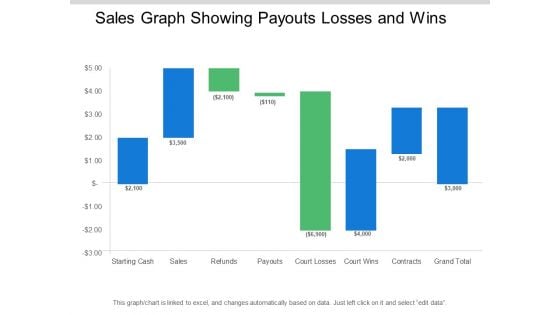
Sales Graph Showing Payouts Losses And Wins Ppt PowerPoint Presentation Pictures Designs Download
This is a sales graph showing payouts losses and wins ppt powerpoint presentation pictures designs download. This is a eight stage process. The stages in this process are sales waterfall, waterfall chart, business.
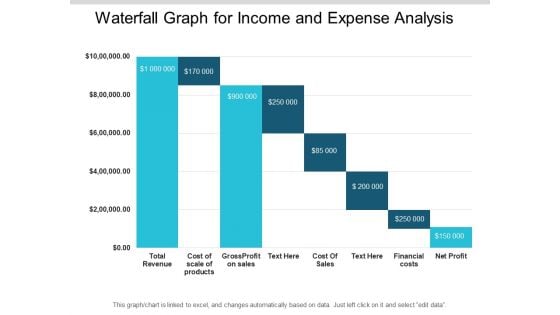
Waterfall Graph For Income And Expense Analysis Ppt PowerPoint Presentation File Deck
This is a waterfall graph for income and expense analysis ppt powerpoint presentation file deck. This is a eight stage process. The stages in this process are sales waterfall, waterfall chart, business.
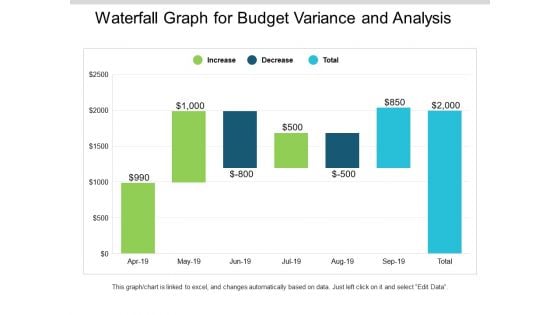
Waterfall Graph For Budget Variance And Analysis Ppt PowerPoint Presentation Slides Mockup
This is a waterfall graph for budget variance and analysis ppt powerpoint presentation slides mockup. This is a three stage process. The stages in this process are profit and loss, balance sheet, income statement, benefit and loss.
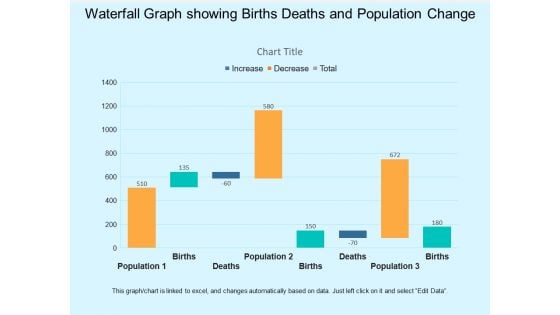
Waterfall Graph Showing Births Deaths And Population Change Ppt PowerPoint Presentation Infographic Template Visual Aids
This is a waterfall graph showing births deaths and population change ppt powerpoint presentation infographic template visual aids. This is a three stage process. The stages in this process are profit and loss, balance sheet, income statement, benefit and loss.
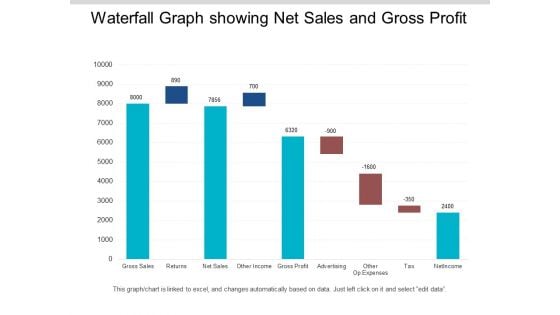
Waterfall Graph Showing Net Sales And Gross Profit Ppt PowerPoint Presentation Infographics Format
This is a waterfall graph showing net sales and gross profit ppt powerpoint presentation infographics format. This is a three stage process. The stages in this process are profit and loss, balance sheet, income statement, benefit and loss.
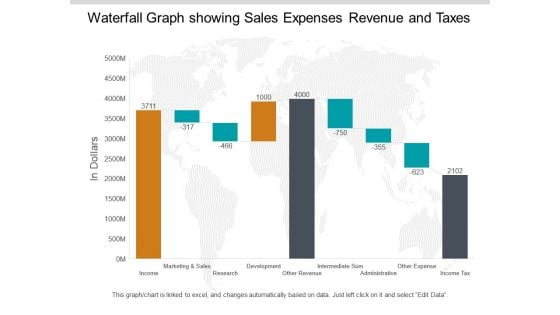
Waterfall Graph Showing Sales Expenses Revenue And Taxes Ppt PowerPoint Presentation Pictures Summary
This is a waterfall graph showing sales expenses revenue and taxes ppt powerpoint presentation pictures summary. This is a three stage process. The stages in this process are profit and loss, balance sheet, income statement, benefit and loss.
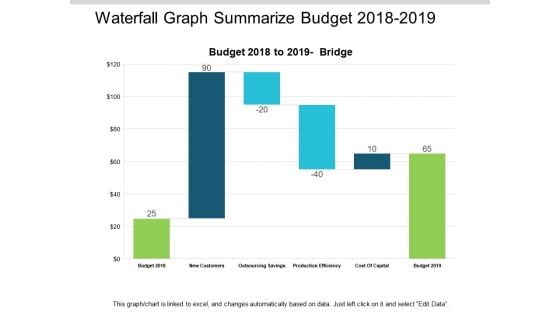
Waterfall Graph Summarize Budget 2018 To 2019 Ppt PowerPoint Presentation Summary Slides
This is a waterfall graph summarize budget 2018 to 2019 ppt powerpoint presentation summary slides. This is a three stage process. The stages in this process are profit and loss, balance sheet, income statement, benefit and loss.
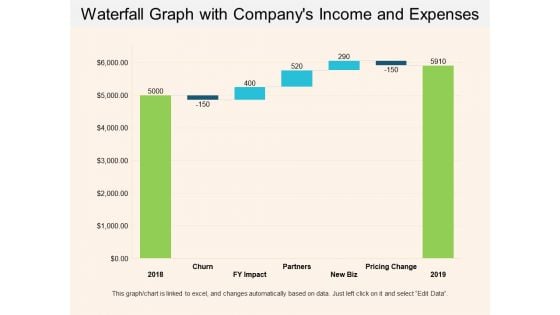
Waterfall Graph With Companys Income And Expenses Ppt PowerPoint Presentation Show Example Introduction
This is a waterfall graph with companys income and expenses ppt powerpoint presentation show example introduction. This is a three stage process. The stages in this process are profit and loss, balance sheet, income statement, benefit and loss.
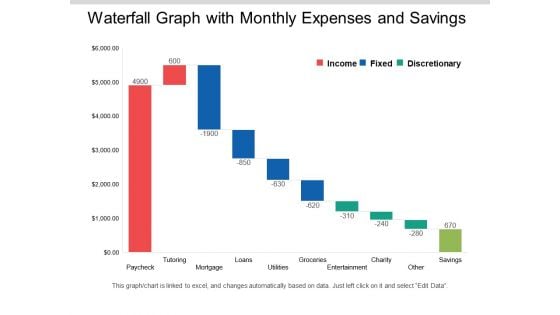
Waterfall Graph With Monthly Expenses And Savings Ppt PowerPoint Presentation Layouts Clipart Images
This is a waterfall graph with monthly expenses and savings ppt powerpoint presentation layouts clipart images. This is a three stage process. The stages in this process are profit and loss, balance sheet, income statement, benefit and loss.
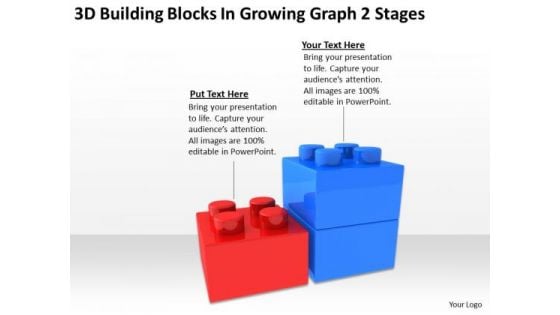
3d Building Blocks Growing Graph 2 Stages Business Plan PowerPoint Slides
We present our 3d building blocks growing graph 2 stages business plan PowerPoint Slides.Download and present our Flow Charts PowerPoint Templates because Our PowerPoint Templates and Slides will weave a web of your great ideas. They are gauranteed to attract even the most critical of your colleagues. Present our Business PowerPoint Templates because You can Bait your audience with our PowerPoint Templates and Slides. They will bite the hook of your ideas in large numbers. Use our Marketing PowerPoint Templates because You can Be the puppeteer with our PowerPoint Templates and Slides as your strings. Lead your team through the steps of your script. Use our Process and Flows PowerPoint Templates because Our PowerPoint Templates and Slides offer you the needful to organise your thoughts. Use them to list out your views in a logical sequence. Present our Success PowerPoint Templates because Our PowerPoint Templates and Slides are created by a hardworking bunch of busybees. Always flitting around with solutions gauranteed to please.Use these PowerPoint slides for presentations relating to Lego, building, concept, standard, electric, brick, economy, conservation, bar, eco, power, pollution, consumption, render, diagram, electricity, ecology, level, effectiveness, scale, idea, graph, protection, energy, comparison, object, efficiency, chart, protect, efficient, rating, norm, color, toy, friendly, saving, background, environment, ecological, construction, game, block, effective. The prominent colors used in the PowerPoint template are Blue, Red, Gray. Amplify on the basic principles with our 3d Building Blocks Growing Graph 2 Stages Business Plan PowerPoint Slides. Get through to the essence with your thoughts.
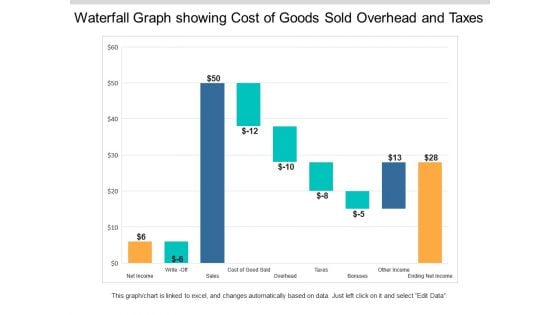
Waterfall Graph Showing Cost Of Goods Sold Overhead And Taxes Ppt PowerPoint Presentation Styles Example Topics
This is a waterfall graph showing cost of goods sold overhead and taxes ppt powerpoint presentation styles example topics. This is a three stage process. The stages in this process are profit and loss, balance sheet, income statement, benefit and loss.
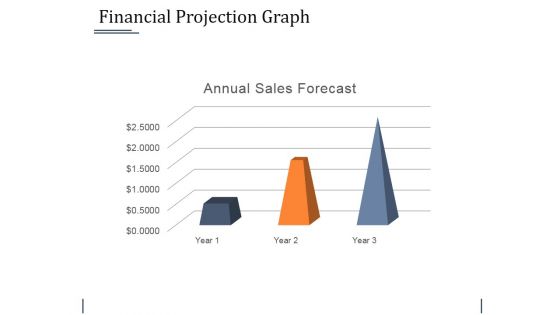
Financial Projection Graph Template 2 Ppt PowerPoint Presentation Infographic Template Gallery
This is a financial projection graph template 2 ppt powerpoint presentation infographic template gallery. This is a three stage process. The stages in this process are business, bar graph, finance, marketing, strategy, analysis.
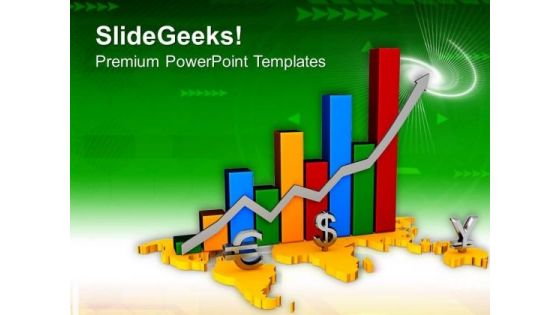
Colored Bar Graph For Business Fluctuation PowerPoint Templates Ppt Backgrounds For Slides 0513
Double your chances with our Colored Bar Graph For Business Fluctuation PowerPoint Templates PPT Backgrounds For Slides. The value of your thoughts will increase two-fold. Charm the audience with your thoughts. Add our Money PowerPoint Templates and they will be dotty for you. Double up our Arrows PowerPoint Templates with your thoughts. They will make an awesome pair. Our Colored Bar Graph For Business Fluctuation PowerPoint Templates Ppt Backgrounds For Slides 0513 will cherish your thoughts. They give your ambitions due care.
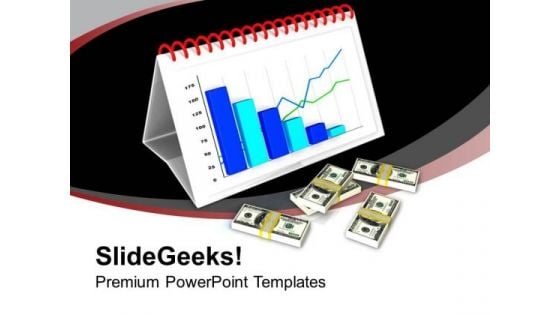
Business Bar Graph For Financial Growth PowerPoint Templates Ppt Backgrounds For Slides 0613
Double your chances with our Business Bar Graph For Financial Growth PowerPoint Templates PPT Backgrounds For Slides. The value of your thoughts will increase two-fold. Charm the audience with your thoughts. Add our Success PowerPoint Templates and they will be dotty for you. Double up our Marketing PowerPoint Templates with your thoughts. They will make an awesome pair. Our Business Bar Graph For Financial Growth PowerPoint Templates Ppt Backgrounds For Slides 0613 can be exhilirating. Excitement levels will climb like never before.

Business Illustration With Bar Graph PowerPoint Templates Ppt Backgrounds For Slides 0713
Double your chances with our Business Illustration With Bar Graph PowerPoint Templates PPT Backgrounds For Slides 0713. The value of your thoughts will increase two-fold. Charm the audience with your thoughts. Add our Money PowerPoint Templates and they will be dotty for you. Double up our Finance PowerPoint Templates with your thoughts. They will make an awesome pair. Our Business Illustration With Bar Graph PowerPoint Templates Ppt Backgrounds For Slides 0713 like to explore. They will give your thoughts a change of direction.
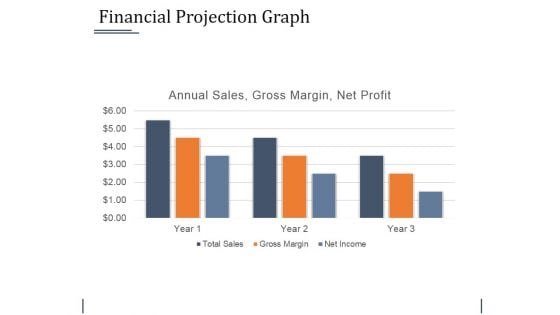
Financial Projection Graph Template 1 Ppt PowerPoint Presentation Professional Example Introduction
This is a financial projection graph template 1 ppt powerpoint presentation professional example introduction. This is a three stage process. The stages in this process are business, bar graph, finance, marketing, strategy, analysis.
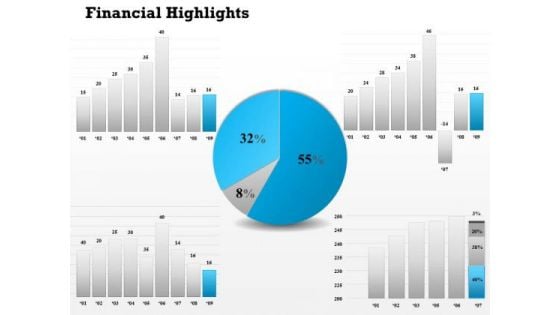
Consulting Diagram Financial Pie And Bar Graph Diagram Business Cycle Diagram
Doll Up Your Thoughts With Our Consulting Diagram Financial Pie And Bar Graph Diagram Business Cycle Diagram Powerpoint Templates. They Will Make A Pretty Picture. They Say A Dog Is Man's Best Friend. Our Consulting Diagram Financial Pie And Bar Graph Diagram Business Cycle Diagram Powerpoint Templates Come A Close Second.
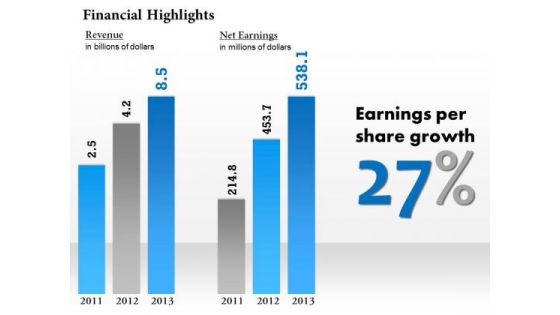
Sales Diagram Financial Result Display Bar Graph Diagram Business Framework Model
Our Sales Diagram Financial Result Display Bar Graph Diagram Business Framework Model Powerpoint Templates Deliver At Your Doorstep. Let Them In For A Wonderful Experience. Dig Out The Dope With Our Sales Diagram Financial Result Display Bar Graph Diagram Business Framework Model Powerpoint Templates. Your Thoughts Will Expose The Truth.
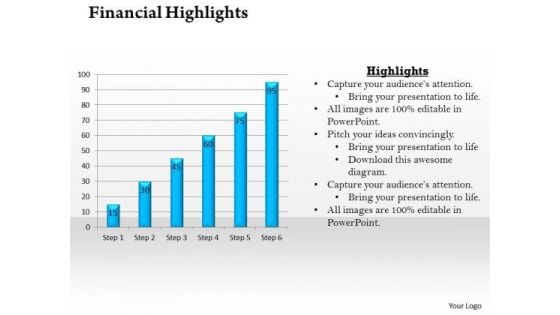
Strategic Management Bar Graph For Business And Financial Growth Business Diagram
Connect The Dots With Our Strategic Management Bar Graph For Business And Financial Growth Business Diagram Powerpoint Templates. Watch The Whole Picture Clearly Emerge. Dot Your Thoughts With Our Strategic Management Bar Graph For Business And Financial Growth Business Diagram Powerpoint Templates. Give Your Demeanor That Propel Look.
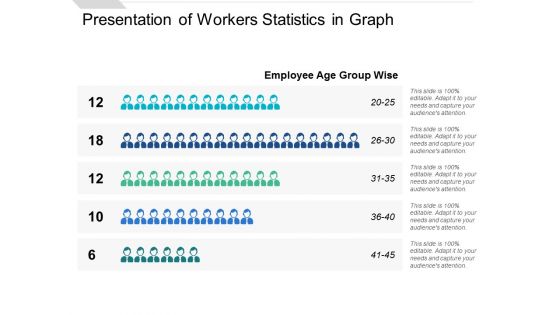
Presentation Of Workers Statistics In Graph Ppt PowerPoint Presentation Visual Aids
Presenting this set of slides with name presentation of workers statistics in graph ppt powerpoint presentation visual aids. This is a five stage process. The stages in this process are people graph, sales performance, population data demographics. This is a completely editable PowerPoint presentation and is available for immediate download. Download now and impress your audience.

Bar Graph Showing Negative Trend Ppt PowerPoint Presentation Summary Master Slide
Presenting this set of slides with name bar graph showing negative trend ppt powerpoint presentation summary master slide. This is a one stage process. The stages in this process are bar graph showing negative trend. This is a completely editable PowerPoint presentation and is available for immediate download. Download now and impress your audience.


 Continue with Email

 Home
Home


