Two Graphs
Financial Market Fluctuations Graph Vector Icon Ppt PowerPoint Presentation Summary Inspiration
Presenting this set of slides with name financial market fluctuations graph vector icon ppt powerpoint presentation summary inspiration. This is a one stage process. The stages in this process are financial market fluctuations graph vector icon. This is a completely editable PowerPoint presentation and is available for immediate download. Download now and impress your audience.
Growth Graph In Magnifying Glass Vector Icon Ppt PowerPoint Presentation Model Graphics Template PDF
Presenting this set of slides with name growth graph in magnifying glass vector icon ppt powerpoint presentation model graphics template pdf. This is a three stage process. The stages in this process are growth graph in magnifying glass vector icon. This is a completely editable PowerPoint presentation and is available for immediate download. Download now and impress your audience.
Bar Graph Analytics Vector Icon Ppt PowerPoint Presentation Slides Information PDF
Presenting this set of slides with name bar graph analytics vector icon ppt powerpoint presentation slides information pdf. This is a three stage process. The stages in this process are bar graph analytics vector icon. This is a completely editable PowerPoint presentation and is available for immediate download. Download now and impress your audience.
Bar Graph Analyzing Company Performance Vector Icon Ppt PowerPoint Presentation Ideas Slides PDF
Presenting this set of slides with name bar graph analyzing company performance vector icon ppt powerpoint presentation ideas slides pdf. This is a three stage process. The stages in this process are bar graph analyzing company performance vector icon. This is a completely editable PowerPoint presentation and is available for immediate download. Download now and impress your audience.

Bar Graph Showing Business Performance With Downward Arrow Ppt PowerPoint Presentation Show Format Ideas PDF
Presenting this set of slides with name bar graph showing business performance with downward arrow ppt powerpoint presentation show format ideas pdf. This is a three stage process. The stages in this process are bar graph showing business performance with downward arrow. This is a completely editable PowerPoint presentation and is available for immediate download. Download now and impress your audience.
Downward Arrow Trend Graph Vector Icon Ppt PowerPoint Presentation Pictures PDF
Presenting this set of slides with name downward arrow trend graph vector icon ppt powerpoint presentation pictures pdf. This is a three stage process. The stages in this process are downward arrow trend graph vector icon. This is a completely editable PowerPoint presentation and is available for immediate download. Download now and impress your audience.
Bar Graph Showing Business Loss Vector Icon Ppt PowerPoint Presentation Gallery Example Topics PDF
Presenting this set of slides with name bar graph showing business loss vector icon ppt powerpoint presentation gallery example topics pdf. This is a three stage process. The stages in this process are bar graph showing business loss vector icon. This is a completely editable PowerPoint presentation and is available for immediate download. Download now and impress your audience.
Business Graph Showing Company Growth Vector Icon Ppt PowerPoint Presentation Gallery Slide Portrait PDF
Presenting this set of slides with name business graph showing company growth vector icon ppt powerpoint presentation gallery slide portrait pdf. This is a three stage process. The stages in this process are business graph showing company growth vector icon. This is a completely editable PowerPoint presentation and is available for immediate download. Download now and impress your audience.
Identifying Risk In Business Bar Graph Vector Icon Ppt PowerPoint Presentation Icon Show PDF
Presenting this set of slides with name identifying risk in business bar graph vector icon ppt powerpoint presentation icon show pdf. This is a three stage process. The stages in this process are identifying risk in business bar graph vector icon. This is a completely editable PowerPoint presentation and is available for immediate download. Download now and impress your audience.

Company Share Analysis Pie Graph Ppt PowerPoint Presentation Styles Slides PDF
Presenting this set of slides with name company share analysis pie graph ppt powerpoint presentation styles slides pdf. This is a four stage process. The stages in this process are company share analysis pie graph. This is a completely editable PowerPoint presentation and is available for immediate download. Download now and impress your audience.

Monitoring Showing Stock Trading And Analysis Graph Ppt PowerPoint Presentation Ideas Slideshow PDF
Presenting this set of slides with name monitoring showing stock trading and analysis graph ppt powerpoint presentation ideas slideshow pdf. This is a one stage process. The stage in this process is monitoring showing stock trading and analysis graph. This is a completely editable PowerPoint presentation and is available for immediate download. Download now and impress your audience.
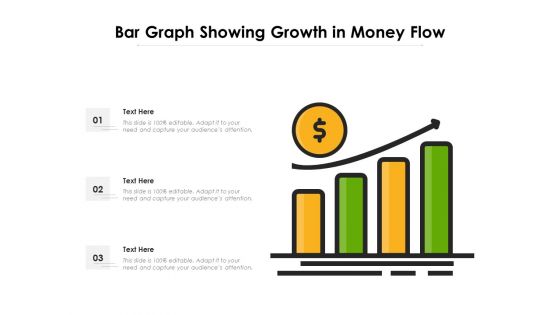
Bar Graph Showing Growth In Money Flow Ppt PowerPoint Presentation File Show PDF
Presenting this set of slides with name bar graph showing growth in money flow ppt powerpoint presentation file show pdf. This is a three stage process. The stages in this process are bar graph showing growth in money flow. This is a completely editable PowerPoint presentation and is available for immediate download. Download now and impress your audience.
Graph For Money Flow Assessment With Magnifying Glass Ppt PowerPoint Presentation Gallery Design Templates PDF
Presenting this set of slides with name graph for money flow assessment with magnifying glass ppt powerpoint presentation gallery design templates pdf. This is a three stage process. The stages in this process are graph for money flow assessment with magnifying glass. This is a completely editable PowerPoint presentation and is available for immediate download. Download now and impress your audience.
Magnifying Glass Bar Graph Showing Business Statistical Analysis Ppt PowerPoint Presentation File Sample PDF
Presenting this set of slides with name magnifying glass bar graph showing business statistical analysis ppt powerpoint presentation file sample pdf. This is a three stage process. The stages in this process are magnifying glass bar graph showing business statistical analysis. This is a completely editable PowerPoint presentation and is available for immediate download. Download now and impress your audience.
Business Growth Bar Graph Vector Icon Ppt PowerPoint Presentation Icon Inspiration PDF
Presenting this set of slides with name business growth bar graph vector icon ppt powerpoint presentation icon inspiration pdf. This is a three stage process. The stages in this process are business growth bar graph vector icon. This is a completely editable PowerPoint presentation and is available for immediate download. Download now and impress your audience.
Bar Graph For Gap Assessment Vector Icon Ppt PowerPoint Presentation Professional Background PDF
Presenting bar graph for gap assessment vector icon ppt powerpoint presentation professional background pdf to dispense important information. This template comprises three stages. It also presents valuable insights into the topics including bar graph for gap assessment vector icon. This is a completely customizable PowerPoint theme that can be put to use immediately. So, download it and address the topic impactfully.
Business Statistics Assessment Graph Icon Ppt PowerPoint Presentation Slides Background Images PDF
Presenting business statistics assessment graph icon ppt powerpoint presentation slides background images pdf to dispense important information. This template comprises three stages. It also presents valuable insights into the topics including business statistics assessment graph icon. This is a completely customizable PowerPoint theme that can be put to use immediately. So, download it and address the topic impactfully.
Dollar Graph For Sale Growth Ppt PowerPoint Presentation Gallery Example PDF
Presenting dollar graph for sale growth ppt powerpoint presentation gallery example pdf to dispense important information. This template comprises four stages. It also presents valuable insights into the topics including dollar graph for sale growth. This is a completely customizable PowerPoint theme that can be put to use immediately. So, download it and address the topic impactfully.
Bar Graph And Magnifying Glass Assessment Icon Ppt PowerPoint Presentation Portfolio Graphics Pictures PDF
Presenting bar graph and magnifying glass assessment icon ppt powerpoint presentation portfolio graphics pictures pdf to dispense important information. This template comprises four stages. It also presents valuable insights into the topics including bar graph and magnifying glass assessment icon. This is a completely customizable PowerPoint theme that can be put to use immediately. So, download it and address the topic impactfully.
Goal Vector Illustrating Target And Graph Icon Ppt PowerPoint Presentation Gallery Inspiration PDF
Presenting goal vector illustrating target and graph icon ppt powerpoint presentation gallery inspiration pdf to dispense important information. This template comprises four stages. It also presents valuable insights into the topics including goal vector illustrating target and graph icon. This is a completely customizable PowerPoint theme that can be put to use immediately. So, download it and address the topic impactfully.
Money Flow Liquidity Icon With Dollar Symbol And Graph Formats PDF
Presenting money flow liquidity icon with dollar symbol and graph formats pdf to dispense important information. This template comprises four stages. It also presents valuable insights into the topics including money flow liquidity icon with dollar symbol and graph. This is a completely customizable PowerPoint theme that can be put to use immediately. So, download it and address the topic impactfully.
Statistical Data Icon Of Data Analytics Using Bar Graph Background PDF
Presenting statistical data icon of data analytics using bar graph background pdf to dispense important information. This template comprises four stages. It also presents valuable insights into the topics including statistical data icon of data analytics using bar graph. This is a completely customizable PowerPoint theme that can be put to use immediately. So, download it and address the topic impactfully.
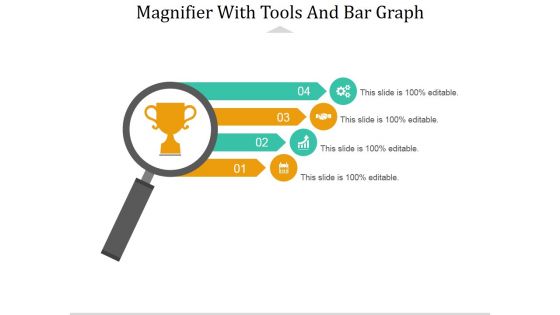
Magnifier With Tools And Bar Graph Ppt PowerPoint Presentation Portfolio Templates
This is a magnifier with tools and bar graph ppt powerpoint presentation portfolio templates. This is a four stage process. The stages in this process are magnifier, search, marketing, strategy, business.

Learning And Experience Graph With Three Milestones Ppt PowerPoint Presentation Model Introduction
This is a learning and experience graph with three milestones ppt powerpoint presentation model introduction. This is a three stage process. The stages in this process are experience curve, learning curve.

Learning Progress Graph Slow Steep And Plateau Ppt PowerPoint Presentation Professional Gallery
This is a learning progress graph slow steep and plateau ppt powerpoint presentation professional gallery. This is a three stage process. The stages in this process are experience curve, learning curve.
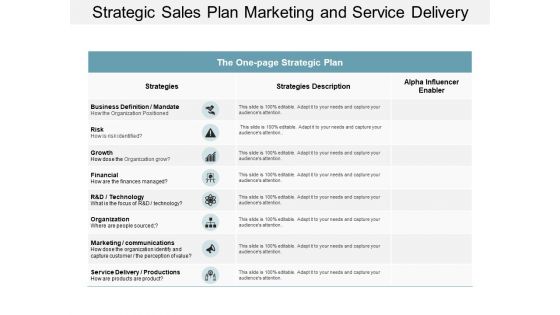
Strategic Sales Plan Marketing And Service Delivery Ppt Powerpoint Presentation Diagram Graph Charts
This is a strategic sales plan marketing and service delivery ppt powerpoint presentation diagram graph charts. This is a three stage process. The stages in this process are one page strategy, one page plan, one page approach.
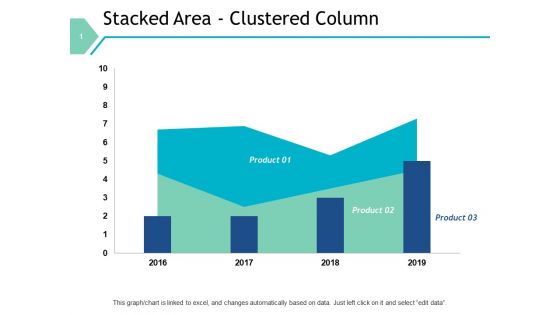
Stacked Area Clustered Column Graph Ppt PowerPoint Presentation File Designs Download
This is a stacked area clustered column graph ppt powerpoint presentation file designs download. This is a three stage process. The stages in this process are finance, marketing, management, investment, analysis.
Statistical Assessment Business Graph With Magnifying Glass Vector Icon Ppt Powerpoint Presentation Styles
This is a statistical assessment business graph with magnifying glass vector icon ppt powerpoint presentation styles. This is a one stage process. The stages in this process are feedback loop icon, evaluation icon, assessment icon.
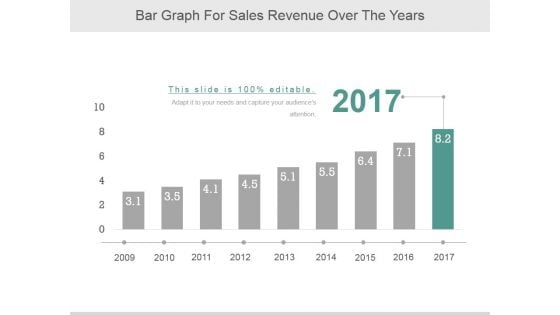
Bar Graph For Sales Revenue Over The Years Ppt PowerPoint Presentation Professional
This is a bar graph for sales revenue over the years ppt powerpoint presentation professional. This is a nine stage process. The stages in this process are business, marketing, growth, bar, years.
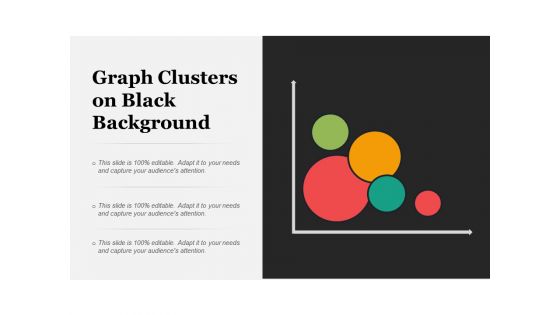
Graph Clusters On Black Background Ppt PowerPoint Presentation Ideas Slide Portrait
This is a graph clusters on black background ppt powerpoint presentation ideas slide portrait. This is a four stage process. The stages in this process are radial cluster diagram, radial circular diagram, radial circle diagram.
Bar Graph Icon Showing Operating Rhythm Ppt Powerpoint Presentation Ideas Templates
This is a bar graph icon showing operating rhythm ppt powerpoint presentation ideas templates. This is a three stage process. The stages in this process are six sigma, operating rhythm, business rhythm.
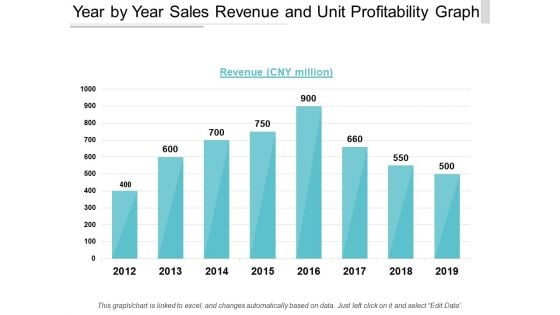
Year By Year Sales Revenue And Unit Profitability Graph Ppt PowerPoint Presentation Show Professional
This is a year by year sales revenue and unit profitability graph ppt powerpoint presentation show professional. This is a eight stage process. The stages in this process are business unit profitability, profitable organization, corporate unit profitability.
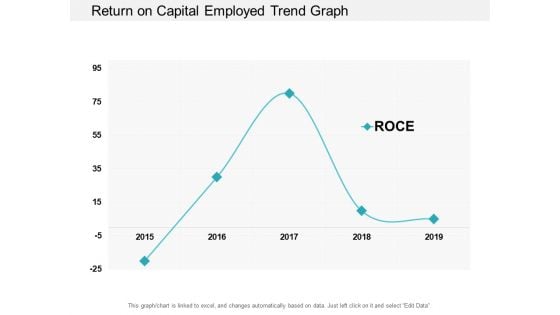
Return On Capital Employed Trend Graph Ppt PowerPoint Presentation Professional Example Topics
This is a return on capital employed trend graph ppt powerpoint presentation professional example topics. This is a one stage process. The stages in this process are accounting ratio, roce, return on capital employed.
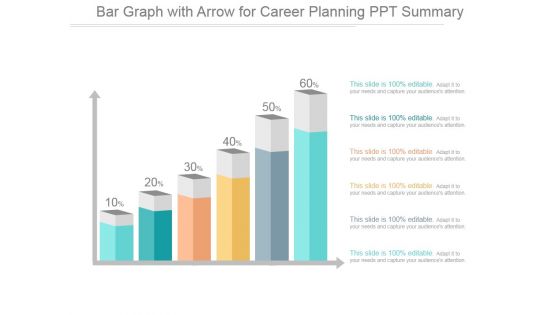
Bar Graph With Arrow For Career Planning Ppt PowerPoint Presentation Gallery
This is a bar graph with arrow for career planning ppt powerpoint presentation gallery. This is a six stage process. The stages in this process are business, finance, marketing, strategy, planning, success, arrow.
Perfect Competition Graph Ppt PowerPoint Presentation Icon Design Templates Cpb Pdf
Presenting this set of slides with name perfect competition graph ppt powerpoint presentation icon design templates cpb pdf. This is an editable Powerpoint five stages graphic that deals with topics like perfect competition graph to help convey your message better graphically. This product is a premium product available for immediate download and is 100 percent editable in Powerpoint. Download this now and use it in your presentations to impress your audience.
Business Financial Growth Bar Graph With Dollar Symbol Icon Ppt PowerPoint Presentation File Ideas PDF
Persuade your audience using this business financial growth bar graph with dollar symbol icon ppt powerpoint presentation file ideas pdf. This PPT design covers one stages, thus making it a great tool to use. It also caters to a variety of topics including business financial growth bar graph with dollar symbol icon. Download this PPT design now to present a convincing pitch that not only emphasizes the topic but also showcases your presentation skills.
Growth Graph With Dollar Currency Signs Vector Icon Ppt PowerPoint Presentation Gallery Styles PDF
Persuade your audience using this growth graph with dollar currency signs vector icon ppt powerpoint presentation gallery styles pdf. This PPT design covers three stages, thus making it a great tool to use. It also caters to a variety of topics including growth graph with dollar currency signs vector icon. Download this PPT design now to present a convincing pitch that not only emphasizes the topic but also showcases your presentation skills.
Bar Graph With Arrows For Data Representation Vector Icon Ppt PowerPoint Presentation Summary Picture PDF
Presenting bar graph with arrows for data representation vector icon ppt powerpoint presentation summary picture pdf to dispense important information. This template comprises three stages. It also presents valuable insights into the topics including bar graph with arrows for data representation vector icon. This is a completely customizable PowerPoint theme that can be put to use immediately. So, download it and address the topic impactfully.
Service Level Agreement KPI Dashboard With Graph And Analytics Icon Inspiration PDF
Persuade your audience using this Service Level Agreement KPI Dashboard With Graph And Analytics Icon Inspiration PDF. This PPT design covers three stages, thus making it a great tool to use. It also caters to a variety of topics including Service Level, Agreement KPI Dashboard, Graph And Analytics, Icon. Download this PPT design now to present a convincing pitch that not only emphasizes the topic but also showcases your presentation skills.
Graph Icon For Quick And Current Liquidity Ratio Analysis Template PDF
Persuade your audience using this Graph Icon For Quick And Current Liquidity Ratio Analysis Template PDF. This PPT design covers Three stages, thus making it a great tool to use. It also caters to a variety of topics including Graph Icon, Quick And Current, Liquidity Ratio Analysis. Download this PPT design now to present a convincing pitch that not only emphasizes the topic but also showcases your presentation skills.
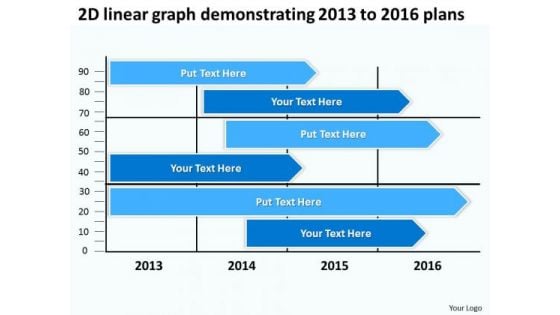
2d Linear Graph Demonstrating 2013 To 2016 Plans PowerPoint Templates Ppt Slides Graphics
We present our 2D linear graph demonstrating 2013 to 2016 plans PowerPoint Templates PPT Slides Graphics.Use our Marketing PowerPoint Templates because The marketplace is the merger of your dreams and your ability. Use our Timelines PowerPoint Templates because Our PowerPoint Templates and Slides are truly out of this world. Even the MIB duo has been keeping tabs on our team. Present our Business PowerPoint Templates because you can Flutter your wings and enchant the world. Impress them with the innate attractiveness of your thoughts and words. Download and present our Arrows PowerPoint Templates because you can outline your targets to your team. Download our Time planning PowerPoint Templates because they will Amplify your thoughts via our appropriate templates.Use these PowerPoint slides for presentations relating to Art, Background, Button, Call, City, Colorful, Concept, Country, Destination, Editable, Flag, Fuel, Geography, Graphic, Home, Icon, Illustration, Journey, Land, Locate, Location, Macro, Map, Mapping, Mark, Navigate, Needle, Petrol, Pin, Pinpoint, Place, Pointing, Pump, Push, Pushpin, Restaurant, Road, Roadmap, Service, Set, Shiny, Space, Symbol, Town, Travel, Trip. The prominent colors used in the PowerPoint template are Blue, White, Black. PowerPoint presentation experts tell us our 2D linear graph demonstrating 2013 to 2016 plans PowerPoint Templates PPT Slides Graphics are Chic. Customers tell us our Concept PowerPoint templates and PPT Slides provide great value for your money. Be assured of finding the best projection to highlight your words. Customers tell us our 2D linear graph demonstrating 2013 to 2016 plans PowerPoint Templates PPT Slides Graphics provide great value for your money. Be assured of finding the best projection to highlight your words. Customers tell us our Country PowerPoint templates and PPT Slides are Colorful. PowerPoint presentation experts tell us our 2D linear graph demonstrating 2013 to 2016 plans PowerPoint Templates PPT Slides Graphics are Handsome. People tell us our Colorful PowerPoint templates and PPT Slides are Reminiscent. Enhance connectivity with our 2d Linear Graph Demonstrating 2013 To 2016 Plans PowerPoint Templates Ppt Slides Graphics. They will always keep you in touch.
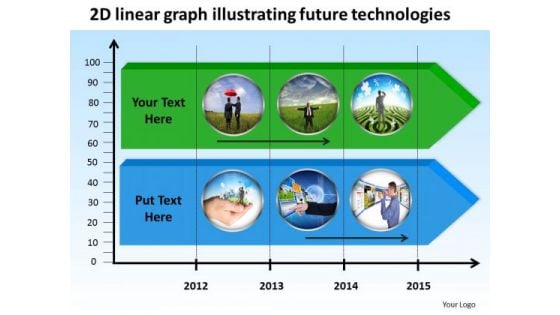
2d Linear Graph Illustrating Future Technologies PowerPoint Templates Ppt Slides Graphics
We present our 2D linear graph illustrating future technologies PowerPoint Templates PPT Slides Graphics.Use our Marketing PowerPoint Templates because it enlightens your team and colleagues on the critical factors involved. Use our Timelines PowerPoint Templates because this PPt Enlighten others on your team with your views. Use our Business PowerPoint Templates because it has inspired a whole new world of medical endeavour. Download and present our Arrows PowerPoint Templates because with the help of our Slides you can Illustrate your ideas one by one and demonstrate how each is an important cog in running the entire wheel. Download our Time planning PowerPoint Templates because leading from the front is your preferred style.Use these PowerPoint slides for presentations relating to Art, Background, Button, Call, City, Colorful, Concept, Country, Destination, Editable, Flag, Fuel, Geography, Graphic, Home, Icon, Illustration, Journey, Land, Locate, Location, Macro, Map, Mapping, Mark, Navigate, Needle, Petrol, Pin, Pinpoint, Place, Pointing, Pump, Push, Pushpin, Restaurant, Road, Roadmap, Service, Set, Shiny, Space, Symbol, Town, Travel, Trip. The prominent colors used in the PowerPoint template are Green, Blue, Black. PowerPoint presentation experts tell us our 2D linear graph illustrating future technologies PowerPoint Templates PPT Slides Graphics are Dazzling. Customers tell us our Colorful PowerPoint templates and PPT Slides are second to none. Customers tell us our 2D linear graph illustrating future technologies PowerPoint Templates PPT Slides Graphics are aesthetically designed to attract attention. We guarantee that they will grab all the eyeballs you need. Customers tell us our Country PowerPoint templates and PPT Slides are Graceful. PowerPoint presentation experts tell us our 2D linear graph illustrating future technologies PowerPoint Templates PPT Slides Graphics are Chic. People tell us our Call PowerPoint templates and PPT Slides are Beautiful. Surpass your colleagues with our 2d Linear Graph Illustrating Future Technologies PowerPoint Templates Ppt Slides Graphics. Download without worries with our money back guaranteee.
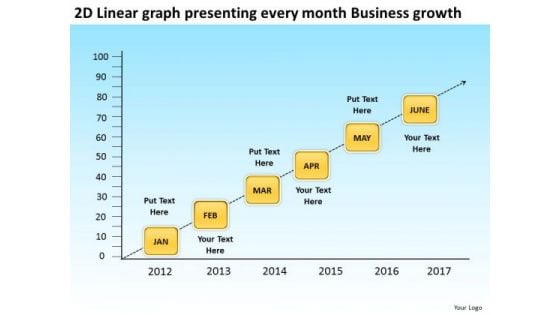
2d Linear Graph Presenting Every Month Business Growth PowerPoint Templates Ppt Slides Graphics
We present our 2D Linear graph presenting every month Business growth PowerPoint Templates PPT Slides Graphics.Use our Marketing PowerPoint Templates because you can Break it all down to Key Result Areas. Use our Timelines PowerPoint Templates because you understand how each drives the next to motor the entire sequence. Use our Business PowerPoint Templates because you too have got the framework of your companys growth in place. Download our Arrows PowerPoint Templates because we provide the means to project your views. Use our Time planning PowerPoint Templates because your business and plans for its growth consist of processes that are highly co-related.Use these PowerPoint slides for presentations relating to Art, Background, Button, Call, City, Colorful, Concept, Country, Destination, Editable, Flag, Fuel, Geography, Graphic, Home, Icon, Illustration, Journey, Land, Locate, Location, Macro, Map, Mapping, Mark, Navigate, Needle, Petrol, Pin, Pinpoint, Place, Pointing, Pump, Push, Pushpin, Restaurant, Road, Roadmap, Service, Set, Shiny, Space, Symbol, Town, Travel, Trip. The prominent colors used in the PowerPoint template are Yellow, Blue, Black. PowerPoint presentation experts tell us our 2D Linear graph presenting every month Business growth PowerPoint Templates PPT Slides Graphics will make the presenter look like a pro even if they are not computer savvy. Customers tell us our Concept PowerPoint templates and PPT Slides are Ritzy. Customers tell us our 2D Linear graph presenting every month Business growth PowerPoint Templates PPT Slides Graphics are Awesome. Customers tell us our Destination PowerPoint templates and PPT Slides are Tranquil. PowerPoint presentation experts tell us our 2D Linear graph presenting every month Business growth PowerPoint Templates PPT Slides Graphics are Wonderful. People tell us our Country PowerPoint templates and PPT Slides are incredible easy to use. Fill in the blanks with our 2d Linear Graph Presenting Every Month Business Growth PowerPoint Templates Ppt Slides Graphics. Your thoughts will have a continuous flow.
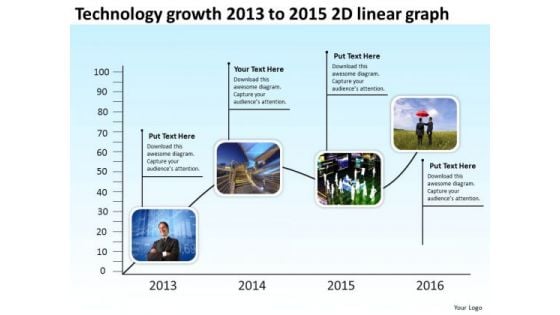
Technology Growth 2013 To 2015 2d Linear Graph PowerPoint Templates Ppt Slides Graphics
We present our Technology growth 2013 to 2015 2D linear graph PowerPoint Templates PPT Slides Graphics.Download our Marketing PowerPoint Templates because customer satisfaction is a mantra of the marketplace. Building a loyal client base is an essential element of your business. Use our Timelines PowerPoint Templates because you can Be the cynosure of all eyes with our template depicting . Download our Business PowerPoint Templates because you have had your share of being a goldfish in a small bowl.you are ready to launch out and spread your wings. Present our Arrows PowerPoint Templates because the vision of being the market leader is clear to you. Download and present our Time planning PowerPoint Templates because you have an idea of which you are sure.Use these PowerPoint slides for presentations relating to Art, Background, Button, Call, City, Colorful, Concept, Country, Destination, Editable, Flag, Fuel, Geography, Graphic, Home, Icon, Illustration, Journey, Land, Locate, Location, Macro, Map, Mapping, Mark, Navigate, Needle, Petrol, Pin, Pinpoint, Place, Pointing, Pump, Push, Pushpin, Restaurant, Road, Roadmap, Service, Set, Shiny, Space, Symbol, Town, Travel, Trip. The prominent colors used in the PowerPoint template are Blue, Black, Purple. PowerPoint presentation experts tell us our Technology growth 2013 to 2015 2D linear graph PowerPoint Templates PPT Slides Graphics are Breathtaking. Customers tell us our Destination PowerPoint templates and PPT Slides are Luxurious. Customers tell us our Technology growth 2013 to 2015 2D linear graph PowerPoint Templates PPT Slides Graphics are Stylish. Customers tell us our Call PowerPoint templates and PPT Slides are Royal. PowerPoint presentation experts tell us our Technology growth 2013 to 2015 2D linear graph PowerPoint Templates PPT Slides Graphics are Awesome. People tell us our City PowerPoint templates and PPT Slides provide great value for your money. Be assured of finding the best projection to highlight your words. Improve the apprearance of your slides with our Technology Growth 2013 To 2015 2d Linear Graph PowerPoint Templates Ppt Slides Graphics. Dont waste time struggling with PowerPoint. Let us do it for you.
Bar Graph Icon For Research Analysis Ppt PowerPoint Presentation Summary Portfolio
Presenting this set of slides with name bar graph icon for research analysis ppt powerpoint presentation summary portfolio. This is a three stage process. The stages in this process are data visualization icon, research analysis, business focus. This is a completely editable PowerPoint presentation and is available for immediate download. Download now and impress your audience.
Performance Monitoring Vector Icon Bar Graph In Magnifying Glass Ppt PowerPoint Presentation Summary Gallery
Presenting this set of slides with name performance monitoring vector icon bar graph in magnifying glass ppt powerpoint presentation summary gallery. This is a one stage process. The stages in this process are growth, improvement, enhancement. This is a completely editable PowerPoint presentation and is available for immediate download. Download now and impress your audience.
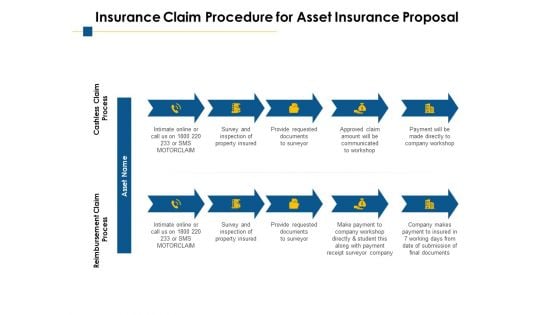
Insurance Claim Procedure For Asset Insurance Proposal Ppt PowerPoint Presentation Diagram Graph Charts
Presenting this set of slides with name insurance claim procedure for asset insurance proposal ppt powerpoint presentation diagram graph charts. This is a ten stage process. The stages in this process are reimbursement claim process, cashless claim process, asset. This is a completely editable PowerPoint presentation and is available for immediate download. Download now and impress your audience.
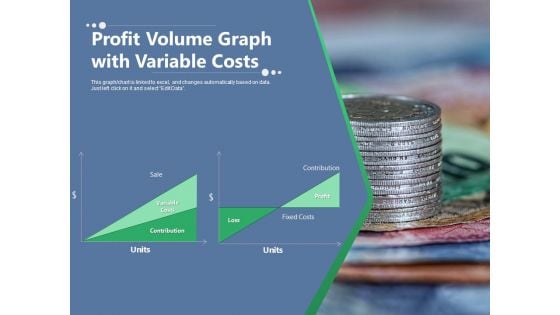
Profit Volume Graph With Variable Costs Ppt PowerPoint Presentation Outline Brochure PDF
Presenting this set of slides with name profit volume graph with variable costs ppt powerpoint presentation outline brochure pdf. This is a one stage process. The stages in this process are sale, contribution, variable costs, profit, fixed costs, loss, units. This is a completely editable PowerPoint presentation and is available for immediate download. Download now and impress your audience.
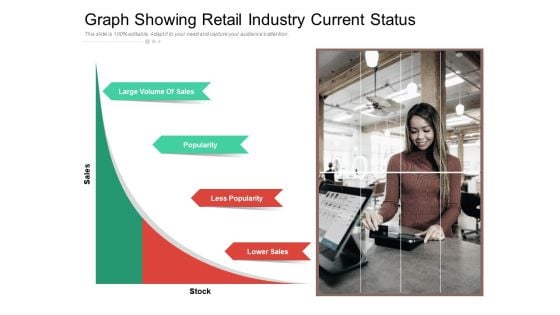
Graph Showing Retail Industry Current Status Ppt PowerPoint Presentation Styles Design Inspiration PDF
Presenting this set of slides with name graph showing retail industry current status ppt powerpoint presentation styles design inspiration pdf. This is a one stage process. The stages in this process are large volume of sales, popularity, less popularity, lower sales, stock, sales. This is a completely editable PowerPoint presentation and is available for immediate download. Download now and impress your audience.
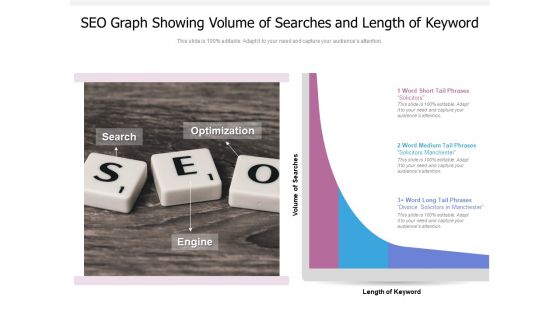
SEO Graph Showing Volume Of Searches And Length Of Keyword Ppt PowerPoint Presentation File Layouts PDF
Presenting this set of slides with name seo graph showing volume of searches and length of keyword ppt powerpoint presentation file layouts pdf. This is a three stage process. The stages in this process are search, optimization, engine, length of keyword, volume of searches. This is a completely editable PowerPoint presentation and is available for immediate download. Download now and impress your audience.
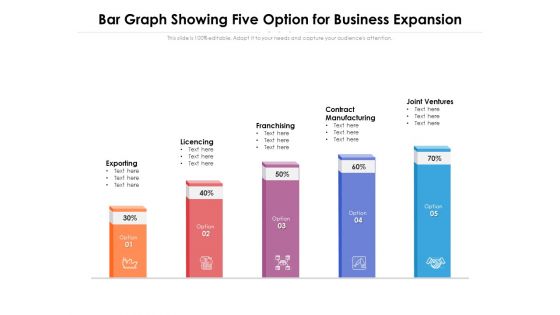
Bar Graph Showing Five Option For Business Expansion Ppt PowerPoint Presentation Portfolio Brochure PDF
Presenting this set of slides with name bar graph showing five option for business expansion ppt powerpoint presentation portfolio brochure pdf. This is a five stage process. The stages in this process are exporting, licencing, franchising, contract manufacturing, joint ventures. This is a completely editable PowerPoint presentation and is available for immediate download. Download now and impress your audience.
Mail With Cross Symbol Vector Icon Ppt PowerPoint Presentation Diagram Graph Charts PDF
Presenting this set of slides with name mail with cross symbol vector icon ppt powerpoint presentation diagram graph charts pdf. This is a three stage process. The stages in this process are mail with cross symbol vector icon. This is a completely editable PowerPoint presentation and is available for immediate download. Download now and impress your audience.

Lady Plucking Flowers From Agriculture Farm Ppt PowerPoint Presentation Diagram Graph Charts PDF
Presenting this set of slides with name lady plucking flowers from agriculture farm ppt powerpoint presentation diagram graph charts pdf. This is a one stage process. The stage in this process is lady plucking flowers from agriculture farm. This is a completely editable PowerPoint presentation and is available for immediate download. Download now and impress your audience.
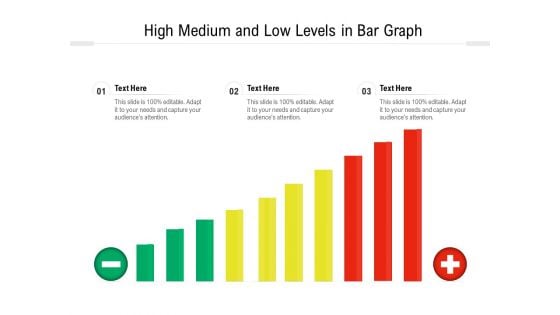
High Medium And Low Levels In Bar Graph Ppt PowerPoint Presentation Professional Design Ideas PDF
Presenting high medium and low levels in bar graph ppt powerpoint presentation professional design ideas pdf to dispense important information. This template comprises one stages. It also presents valuable insights into the topics including low, medium, high. This is a completely customizable PowerPoint theme that can be put to use immediately. So, download it and address the topic impactfully.
Digital Money Cash Inflow And Outflow Icon Ppt PowerPoint Presentation Diagram Graph Charts PDF
Presenting Digital Money Cash Inflow And Outflow Icon Ppt PowerPoint Presentation Diagram Graph Charts PDF to dispense important information. This template comprises three stages. It also presents valuable insights into the topics including Digital Money, Cash Inflow, Outflow Icon. This is a completely customizable PowerPoint theme that can be put to use immediately. So, download it and address the topic impactfully.

2d Graph For Growth PowerPoint Templates Ppt Backgrounds For Slides 0413
We present our 2d Graph For Growth PowerPoint Templates PPT Backgrounds For Slides 0413.Use our Arrows PowerPoint Templates because Our PowerPoint Templates and Slides will embellish your thoughts. See them provide the desired motivation to your team. Present our Success PowerPoint Templates because you should Experience excellence with our PowerPoint Templates and Slides. They will take your breath away. Download and present our Process and Flows PowerPoint Templates because Our PowerPoint Templates and Slides are Clear and concise. Use them and dispel any doubts your team may have. Download and present our Business PowerPoint Templates because Our PowerPoint Templates and Slides provide you with a vast range of viable options. Select the appropriate ones and just fill in your text. Download our Signs PowerPoint Templates because You can Stir your ideas in the cauldron of our PowerPoint Templates and Slides. Cast a magic spell on your audience.Use these PowerPoint slides for presentations relating to Arrow bar graph growth, arrows, success, process and flows, business, signs. The prominent colors used in the PowerPoint template are Green, Red, Blue. Bolt your doubts with our 2d Graph For Growth PowerPoint Templates Ppt Backgrounds For Slides 0413. You will come out on top.
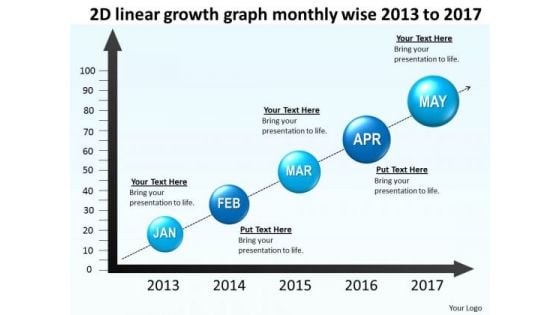
2d Linear Growth Graph Monthly Wise 2013 To 2017 PowerPoint Templates Ppt Slides Graphics
We present our 2D linear growth graph monthly wise 2013 to 2017 PowerPoint Templates PPT Slides Graphics.Use our Marketing PowerPoint Templates because customer satisfaction is a mantra of the marketplace. Building a loyal client base is an essential element of your business. Download and present our Timelines PowerPoint Templates because this diagram helps you to explain your strategy to co-ordinate activities of these seperate groups. Download our Business PowerPoint Templates because generation of sales is the core of any business. Use our Arrows PowerPoint Templates because You have found the one missing link in the picture. That one strand that will bring together the entire edifice. Put it out there for all to see. Emphasise the value of its contribution in propelling the venture forward. Use our Time planning PowerPoint Templates because it Draws the universal impact to highlight the similarities with your organizational structure and plans.Use these PowerPoint slides for presentations relating to Art, Background, Button, Call, City, Colorful, Concept, Country, Destination, Editable, Flag, Fuel, Geography, Graphic, Home, Icon, Illustration, Journey, Land, Locate, Location, Macro, Map, Mapping, Mark, Navigate, Needle, Petrol, Pin, Pinpoint, Place, Pointing, Pump, Push, Pushpin, Restaurant, Road, Roadmap, Service, Set, Shiny, Space, Symbol, Town, Travel, Trip. The prominent colors used in the PowerPoint template are Blue, Black, Blue light. PowerPoint presentation experts tell us our 2D linear growth graph monthly wise 2013 to 2017 PowerPoint Templates PPT Slides Graphics are Dynamic. Customers tell us our City PowerPoint templates and PPT Slides are specially created by a professional team with vast experience. They diligently strive to come up with the right vehicle for your brilliant Ideas. Customers tell us our 2D linear growth graph monthly wise 2013 to 2017 PowerPoint Templates PPT Slides Graphics are Splendid. Customers tell us our Button PowerPoint templates and PPT Slides are Functional. PowerPoint presentation experts tell us our 2D linear growth graph monthly wise 2013 to 2017 PowerPoint Templates PPT Slides Graphics help you meet deadlines which are an element of today's workplace. Just browse and pick the slides that appeal to your intuitive senses. People tell us our Destination PowerPoint templates and PPT Slides effectively help you save your valuable time. Make a fancy impression with our 2d Linear Growth Graph Monthly Wise 2013 To 2017 PowerPoint Templates Ppt Slides Graphics. You will be at the top of your game.
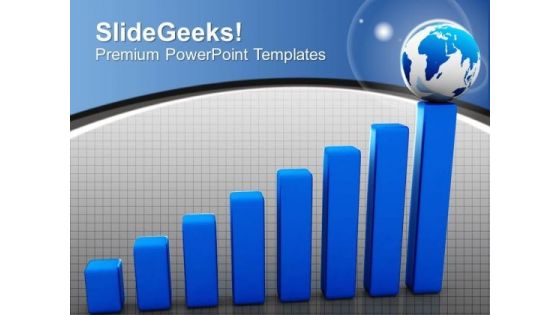
2d Linear Graph Reaching Globe Target Aim PowerPoint Templates Ppt Backgrounds For Slides 0113
We present our 2d Linear Graph Reaching Globe Target Aim PowerPoint Templates PPT Backgrounds For Slides 0113.Use our Globe PowerPoint Templates because Our PowerPoint Templates and Slides will give you great value for your money. Be assured of finding the best projection to highlight your words. Use our Business PowerPoint Templates because Our PowerPoint Templates and Slides are focused like a searchlight beam. They highlight your ideas for your target audience. Download our Finance PowerPoint Templates because You can Bait your audience with our PowerPoint Templates and Slides. They will bite the hook of your ideas in large numbers. Download our Technology PowerPoint Templates because Our PowerPoint Templates and Slides are like the strings of a tennis racquet. Well strung to help you serve aces. Download and present our Success PowerPoint Templates because They will bring a lot to the table. Their alluring flavours will make your audience salivate.Use these PowerPoint slides for presentations relating to Global finance growth, globe, business, finance, technology, success. The prominent colors used in the PowerPoint template are Blue, White, Blue light. PowerPoint presentation experts tell us our 2d Linear Graph Reaching Globe Target Aim PowerPoint Templates PPT Backgrounds For Slides 0113 are specially created by a professional team with vast experience. They diligently strive to come up with the right vehicle for your brilliant Ideas. Use our business PowerPoint templates and PPT Slides will save the presenter time. People tell us our 2d Linear Graph Reaching Globe Target Aim PowerPoint Templates PPT Backgrounds For Slides 0113 effectively help you save your valuable time. The feedback we get is that our globe PowerPoint templates and PPT Slides look good visually. Professionals tell us our 2d Linear Graph Reaching Globe Target Aim PowerPoint Templates PPT Backgrounds For Slides 0113 will save the presenter time. Presenters tell us our finance PowerPoint templates and PPT Slides effectively help you save your valuable time. Adversity flows over with our 2d Linear Graph Reaching Globe Target Aim PowerPoint Templates Ppt Backgrounds For Slides 0113. They assist in fashioning defences.

Sponsorship Levels For Off Road Racing Funding Proposal Ppt PowerPoint Presentation Diagram Graph Charts PDF
This slide represents major sponsorship levels for the investors for off road racing funding proposal. It includes details for platinum and gold level along with investment level and additional benefits. Whether you have daily or monthly meetings, a brilliant presentation is necessary. Sponsorship Levels For Off Road Racing Funding Proposal Ppt PowerPoint Presentation Diagram Graph Charts PDF can be your best option for delivering a presentation. Represent everything in detail using Sponsorship Levels For Off Road Racing Funding Proposal Ppt PowerPoint Presentation Diagram Graph Charts PDF and make yourself stand out in meetings. The template is versatile and follows a structure that will cater to your requirements. All the templates prepared by Slidegeeks are easy to download and edit. Our research experts have taken care of the corporate themes as well. So, give it a try and see the results.
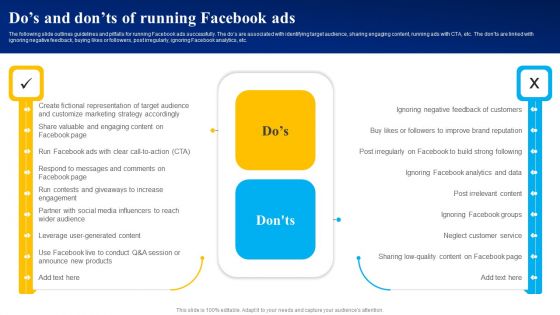
Dos And Donts Of Running Facebook Ads Ppt PowerPoint Presentation Diagram Graph Charts PDF
The following slide outlines guidelines and pitfalls for running Facebook ads successfully. The dos are associated with identifying target audience, sharing engaging content, running ads with CTA, etc. The donts are linked with ignoring negative feedback, buying likes or followers, post irregularly, ignoring Facebook analytics, etc. Formulating a presentation can take up a lot of effort and time, so the content and message should always be the primary focus. The visuals of the PowerPoint can enhance the presenters message, so our Dos And Donts Of Running Facebook Ads Ppt PowerPoint Presentation Diagram Graph Charts PDF was created to help save time. Instead of worrying about the design, the presenter can concentrate on the message while our designers work on creating the ideal templates for whatever situation is needed. Slidegeeks has experts for everything from amazing designs to valuable content, we have put everything into Dos And Donts Of Running Facebook Ads Ppt PowerPoint Presentation Diagram Graph Charts PDF.


 Continue with Email

 Home
Home


