Two Graphs
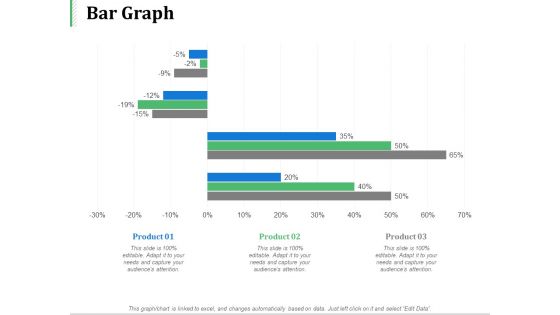
Bar Graph Product Ppt PowerPoint Presentation Layouts Ideas
This is a bar graph product ppt powerpoint presentation layouts ideas. This is a three stage process. The stages in this process are business, management, marketing, product, percentage.
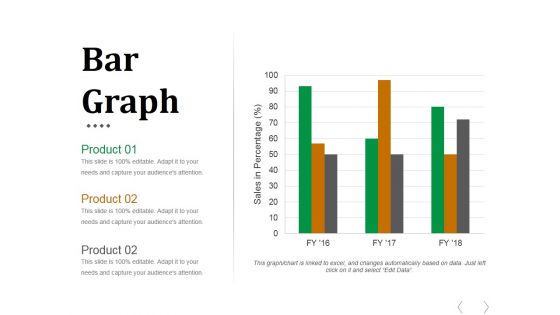
Bar Graph Ppt PowerPoint Presentation File Graphic Images
This is a bar graph ppt powerpoint presentation file graphic images. This is a three stage process. The stages in this process are business, marketing, chart, finance, product.
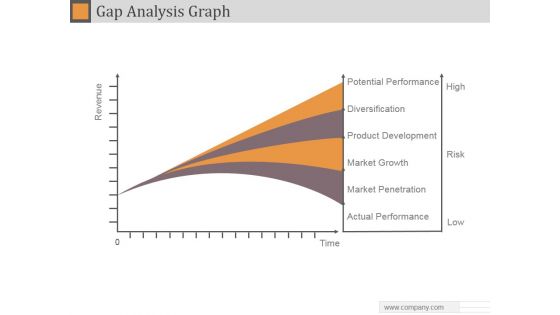
Gap Analysis Graph Ppt PowerPoint Presentation Example 2015
This is a gap analysis graph ppt powerpoint presentation example 2015. This is a four stage process. The stages in this process are potential performance, diversification, product development, market growth, market penetration, actual performance.

Financial Projection Graph Template 1 Ppt PowerPoint Presentation Guide
This is a financial projection graph template 1 ppt powerpoint presentation guide. This is a three stage process. The stages in this process are annual sales, gross margin, net profit.
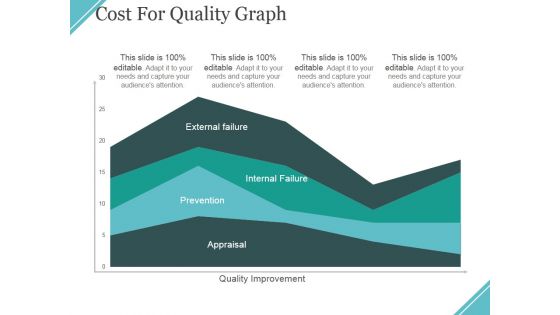
Cost For Quality Graph Ppt PowerPoint Presentation Ideas Files
This is a cost for quality graph ppt powerpoint presentation ideas files. This is a four stage process. The stages in this process are external failure, internal failure, prevention, appraisal, quality improvement.
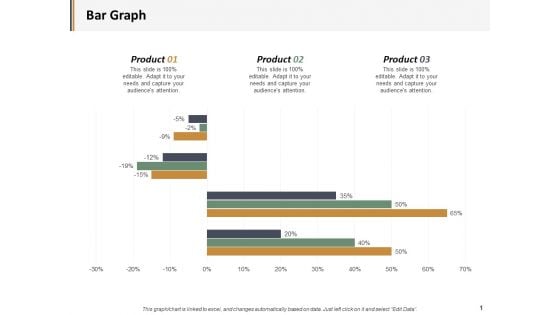
Bar Graph Percentage Product Ppt PowerPoint Presentation Layouts Microsoft
This is a bar graph percentage product ppt powerpoint presentation layouts microsoft. This is a three stage process. The stages in this process are business, management, marketing, percentage, product.
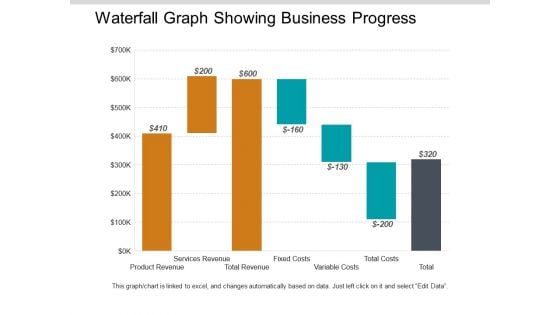
Waterfall Graph Showing Business Progress Ppt PowerPoint Presentation Styles Model
This is a waterfall graph showing business progress ppt powerpoint presentation styles model. This is a three stage process. The stages in this process are profit and loss, balance sheet, income statement, benefit and loss.
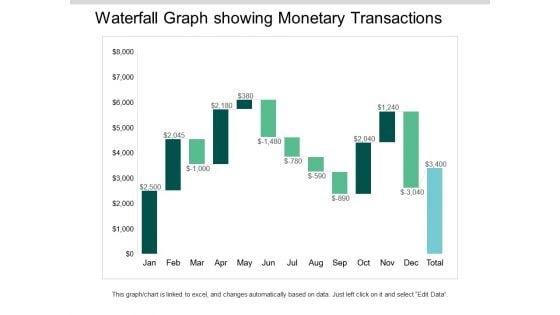
Waterfall Graph Showing Monetary Transactions Ppt PowerPoint Presentation Ideas Visuals
This is a waterfall graph showing monetary transactions ppt powerpoint presentation ideas visuals. This is a three stage process. The stages in this process are profit and loss, balance sheet, income statement, benefit and loss.
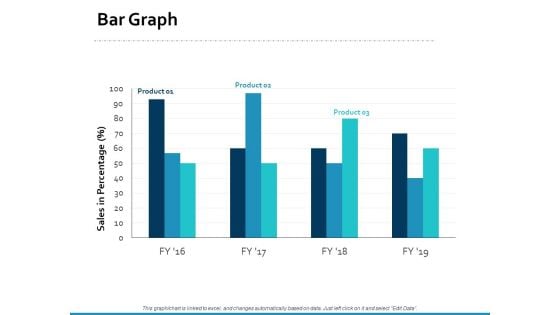
Bar Graph Percentage Product Ppt PowerPoint Presentation Styles Good
This is a bar graph percentage product ppt powerpoint presentation styles good. This is a three stage process. The stages in this process are area chart, finance, marketing, management, investment.
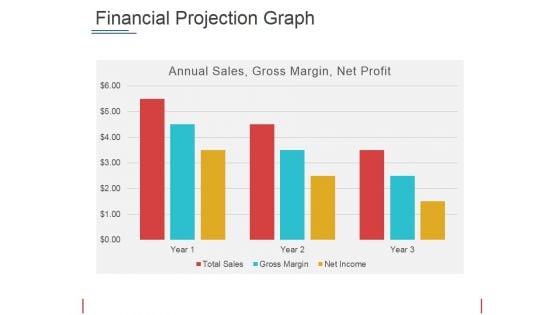
Financial Projection Graph Template 2 Ppt PowerPoint Presentation Show Picture
This is a financial projection graph template 2 ppt powerpoint presentation show picture. This is a three stage process. The stages in this process are annual sales, gross margin, net profit, years.
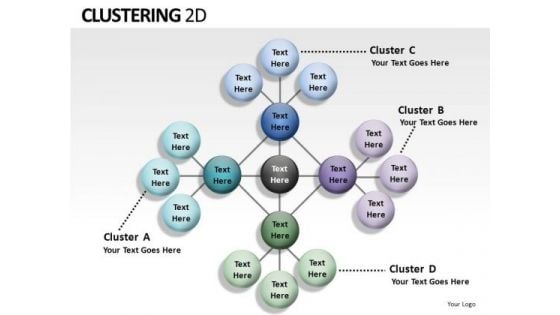
Graph Clustering 2d PowerPoint Slides And Ppt Diagram Templates
Graph Clustering 2D PowerPoint Slides And PPT Diagram Templates-These high quality, editable pre-designed powerpoint slides have been carefully created by our professional team to help you impress your audience. Each graphic in every slide is vector based and is 100% editable in powerpoint. Each and every property of any slide - color, size, shading etc can be modified to build an effective powerpoint presentation. Use these slides to convey complex business concepts in a simplified manner. Any text can be entered at any point in the powerpoint slide. Simply DOWNLOAD, TYPE and PRESENT! Our Graph Clustering 2d PowerPoint Slides And Ppt Diagram Templates consider you family. They express their affection in a colorful way.
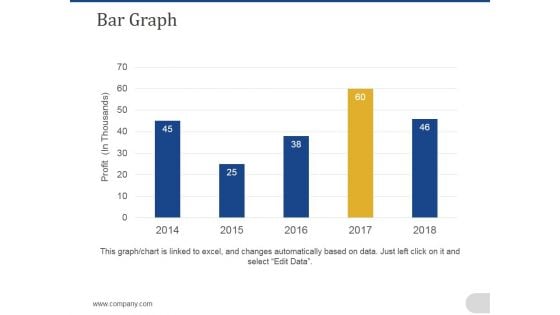
Bar Graph Ppt PowerPoint Presentation Slides File Formats
This is a bar graph ppt powerpoint presentation slides file formats. This is a five stage process. The stages in this process are business, marketing, bar graph, timeline, analysis, planning.
Bar Graph Ppt PowerPoint Presentation Icon Clipart Images
This is a bar graph ppt powerpoint presentation icon clipart images. This is a three stage process. The stages in this process are bar graph, finance, marketing, strategy, analysis.
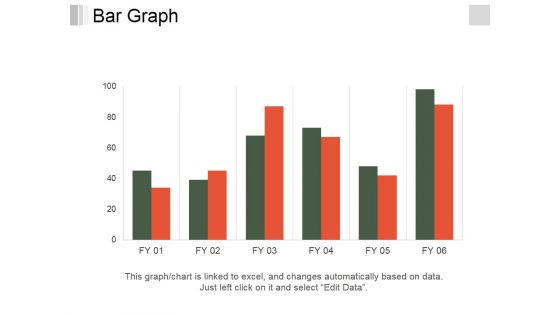
Bar Graph Ppt PowerPoint Presentation Slides Background Image
This is a bar graph ppt powerpoint presentation slides background image. This is a six stage process. The stages in this process are bar graph, finance, marketing, analysis, business.
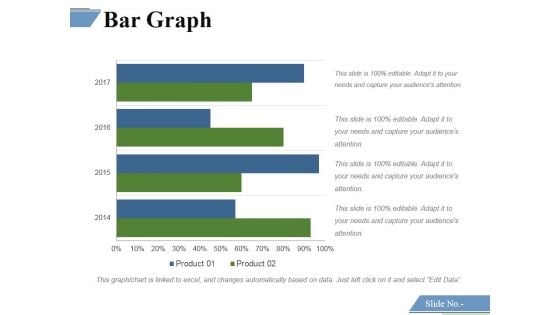
Bar Graph Ppt PowerPoint Presentation Infographics Slide Download
This is a bar graph ppt powerpoint presentation infographics slide download. This is a four stage process. The stages in this process are bar graph, finance, marketing, strategy, analysis.
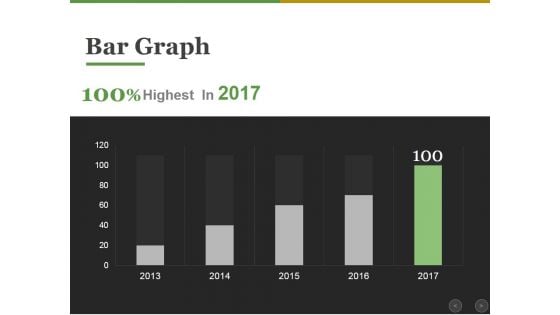
Bar Graph Ppt PowerPoint Presentation Infographic Template Graphics
This is a bar graph ppt powerpoint presentation infographic template graphics. This is a five stage process. The stages in this process are bar graph, finance, marketing, strategy, analysis, business.
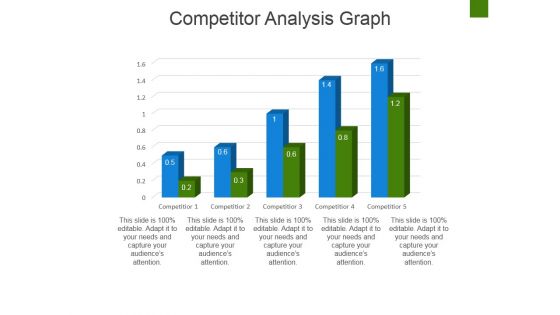
Competitor Analysis Graph Ppt PowerPoint Presentation Slides Elements
This is a competitor analysis graph ppt powerpoint presentation slides elements. This is a five stage process. The stages in this process are bar graph, finance, marketing, strategy, business.
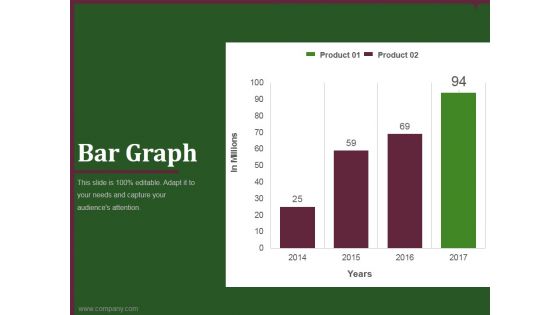
bar graph template 2 ppt powerpoint presentation gallery
This is a bar graph template 2 ppt powerpoint presentation gallery. This is a four stage process. The stages in this process are business, marketing, product, analysis, growth.
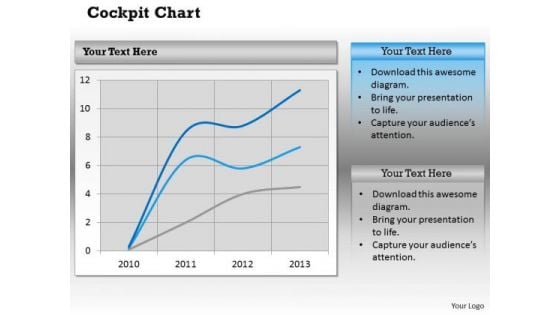
Business Framework Model Buisness Graph Dashboard Style Consulting Diagram
Get Out Of The Dock With Our Business Framework Model Business Graph Dashboard Style Consulting Diagram Powerpoint Templates. Your Mind Will Be Set Free.
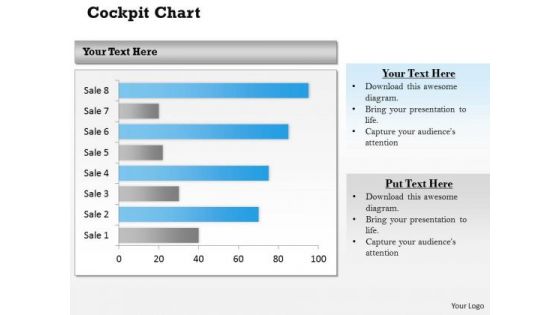
Strategic Management Business Graph Dashboard Layout Business Diagram
Doll Up Your Thoughts With Our Strategic Management Business Graph Dashboard Layout Business Diagram Powerpoint Templates. They Will Make A Pretty Picture.
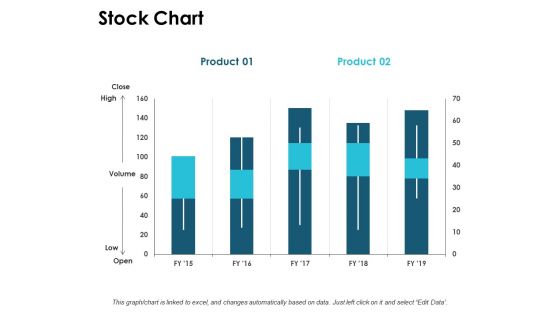
Stock Chart Graph Ppt PowerPoint Presentation Ideas Demonstration
This is a stock chart graph ppt powerpoint presentation ideas demonstration. This is a three stage process. The stages in this process are finance, marketing, management, investment, analysis.

Last 90 Days Results Bar Graph Ppt Slides
This is a last 90 days results bar graph ppt slides. This is a three stage process. The stages in this process are arrows, business, marketing.

Bar Graph Ppt PowerPoint Presentation Visual Aids Styles
This is a bar graph ppt powerpoint presentation visual aids styles. This is a five stage process. The stages in this process are finance, analysis, planning, business, process.

Bar Graph Ppt PowerPoint Presentation Styles File Formats
This is a bar graph ppt powerpoint presentation styles file formats. This is a four stage process. The stages in this process are percentage, business, marketing, finance, strategy.
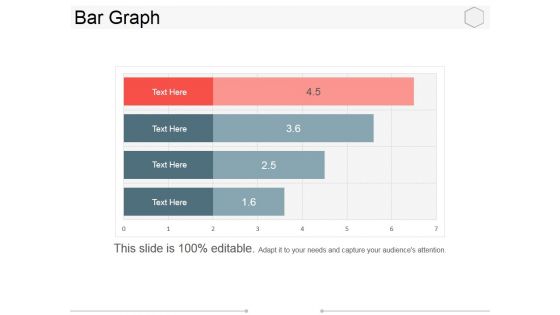
Bar Graph Ppt PowerPoint Presentation Portfolio Example Topics
This is a bar graph ppt powerpoint presentation portfolio example topics. This is a four stage process. The stages in this process are business, marketing, management, success, planning.
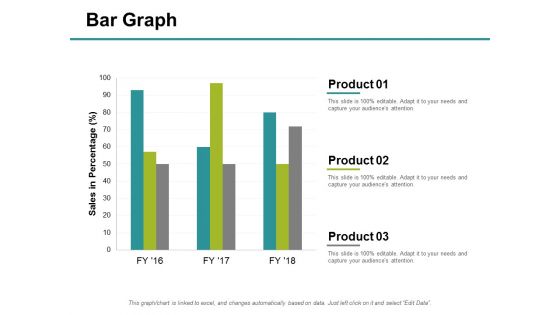
Bar Graph Finance Ppt PowerPoint Presentation Pictures Elements
This is a bar graph finance ppt powerpoint presentation pictures elements. This is a three stage process. The stages in this process are finance, marketing, management, investment, analysis.
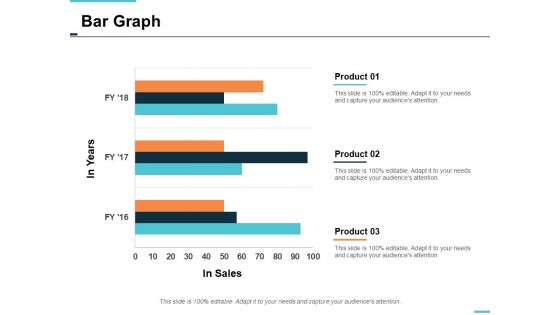
bar graph finance ppt powerpoint presentation portfolio summary
This is a bar graph finance ppt powerpoint presentation portfolio summary. This is a three stage process. The stages in this process are finance, marketing, management, investment, analysis.
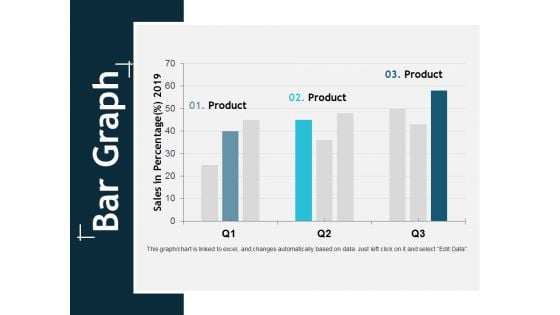
Bar Graph Finance Ppt Powerpoint Presentation Layouts Mockup
This is a bar graph finance ppt powerpoint presentation layouts mockup. This is a three stage process. The stages in this process are finance, marketing, management, investment, analysis.
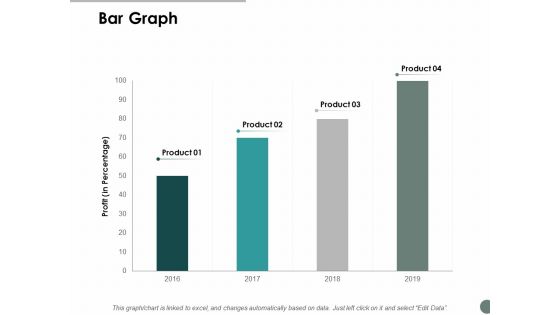
Bar Graph Finance Ppt Powerpoint Presentation File Ideas
This is a bar graph finance ppt powerpoint presentation file ideas. This is a four stage process. The stages in this process are finance, marketing, management, investment, analysis.
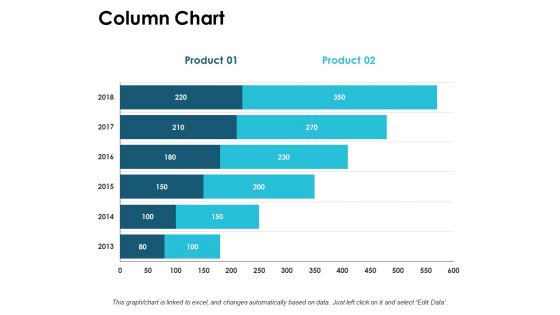
Column Chart Graph Ppt PowerPoint Presentation Outline Information
This is a column chart graph ppt powerpoint presentation outline information. This is a three stage process. The stages in this process are compare, marketing, business, management, planning.
Project Management Gantt Chart Graph Ppt PowerPoint Presentation Styles Icon
This is a project management gantt chart graph ppt powerpoint presentation styles icon. This is a four stage process. The stages in this process are four.
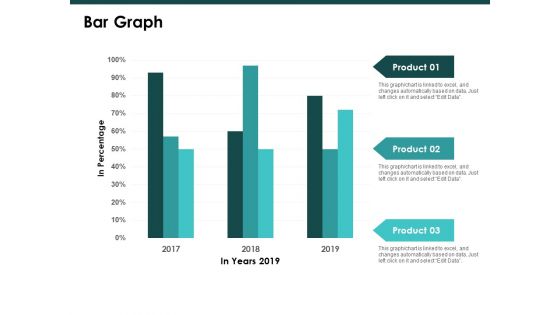
Bar Graph Finance Ppt PowerPoint Presentation Styles Slide
This is a bar graph finance ppt powerpoint presentation styles slide. This is a three stage process. The stages in this process are finance, marketing, management, investment, analysis.
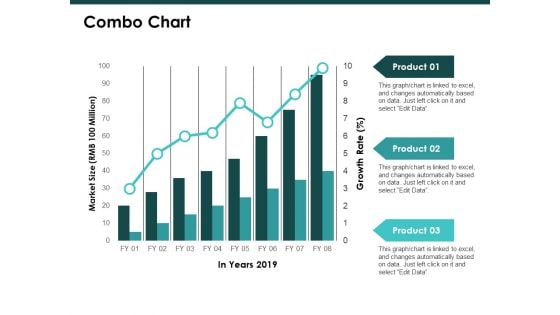
Combo Chart Graph Ppt PowerPoint Presentation Inspiration Template
This is a combo chart graph ppt powerpoint presentation inspiration template. This is a three stage process. The stages in this process are finance, marketing, management, investment, analysis.
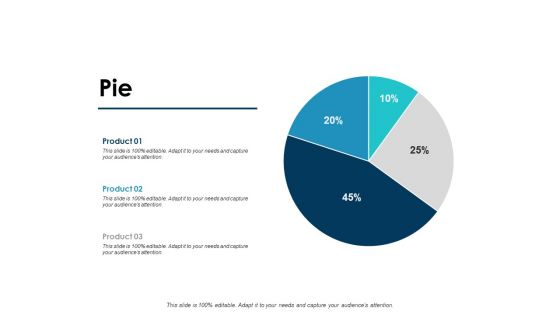
Pie Financial Graph Ppt PowerPoint Presentation Model Gridlines
This is a pie financial graph ppt powerpoint presentation model gridlines. This is a three stage process. The stages in this process are finance, marketing, management, investment, analysis.
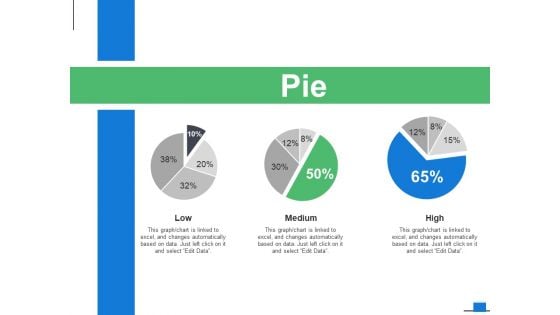
Pie Financial Graph Ppt PowerPoint Presentation Gallery Gridlines
This is a pie financial graph ppt powerpoint presentation gallery gridlines. This is a three stage process. The stages in this process are finance, marketing, management, investment, analysis.
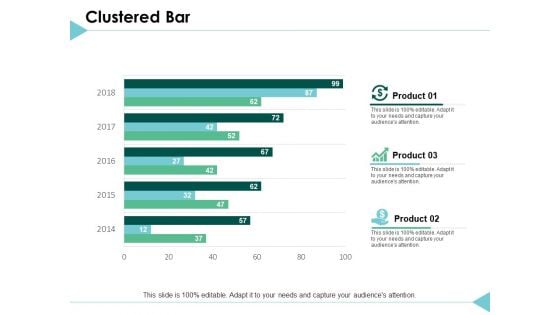
Clustered Bar Graph Ppt PowerPoint Presentation Outline Layouts
This is a clustered bar graph ppt powerpoint presentation outline layouts. This is a three stage process. The stages in this process are finance, marketing, analysis, investment, million.

Stacked Bar Graph Ppt PowerPoint Presentation Inspiration Images
This is a stacked bar graph ppt powerpoint presentation inspiration images. This is a three stage process. The stages in this process are finance, marketing, analysis, investment, million.
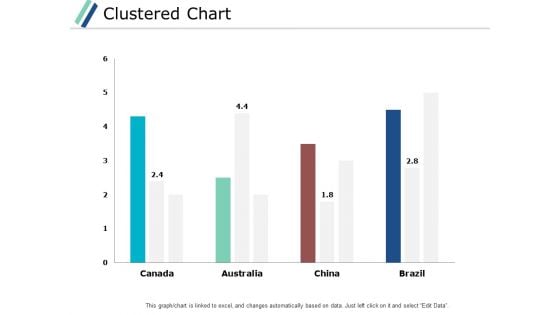
Clustered Chart Graph Ppt PowerPoint Presentation Gallery Backgrounds
This is a clustered chart graph ppt powerpoint presentation gallery backgrounds. This is a three stage process. The stages in this process are finance, marketing, analysis, investment, million.
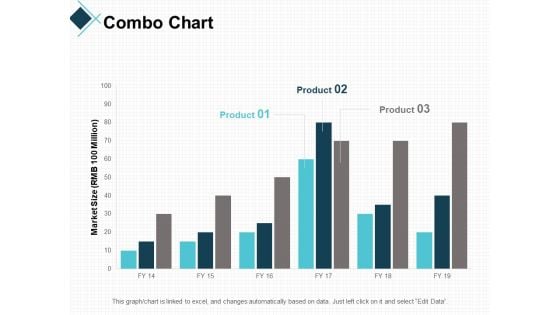
Combo Chart Graph Ppt PowerPoint Presentation Professional Guidelines
This is a combo chart graph ppt powerpoint presentation professional guidelines. This is a three stage process. The stages in this process are finance, marketing, analysis, investment, million.
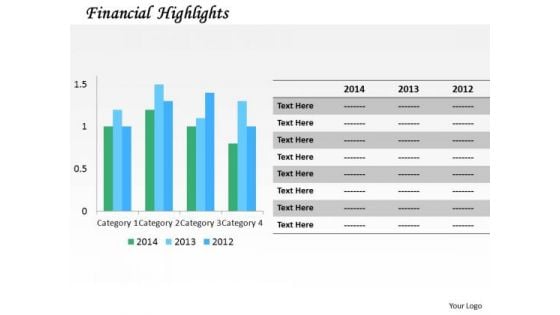
Consulting Diagram Annual Financial Growth Graph Strategic Management
Analyze Ailments On Our Consulting Diagram Annual Financial Growth Graph Strategic Management Powerpoint Templates. Bring Out The Thinking Doctor In You. Dock Your Thoughts With Our Consulting Diagram Annual Financial Growth Graph Strategic Management Powerpoint Templates. They Will Launch Them Into Orbit.
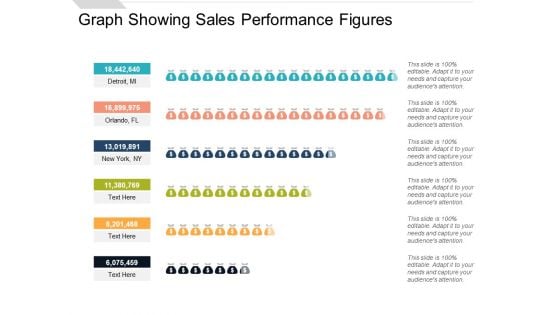
Graph Showing Sales Performance Figures Ppt PowerPoint Presentation Infographics Topics
Presenting this set of slides with name graph showing sales performance figures ppt powerpoint presentation infographics topics. This is a six stage process. The stages in this process are people graph, sales performance, population data demographics. This is a completely editable PowerPoint presentation and is available for immediate download. Download now and impress your audience.
Curved Graph Vector Icon Ppt PowerPoint Presentation Slides Themes PDF
Presenting this set of slides with name curved graph vector icon ppt powerpoint presentation slides themes pdf. This is a one stage process. The stage in this process is curved graph vector icon. This is a completely editable PowerPoint presentation and is available for immediate download. Download now and impress your audience.
Statistical Data Graph Icon Showing Financial Forecast Rules PDF
Presenting statistical data graph icon showing financial forecast rules pdf to dispense important information. This template comprises four stages. It also presents valuable insights into the topics including statistical data graph icon showing financial forecast. This is a completely customizable PowerPoint theme that can be put to use immediately. So, download it and address the topic impactfully.
Icon Of BCWP Graph For Project Management Topics PDF
Persuade your audience using this Icon Of BCWP Graph For Project Management Topics PDF This PPT design covers one stage, thus making it a great tool to use. It also caters to a variety of topics including Icon BCWP, Graph Project, Management Download this PPT design now to present a convincing pitch that not only emphasizes the topic but also showcases your presentation skills.
Doughnut Graph Icon Highlighting IT Team Structure Structure PDF
Presenting Doughnut Graph Icon Highlighting IT Team Structure Structure PDF to dispense important information. This template comprises four stages. It also presents valuable insights into the topics including Doughnut Graph, Icon Highlighting, IT Team Structure. This is a completely customizable PowerPoint theme that can be put to use immediately. So, download it and address the topic impactfully.
Doughnut Graph Icon With Dollar Symbol Topics PDF
Persuade your audience using this Doughnut Graph Icon With Dollar Symbol Topics PDF. This PPT design covers four stages, thus making it a great tool to use. It also caters to a variety of topics including Doughnut Graph, Icon, Dollar Symbol. Download this PPT design now to present a convincing pitch that not only emphasizes the topic but also showcases your presentation skills.
Five Year Sales Projection Graph Icon Graphics PDF
Persuade your audience using this Five Year Sales Projection Graph Icon Graphics PDF. This PPT design covers three stages, thus making it a great tool to use. It also caters to a variety of topics including Five Year Sales, Projection Graph Icon. Download this PPT design now to present a convincing pitch that not only emphasizes the topic but also showcases your presentation skills.
Graph Comparison Icon For Liquidity Financial Ratios Analysis Summary PDF
Presenting Graph Comparison Icon For Liquidity Financial Ratios Analysis Summary PDF to dispense important information. This template comprises Three stages. It also presents valuable insights into the topics including Graph Comparison, Icon For Liquidity, Financial Ratios Analysis. This is a completely customizable PowerPoint theme that can be put to use immediately. So, download it and address the topic impactfully.
Financial Yearly Forecast Icon With Graph And Checklist Summary PDF
Presenting Financial Yearly Forecast Icon With Graph And Checklist Summary PDF to dispense important information. This template comprises Three stages. It also presents valuable insights into the topics including Financial Yearly Forecast, Graph And Checklist . This is a completely customizable PowerPoint theme that can be put to use immediately. So, download it and address the topic impactfully.
Gross Revenue Margin Comparison Graph Icon Clipart PDF
Persuade your audience using this Gross Revenue Margin Comparison Graph Icon Clipart PDF. This PPT design covers three stages, thus making it a great tool to use. It also caters to a variety of topics including Gross Revenue Margin, Comparison Graph Icon. Download this PPT design now to present a convincing pitch that not only emphasizes the topic but also showcases your presentation skills.
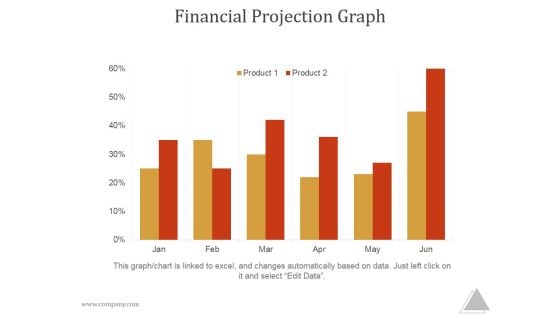
Financial Projection Graph Slide2 Ppt PowerPoint Presentation Themes
This is a financial projection graph slide2 ppt powerpoint presentation themes. This is a five stage process. The stages in this process are year, total sales, gross, margin, net income
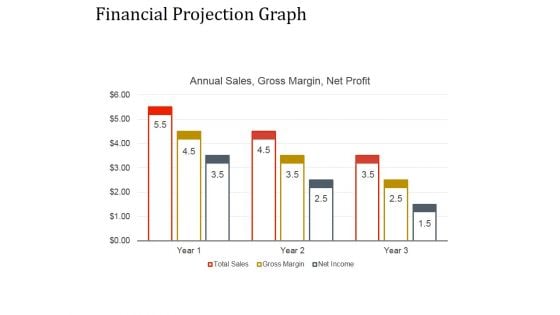
Financial Projection Graph Template 2 Ppt PowerPoint Presentation Ideas
This is a financial projection graph template 2 ppt powerpoint presentation ideas. This is a nine stage process. The stages in this process are annual sales, business, management, marketing, strategy.
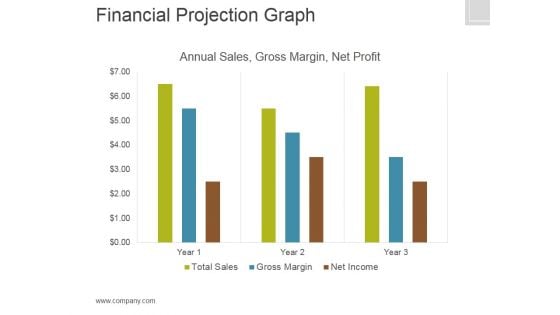
Financial Projection Graph Template 2 Ppt PowerPoint Presentation Graphics
This is a financial projection graph template 2 ppt powerpoint presentation graphics. This is a three stage process. The stages in this process are annual sales, gross margin, net profit, finance.
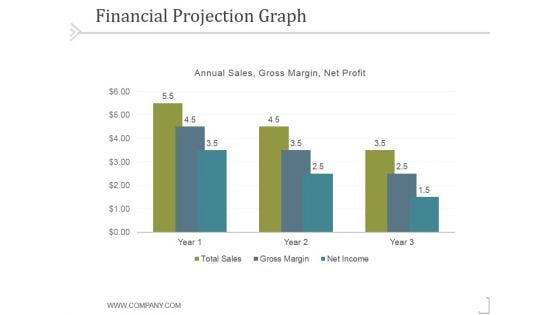
Financial Projection Graph Template 2 Ppt PowerPoint Presentation Template
This is a financial projection graph template 2 ppt powerpoint presentation template. This is a three stage process. The stages in this process are business, strategy, marketing, success, analysis.
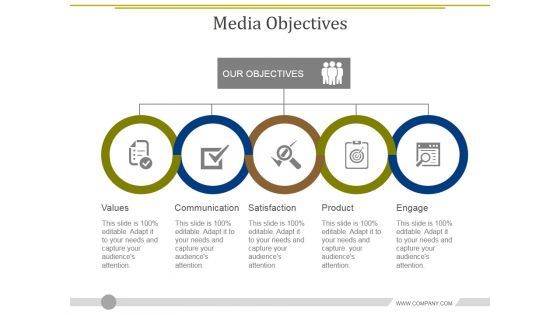
Media Objectives Template 2 Ppt PowerPoint Presentation Diagram Graph Charts
This is a media objectives template 2 ppt powerpoint presentation diagram graph charts. This is a five stage process. The stages in this process are values, communication, satisfaction, product, engage.
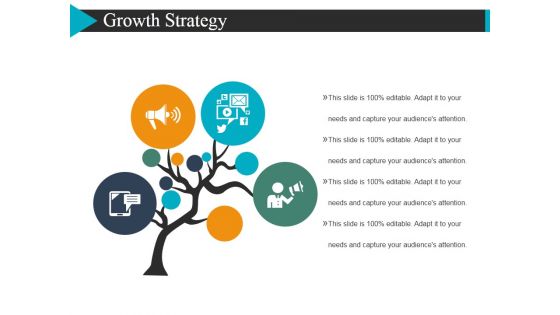
Growth Strategy Template 2 Ppt Powerpoint Presentation Diagram Graph Charts
This is a growth strategy template 2 ppt powerpoint presentation diagram graph charts. This is a four stage process. The stages in this process are tree, marketing, business, icons.
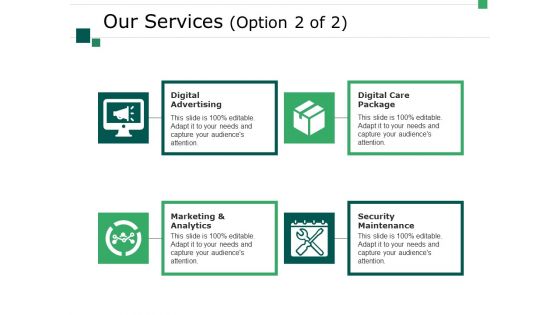
Our Services Template 2 Ppt PowerPoint Presentation Diagram Graph Charts
This is a our services template 2 ppt powerpoint presentation diagram graph charts. This is a four stage process. The stages in this process are business, digital advertising, digital care package, security maintenance, marketing and analytics, marketing, icons.

Agenda CASB 2 0 IT Ppt Diagram Graph Charts
Find a pre-designed and impeccable Agenda CASB 2 0 IT Ppt Diagram Graph Charts. The templates can ace your presentation without additional effort. You can download these easy-to-edit presentation templates to make your presentation stand out from others. So, what are you waiting for Download the template from Slidegeeks today and give a unique touch to your presentation. Our Agenda CASB 2 0 IT Ppt Diagram Graph Charts are topically designed to provide an attractive backdrop to any subject. Use them to look like a presentation pro.
2 Year Digital Evolution Icon With Bar Graph Demonstration PDF
Persuade your audience using this 2 Year Digital Evolution Icon With Bar Graph Demonstration PDF. This PPT design covers Four stages, thus making it a great tool to use. It also caters to a variety of topics including 2 Year Digital, Evolution Icon, Bar Graph. Download this PPT design now to present a convincing pitch that not only emphasizes the topic but also showcases your presentation skills.
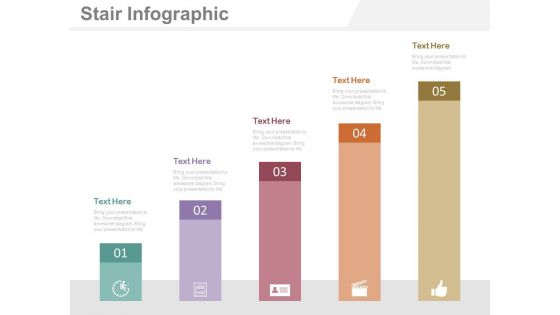
Five Steps Bar Graph For Financial Management Powerpoint Slides
This PowerPoint template has been designed with five steps bar graph and icons. This diagram is useful to exhibit financial management. This diagram slide can be used to make impressive presentations.


 Continue with Email

 Home
Home


