Control Chart
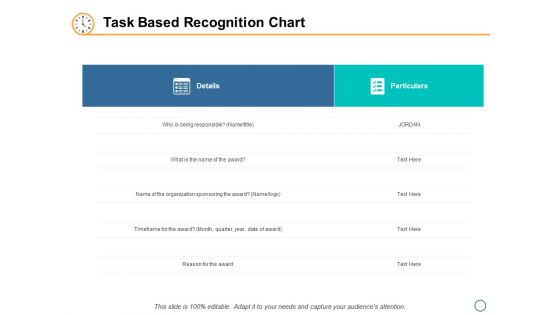
Task Based Recognition Chart Ppt PowerPoint Presentation Inspiration Vector
This is a task based recognition chart ppt powerpoint presentation inspiration vector. This is a two stage process. The stages in this process are business, planning, strategy, detail, particular.
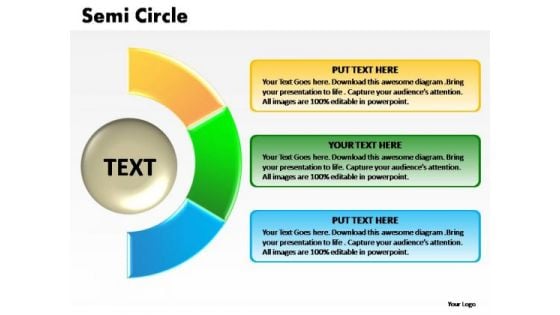
PowerPoint Process Image Semi Circle Chart Ppt Template
PowerPoint Process Image Semi Circle Chart PPT Template-The Circle of Life - a concept emmbedded in our minds and hence easy to comprehend. Life and Business is made up of processes comprising stages that flow from one to another. An excellent graphic to attract the attention of and understanding by your audience to improve earnings. Our PowerPoint Process Image Semi Circle Chart Ppt Template are like a dictionary. They will have the right words for you.
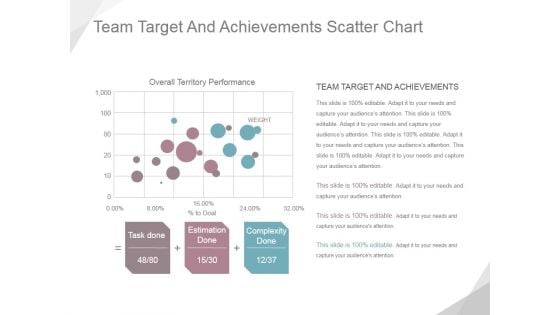
Team Target And Achievements Scatter Chart Ppt PowerPoint Presentation Example
This is a team target and achievements scatter chart ppt powerpoint presentation example. This is a three stage process. The stages in this process are overall territory performance, task done, estimation done, complexity done.
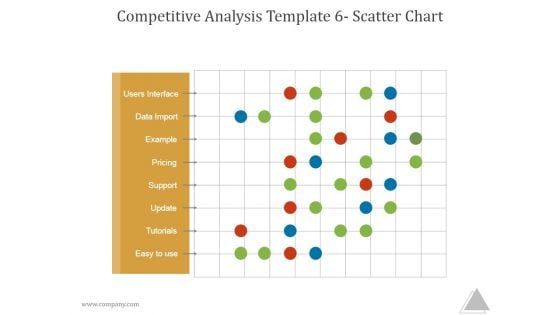
Competitive Analysis Template 6 Scatter Chart Ppt PowerPoint Presentation Shapes
This is a competitive analysis template 6 scatter chart ppt powerpoint presentation shapes. This is a one stage process. The stages in this process are users interface, data import, example, pricing, support update, tutorials, easy to use.
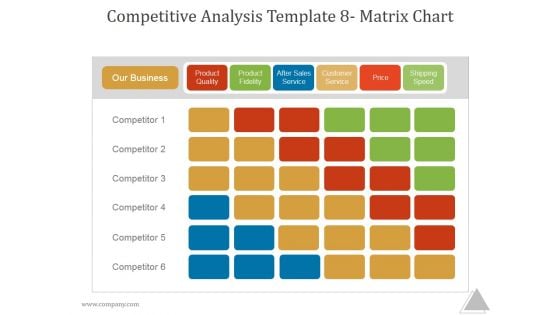
Competitive Analysis Template 8 Matrix Chart Ppt PowerPoint Presentation Templates
This is a competitive analysis template 8 matrix chart ppt powerpoint presentation templates. This is a six stage process. The stages in this process are our business, product quality, product fidelity, after sales service, customer service, price, shipping speed, competitor.
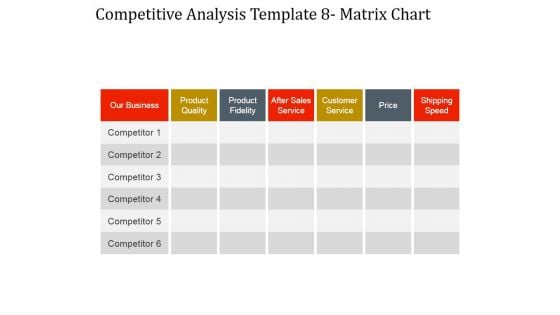
Competitive Analysis Matrix Chart Ppt PowerPoint Presentation Gallery
This is a competitive analysis matrix chart ppt powerpoint presentation gallery. This is a seven stage process. The stages in this process are our business, product quality, product fidelity, after sales service, customer service, price, shipping speed.
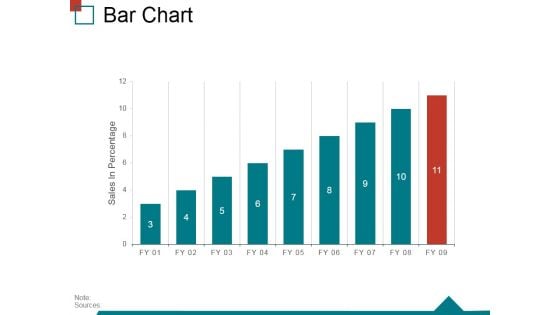
Bar Chart Ppt PowerPoint Presentation Infographic Template Skills
This is a bar chart ppt powerpoint presentation infographic template skills. This is a nine stage process. The stages in this process are sales in percentage, finance, business, marketing, strategy, success.
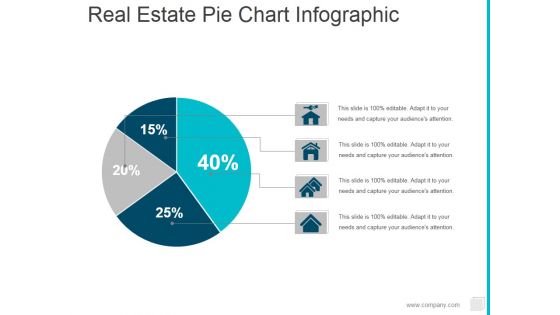
Real Estate Pie Chart Infographic Ppt PowerPoint Presentation Ideas Shapes
This is a real estate pie chart infographic ppt powerpoint presentation ideas shapes. This is a four stage process. The stages in this process are pie, finance, marketing, percentage.
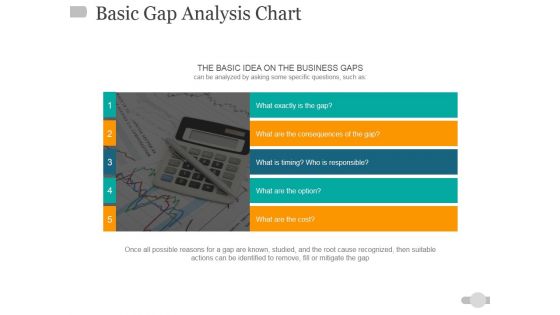
Basic Gap Analysis Chart Ppt PowerPoint Presentation Pictures Design Ideas
This is a basic gap analysis chart ppt powerpoint presentation pictures design ideas. This is a five stage process. The stages in this process are business, finance, marketing, analysis, investment.
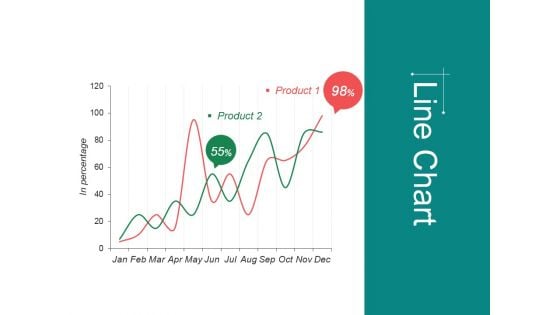
Line Chart Ppt Powerpoint Presentation Infographic Template Format
This is a line chart ppt powerpoint presentation infographic template format. This is a two stage process. The stages in this process are jan, feb, mar, apr, may, financial.

Scatter Bubble Chart Ppt PowerPoint Presentation Professional Model
This is a scatter bubble chart ppt powerpoint presentation professional model. This is a six stage process. The stages in this process are sales in profit, financial year, growth, business, marketing, strategy.
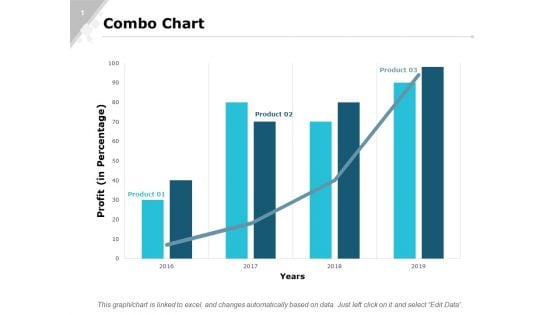
Combo Chart Graph Ppt PowerPoint Presentation Gallery Designs Download
This is a combo chart graph ppt powerpoint presentation gallery designs download. This is a three stage process. The stages in this process are finance, marketing, analysis, investment, million.
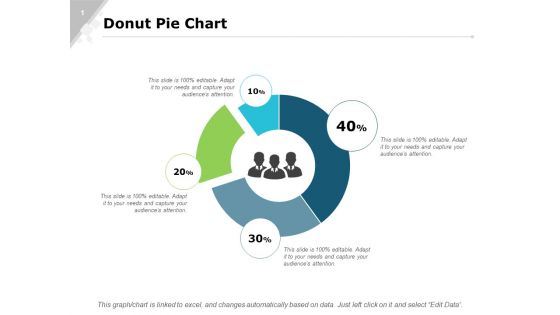
Donut Pie Chart Bar Ppt PowerPoint Presentation Infographics Slide Portrait
This is a donut pie chart bar ppt powerpoint presentation infographics slide portrait. This is a four stage process. The stages in this process are finance, marketing, analysis, investment, million.
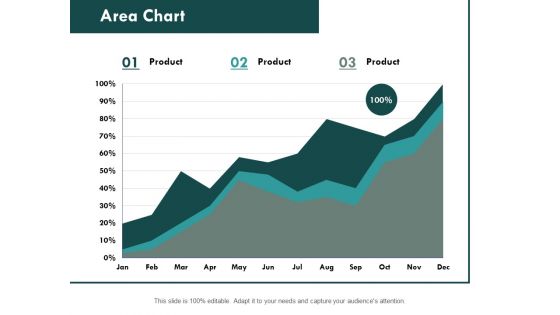
Area Chart Graph Ppt PowerPoint Presentation Professional Format Ideas
This is a column chart graph ppt powerpoint presentation slides file formats. This is a stage three process. The stages in this process are finance, marketing, analysis, investment, million.

Curve Chart For Product Life Cycle Presentation Outline
This is a curve chart for product life cycle presentation outline. This is a five stage process. The stages in this process are sales over time, product extension, introduction, growth, maturity, decline, time.
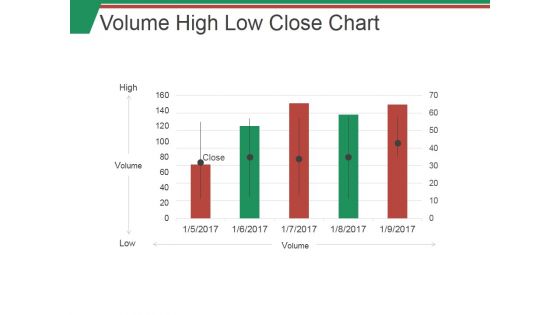
Volume High Low Close Chart Ppt PowerPoint Presentation Outline Examples
This is a volume high low close chart ppt powerpoint presentation outline examples. This is a five stage process. The stages in this process are high, low, volume, graph, business.
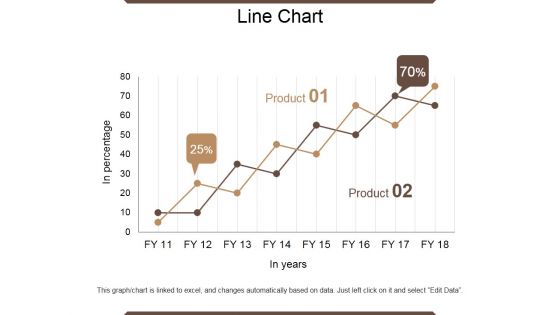
Line Chart Ppt PowerPoint Presentation Outline Infographic Template
This is a line chart ppt powerpoint presentation outline infographic template. This is a two stage process. The stages in this process are in percentage, product, in year, growth, success.
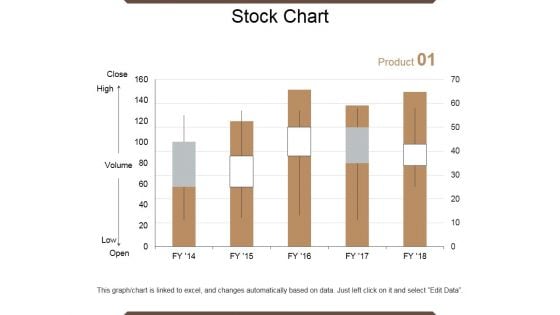
Stock Chart Ppt PowerPoint Presentation Outline Graphics Example
This is a stock chart ppt powerpoint presentation outline graphics example. This is a five stage process. The stages in this process are close, volume, low, high, open, product.
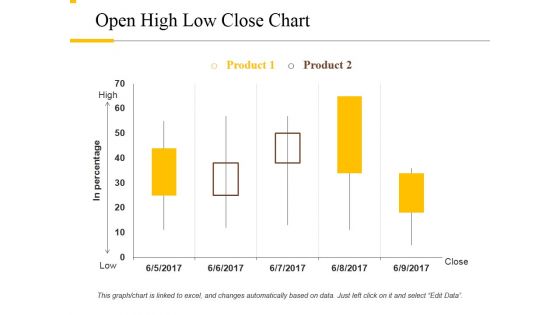
Open High Low Close Chart Ppt PowerPoint Presentation Outline Rules
This is a open high low close chart ppt powerpoint presentation outline rules. This is a two stage process. The stages in this process are product, high, low, close, in percentage.
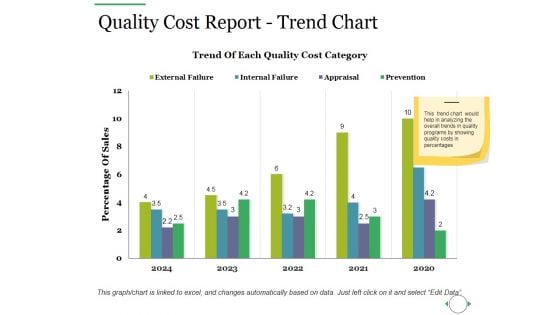
Quality Cost Report Trend Chart Ppt PowerPoint Presentation Outline Guidelines
This is a quality cost report trend chart ppt powerpoint presentation outline guidelines. This is a two stage process. The stages in this process are quality cost, appraisal cost, internal failure cost, external failure cost.
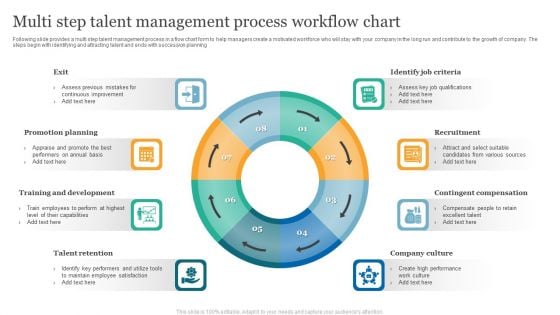
Multi Step Talent Management Process Workflow Chart Background PDF
Following slide provides a multi step talent management process in a flow chart form to help managers create a motivated workforce who will stay with your company in the long run and contribute to the growth of company. The steps begin with identifying and attracting talent and ends with succession planning. Presenting Multi Step Talent Management Process Workflow Chart Background PDF to dispense important information. This template comprises Eight stages. It also presents valuable insights into the topics including Promotion Planning, Training And Development, Talent Retention. This is a completely customizable PowerPoint theme that can be put to use immediately. So, download it and address the topic impactfully.
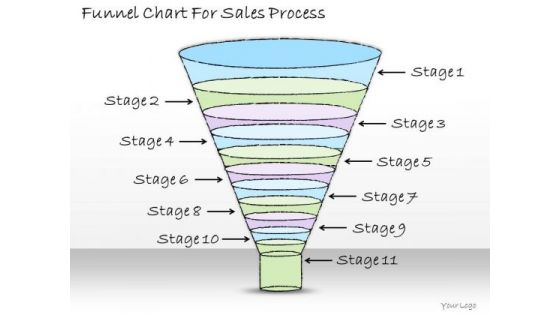
Ppt Slide Funnel Chart For Sales Process Plan
Touch Base With Our PPT Slide funnel chart for sales process plan Powerpoint Templates. Review Your Growth With Your Audience. Take A Deep Dive With Our Business Plan Powerpoint Templates. Get Into The Nitti Gritty Of It All.
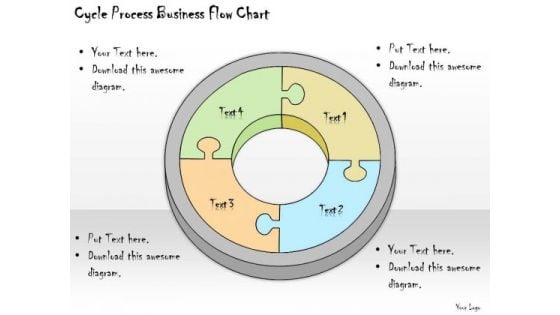
Ppt Slide Cycle Process Business Flow Chart Diagrams
Double Up Our PPT Slide cycle process business flow chart diagrams Powerpoint Templates With Your Thoughts. They Will Make An Awesome Pair. When In Doubt Use Our Business Plan Powerpoint Templates. The Way Ahead Will Become Crystal Clear.
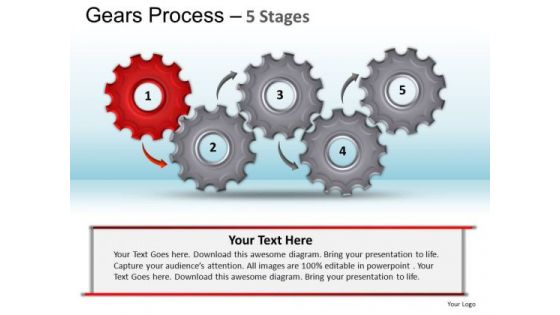
PowerPoint Design Slides Chart Gears Process Ppt Template
PowerPoint Design Slides Chart Gears Process PPT Template-The Circle of Life - a concept emmbedded in our minds and hence easy to comprehend. Life and Business is made up of processes comprising stages that flow from one to another. An excellent graphic to attract the attention of and understanding by your audience to improve earnings. Give your thoughts an extravagant display. Our PowerPoint Design Slides Chart Gears Process Ppt Template will add on extra dimensions.
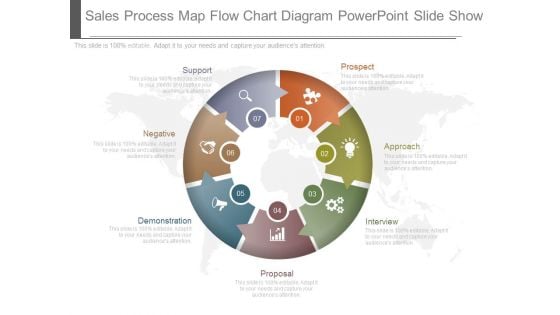
Sales Process Map Flow Chart Diagram Powerpoint Slide Show
This is a sales process map flow chart diagram powerpoint slide show. This is a seven stage process. The stages in this process are prospect, approach, interview, proposal, demonstration, negative, support.
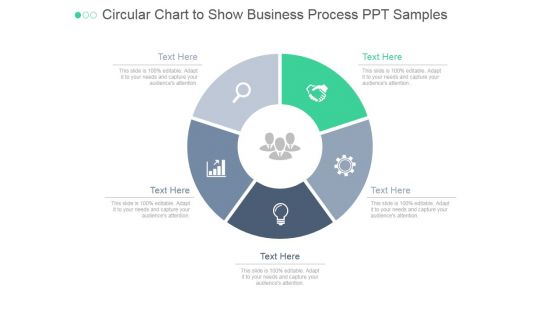
Circular Chart To Show Business Process Ppt PowerPoint Presentation Microsoft
This is a circular chart to show business process ppt powerpoint presentation microsoft. This is a five stage process. The stages in this process are business, marketing, strategy, process, icons.
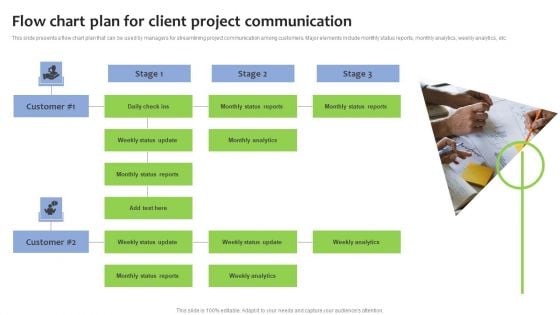
Flow Chart Plan For Client Project Communication Download PDF
This slide presents a flow chart plan that can be used by managers for streamlining project communication among customers. Major elements include monthly status reports, monthly analytics, weekly analytics, etc. Presenting Flow Chart Plan For Client Project Communication Download PDF to dispense important information. This template comprises one stages. It also presents valuable insights into the topics including Flow Chart Plan, Client Project Communication. This is a completely customizable PowerPoint theme that can be put to use immediately. So, download it and address the topic impactfully.
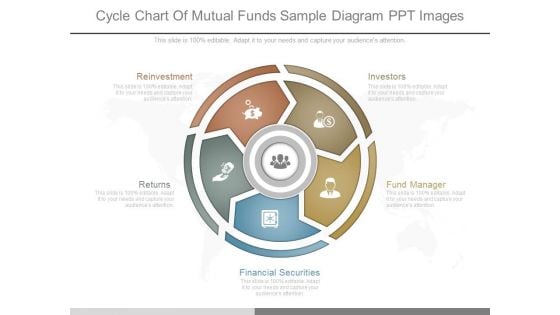
Cycle Chart Of Mutual Funds Sample Diagram Ppt Images
This is a cycle chart of mutual funds sample diagram ppt images. This is a five stage process. The stages in this process are reinvestment, returns, investors, fund manager, financial securities.
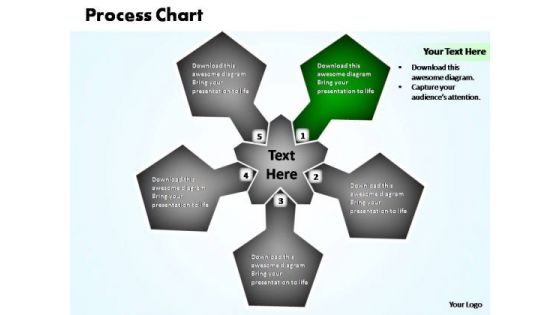
PowerPoint Templates Graphic Business Process Chart Ppt Slides
This easy to use diagrams can be used for information flow, business process automation, business process re-engineering. Audit your thoughts with our PowerPoint Templates Graphic Business Process Chart Ppt Slides. They will authenticate their excellence.
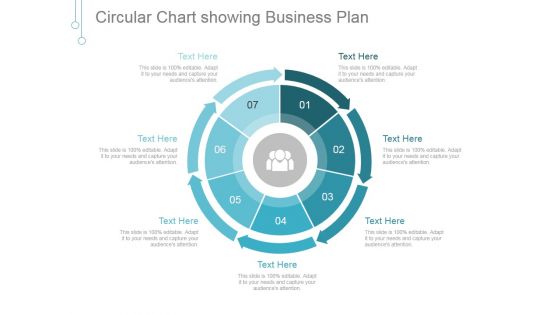
Circular Chart Showing Business Plan Ppt PowerPoint Presentation Shapes
This is a circular chart showing business plan ppt powerpoint presentation shapes. This is a seven stage process. The stages in this process are business, marketing, arrows, process, management.
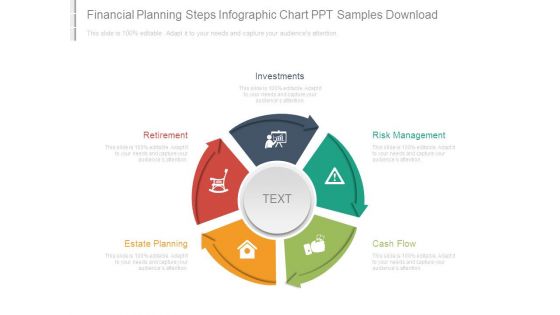
Financial Planning Steps Infographic Chart Ppt Samples Download
This is a financial planning steps infographic chart ppt samples download. This is a five stage process. The stages in this process are investments, retirement, estate planning, risk management, cash flow.
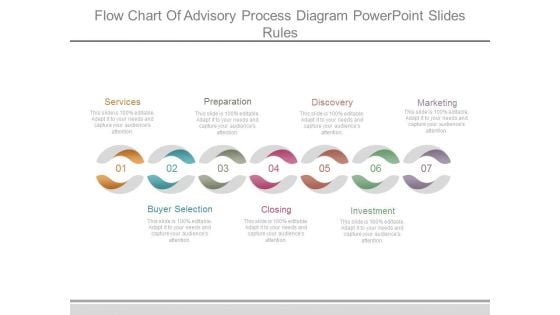
Flow Chart Of Advisory Process Diagram Powerpoint Slides Rules
This is a flow chart of advisory process diagram powerpoint slides rules. This is a seven stage process. The stages in this process are services, buyer selection, preparation, closing, discovery, investment, marketing.
Circular Arrow Chart With Business Icons Powerpoint Slides
Graphics of circular arrow chart with icons have been displayed in this business slide. This business diagram helps to exhibit strategy analysis and management. Use this PowerPoint template to visually support your content.
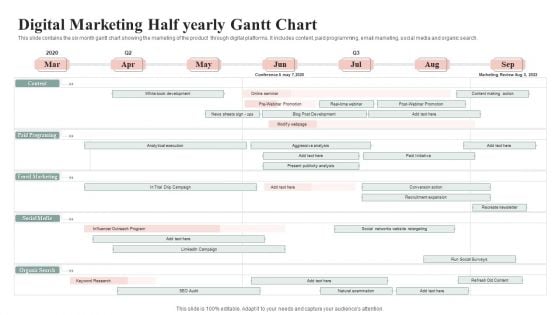
Digital Marketing Half Yearly Gantt Chart Elements PDF
This slide contains the six month gantt chart showing the marketing of the product through digital platforms. It includes content, paid programming, email marketing, social media and organic search. Showcasing this set of slides titled Digital Marketing Half Yearly Gantt Chart Elements PDF. The topics addressed in these templates are Email Marketing, Social Media, Organic Search. All the content presented in this PPT design is completely editable. Download it and make adjustments in color, background, font etc. as per your unique business setting.
Five Staged Process Chart And Icons Powerpoint Template
Develop competitive advantage with our above template which contains a five staged process chart with icons. This diagram provides an effective way of displaying business information. You can edit text, color, shade and style as per you need.
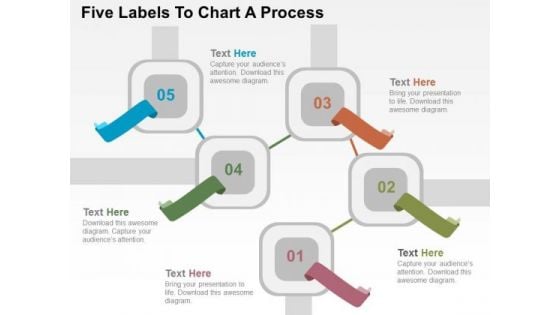
Five Labels To Chart A Process PowerPoint Templates
Our above slide contains graphics of five labels. This PPT label graphics may be used to chart a business process. The Powerpoint Templates can be customized as per requirements of business education or any other theme.
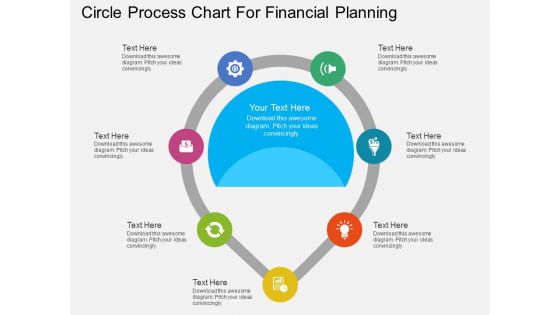
Seven Staged Circle Process Chart For Financial Planning Powerpoint Template
Our above PPT slide contains process chart with icons. This PowerPoint template may be used to display strategic planning methodology. This template is designed to attract the attention of your audience.
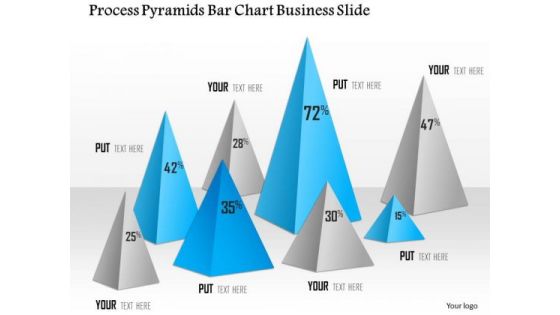
Business Diagram Process Pyramids Bar Chart Business Slide Presentation Template
Graphic of pyramid and bar chart has been used to design this power point template diagram. This PPT diagram contains the concept of business result analysis and process flow. Use this template slide and display result in your presentations.
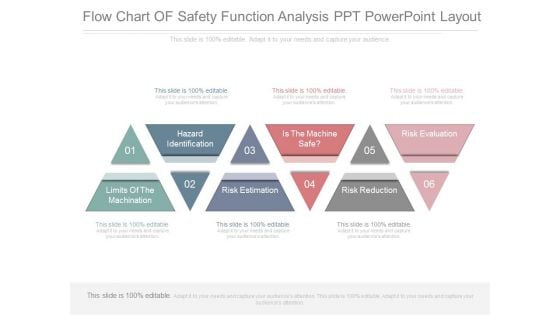
Flow Chart Of Safety Function Analysis Ppt Powerpoint Layout
This is a flow chart of safety function analysis ppt powerpoint layout. This is a six stage process. The stages in this process are hazard identification, limits of the machination, risk estimation, is the machine safe, risk reduction, risk evaluation.
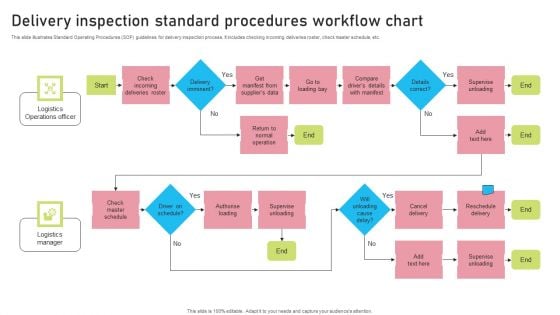
Delivery Inspection Standard Procedures Workflow Chart Introduction PDF
This slide illustrates Standard Operating Procedures SOP guidelines for delivery inspection process. It includes checking incoming deliveries roster, check master schedule, etc. Pitch your topic with ease and precision using this Delivery Inspection Standard Procedures Workflow Chart Introduction PDF. This layout presents information on Logistics Operations Officer, Logistics, Manager, End. It is also available for immediate download and adjustment. So, changes can be made in the color, design, graphics or any other component to create a unique layout.
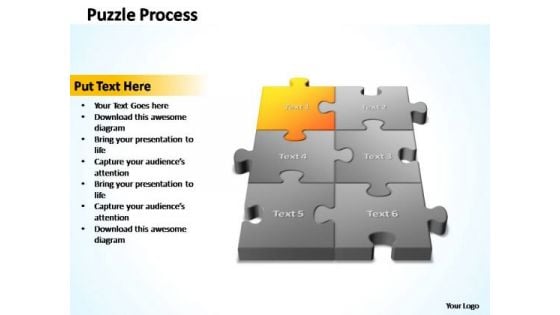
PowerPoint Template Chart 3d Puzzle Process Ppt Slides
This compelling graphics can be used showing relations and interfaces among various marketing activities. Bridge gaps with our PowerPoint Template Chart 3d Puzzle Process Ppt Slides. Just download, type and present.
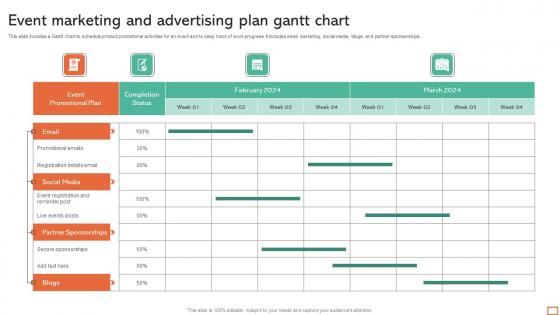
Event Marketing And Advertising Plan Gantt Chart Professional Pdf
This slide includes a Gantt chart to schedule product promotional activities for an event and to keep track of work progress. It includes email marketing, social media, blogs, and partner sponsorships. Pitch your topic with ease and precision using this Event Marketing And Advertising Plan Gantt Chart Professional Pdf. This layout presents information on Social Media, Partner Sponsorships. It is also available for immediate download and adjustment. So, changes can be made in the color, design, graphics or any other component to create a unique layout. This slide includes a Gantt chart to schedule product promotional activities for an event and to keep track of work progress. It includes email marketing, social media, blogs, and partner sponsorships.
Randomization Statistics Chart In Powerpoint And Google Slides Cpb
Introducing our well designed Randomization Statistics Chart In Powerpoint And Google Slides Cpb. This PowerPoint design presents information on topics like Randomization Statistics Chart. As it is predesigned it helps boost your confidence level. It also makes you a better presenter because of its high-quality content and graphics. This PPT layout can be downloaded and used in different formats like PDF, PNG, and JPG. Not only this, it is available in both Standard Screen and Widescreen aspect ratios for your convenience. Therefore, click on the download button now to persuade and impress your audience. Our Randomization Statistics Chart In Powerpoint And Google Slides Cpb are topically designed to provide an attractive backdrop to any subject. Use them to look like a presentation pro.
Immunoglobulins Function Chart In Powerpoint And Google Slides Cpb
Introducing our well designed Immunoglobulins Function Chart In Powerpoint And Google Slides Cpb. This PowerPoint design presents information on topics like Immunoglobulins Function Chart. As it is predesigned it helps boost your confidence level. It also makes you a better presenter because of its high-quality content and graphics. This PPT layout can be downloaded and used in different formats like PDF, PNG, and JPG. Not only this, it is available in both Standard Screen and Widescreen aspect ratios for your convenience. Therefore, click on the download button now to persuade and impress your audience. Our Immunoglobulins Function Chart In Powerpoint And Google Slides Cpb are topically designed to provide an attractive backdrop to any subject. Use them to look like a presentation pro.
Fitness Watch Comparison Chart In Powerpoint And Google Slides Cpb
Introducing our well designed Fitness Watch Comparison Chart In Powerpoint And Google Slides Cpb. This PowerPoint design presents information on topics like Fitness Watch Comparison Chart. As it is predesigned it helps boost your confidence level. It also makes you a better presenter because of its high quality content and graphics. This PPT layout can be downloaded and used in different formats like PDF, PNG, and JPG. Not only this, it is available in both Standard Screen and Widescreen aspect ratios for your convenience. Therefore, click on the download button now to persuade and impress your audience. Our Fitness Watch Comparison Chart In Powerpoint And Google Slides Cpb are topically designed to provide an attractive backdrop to any subject. Use them to look like a presentation pro.
Micro Expression Chart In Powerpoint And Google Slides Cpb
Introducing our well designed Micro Expression Chart In Powerpoint And Google Slides Cpb. This PowerPoint design presents information on topics like Micro Expression Chart. As it is predesigned it helps boost your confidence level. It also makes you a better presenter because of its high quality content and graphics. This PPT layout can be downloaded and used in different formats like PDF, PNG, and JPG. Not only this, it is available in both Standard Screen and Widescreen aspect ratios for your convenience. Therefore, click on the download button now to persuade and impress your audience. Our Micro Expression Chart In Powerpoint And Google Slides Cpb are topically designed to provide an attractive backdrop to any subject. Use them to look like a presentation pro.
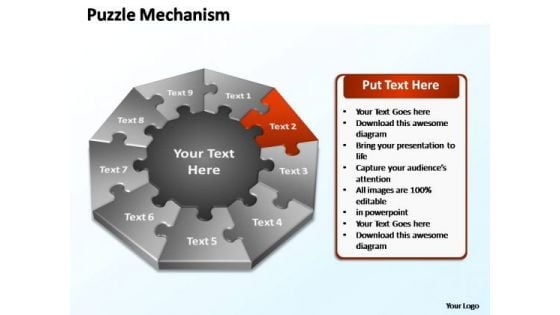
PowerPoint Presentation Designs Chart Puzzle Mechanism Ppt Theme
PowerPoint Presentation Designs Chart Puzzle Mechanism PPT Theme-The basic stages are in place. Various threads are joining up and being stitched together providing necessary strength Now you have to take the last leap. Illustrate your ideas and imprint them in the minds of your team with this template. Feel the buzz as they comprehend your plan to get the entire act together. Watch their eyes light up with enthusiasm as they see the dream emerge.-PowerPoint Presentation Designs Chart Puzzle Mechanism PPT Theme Encourage them to dream with our PowerPoint Presentation Designs Chart Puzzle Mechanism Ppt Theme. Get them going and thinking big.
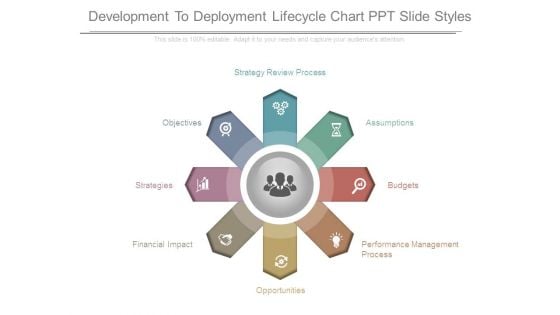
Development To Deployment Lifecycle Chart Ppt Slide Styles
This is a development to deployment lifecycle chart ppt slide styles. This is a eight stage process. The stages in this process are performance management process, opportunities, financial impact, strategies, objectives, strategy review process, assumptions, budgets.
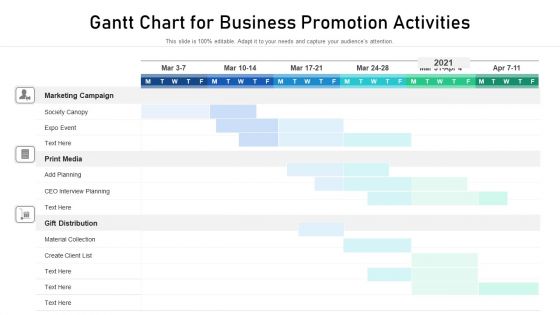
Gantt Chart For Business Promotion Activities Sample PDF
Design a highly optimized project management report using this well-researched gantt chart for business promotion activities sample pdf. This layout can be used to present the professional details of a task or activity. Showcase the activities allocated to the business executives with this Gantt Chart PowerPoint theme. List down the column tasks in various timeframes and allocate time for each. In addition, also monitor the actual time and make comparisons to interpret the final progress using this innovative Gantt Chart Template. Showcase the work breakdown structure to attract your audience. Download and share it using Google Slides, if it suits your requirement.
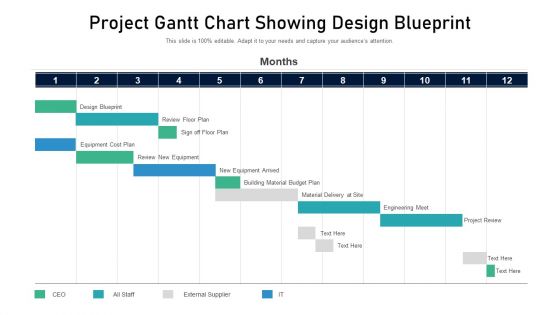
Project Gantt Chart Showing Design Blueprint Rules PDF
Design a highly optimized project management report using this well-researched project gantt chart showing design blueprint rules pdf. This layout can be used to present the professional details of a task or activity. Showcase the activities allocated to the business executives with this Gantt Chart PowerPoint theme. List down the column tasks in various timeframes and allocate time for each. In addition, also monitor the actual time and make comparisons to interpret the final progress using this innovative Gantt Chart Template. Showcase the work breakdown structure to attract your audience. Download and share it using Google Slides, if it suits your requirement.
Linear Diamond Chart With Icons For Financial Progress Powerpoint Template
This PowerPoint template has been designed with linear diamond chart with icons. This diagram helps to exhibit financial progress. Present your views using this innovative slide and be assured of leaving a lasting impression.
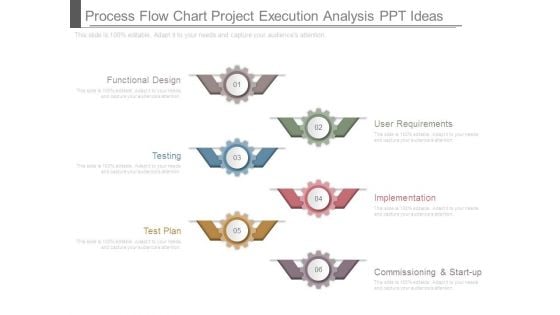
Process Flow Chart Project Execution Analysis Ppt Ideas
This is a process flow chart project execution analysis ppt ideas. This is a six stage process. The stages in this process are functional design, testing, test plan, user requirements, implementation, commissioning and start up.
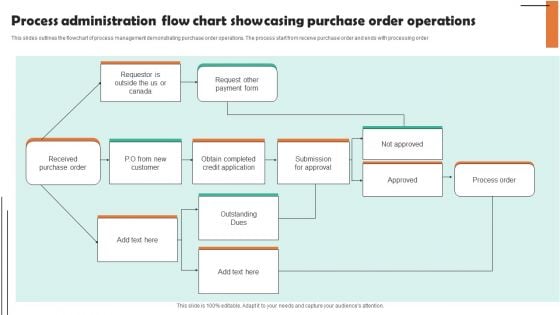
Process Administration Flow Chart Showcasing Purchase Order Operations Elements PDF
This slides outlines the flowchart of process management demonstrating purchase order operations. The process start from receive purchase order and ends with processing order. Presenting Process Administration Flow Chart Showcasing Purchase Order Operations Elements PDF to dispense important information. This template comprises one stages. It also presents valuable insights into the topics including Request Other Payment, Received Purchase Order, Outstanding Dues. This is a completely customizable PowerPoint theme that can be put to use immediately. So, download it and address the topic impactfully.
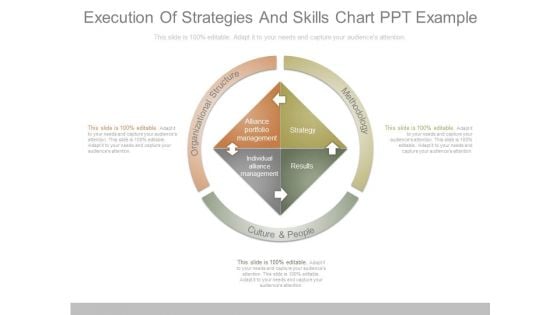
Execution Of Strategies And Skills Chart Ppt Example
This is a execution of strategies and skills chart ppt example. This is a three stage process. The stages in this process are methodology, culture and people, organizational structure, alliance portfolio management, strategy, individual alliance management, results.
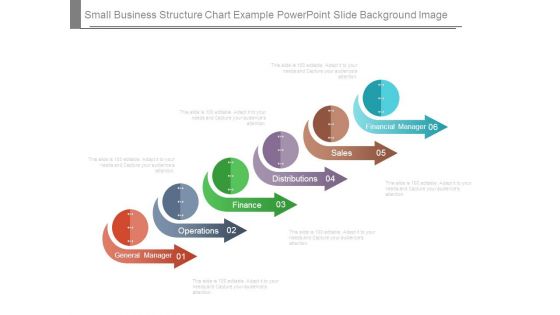
Small Business Structure Chart Example Powerpoint Slide Background Image
This is a small business structure chart example powerpoint slide background image. This is a six stage process. The stages in this process are financial manager, sales, distributions, finance, operations, general manager.
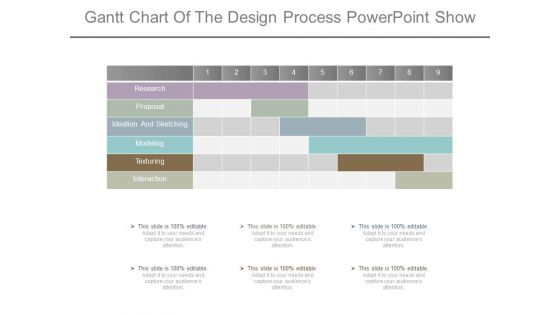
Gantt Chart Of The Design Process Powerpoint Show
This is a gantt chart of the design process powerpoint show. This is a one stage process. The stages in this process are research, proposal, ideation and sketching, modeling, texturing, interaction.
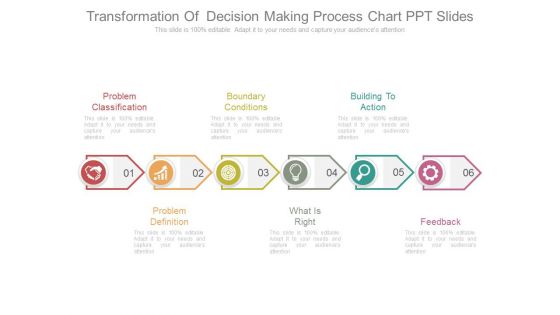
Transformation Of Decision Making Process Chart Ppt Slides
This is a transformation of decision making process chart ppt slides. This is a six stage process. The stages in this process are problem classification, boundary conditions, building to action, problem definition, what is right, feedback.
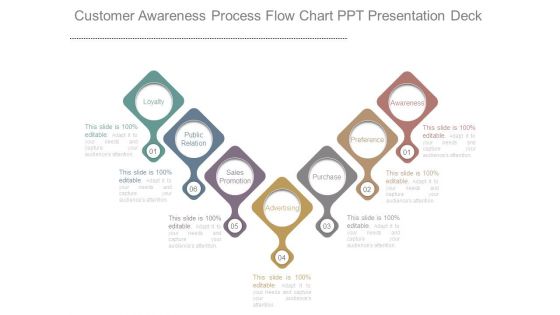
Customer Awareness Process Flow Chart Ppt Presentation Deck
This is a customer awareness process flow chart ppt presentation deck. This is a seven stage process. The stages in this process are loyalty, public relation, sales promotion, advertising, purchase, preference, awareness.
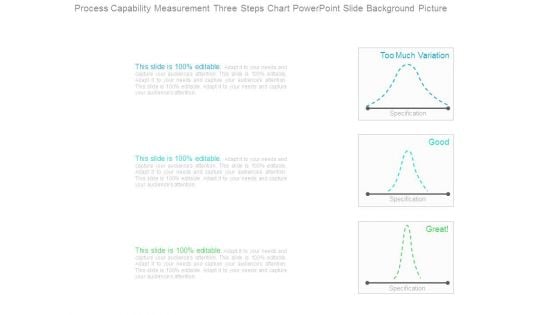
Process Capability Measurement Three Steps Chart Powerpoint Slide Background Picture
This is a process capability measurement three steps chart powerpoint slide background picture. This is a three stage process. The stages in this process are too much variation, specification, good, great.
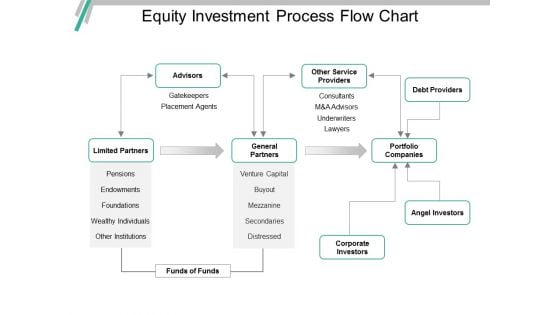
Equity Investment Process Flow Chart Ppt PowerPoint Presentation Ideas
This is a equity investment process flow chart ppt powerpoint presentation ideas. This is a three stage process. The stages in this process are investment, funding, private equity, venture capital.


 Continue with Email

 Home
Home


