Control Chart
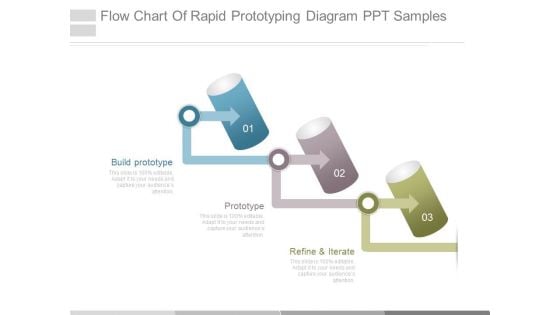
Flow Chart Of Rapid Prototyping Diagram Ppt Samples
This is a flow chart of rapid prototyping diagram ppt samples. This is a three stage process. The stages in this process are build prototype, prototype, refine and iterate.
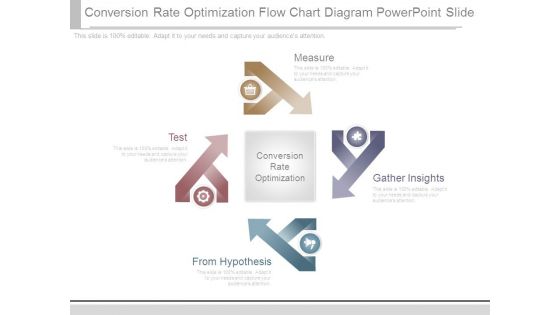
Conversion Rate Optimization Flow Chart Diagram Powerpoint Slide
This is a conversion rate optimization flow chart diagram powerpoint slide. This is a four stage process. The stages in this process are measure, gather insights, from hypothesis, test, conversion rate optimization.
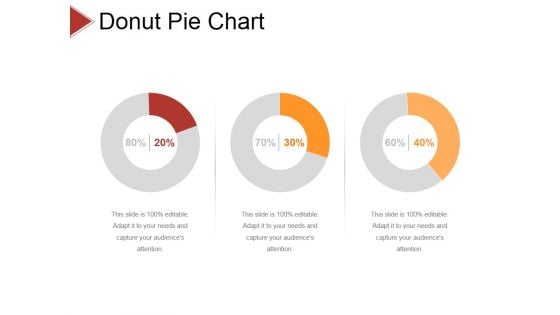
Donut Pie Chart Ppt PowerPoint Presentation Infographic Template Diagrams
This is a donut pie chart ppt powerpoint presentation infographic template diagrams. This is a three stage process. The stages in this process are business, strategy, analysis, pretention, comparison.
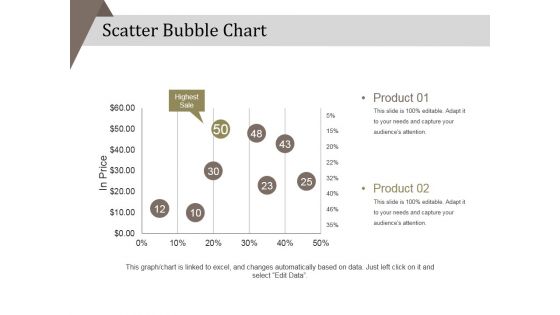
Scatter Bubble Chart Ppt PowerPoint Presentation Diagram Ppt
This is a scatter bubble chart ppt powerpoint presentation diagram ppt. This is a two stage process. The stages in this process are product, in price, highest sale, percentage, business, marketing.
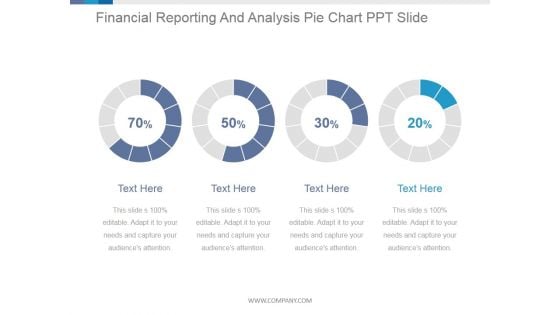
Financial Reporting And Analysis Pie Chart Ppt PowerPoint Presentation Guidelines
This is a financial reporting and analysis pie chart ppt powerpoint presentation guidelines. This is a four stage process. The stages in this process are process, percentage, business, marketing, finance.
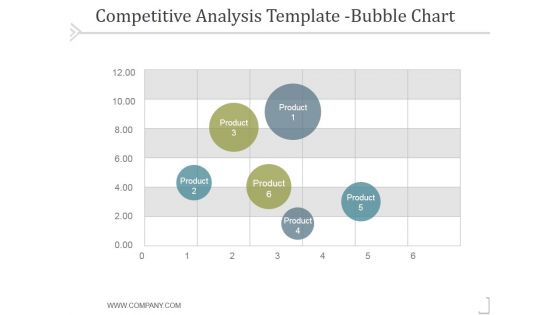
Competitive Analysis Bubble Chart Template 1 Ppt PowerPoint Presentation Influencers
This is a competitive analysis bubble chart template 1 ppt powerpoint presentation influencers. This is a six stage process. The stages in this process are business, strategy, marketing, success, process.
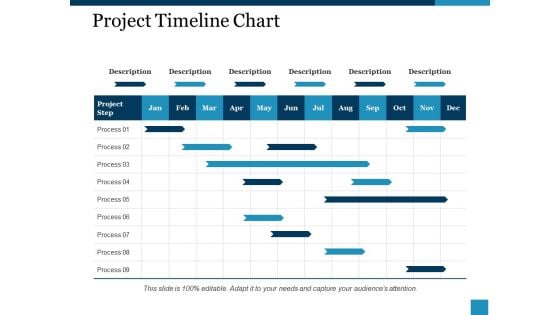
Project Timeline Chart Ppt PowerPoint Presentation Portfolio Gridlines
This is a project timeline chart ppt powerpoint presentation portfolio gridlines. This is a nine stage process. The stages in this process are description, process, project step, table, business.
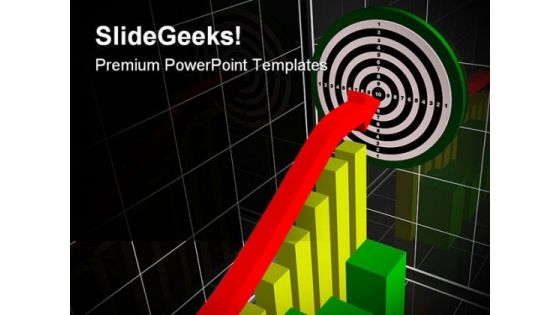
Performance Chart Business PowerPoint Templates And PowerPoint Backgrounds 0311
Microsoft PowerPoint Template and Background with business picture about analysis graph arrow and target Illustrate the essential elements of the project. Delve into the basic nature with our Performance Chart Business PowerPoint Templates And PowerPoint Backgrounds 0311.
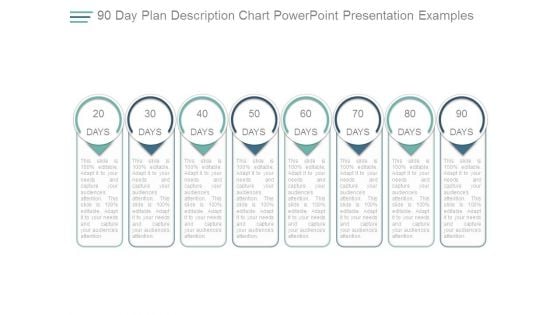
90 Day Plan Description Chart Powerpoint Presentation Examples
This is a 90 day plan description chart powerpoint presentation examples. This is a eight stage process. The stages in this process are 20 days, 30 days, 40 days, 50 days, 60 days, 70 days, 80 days, 90 days.
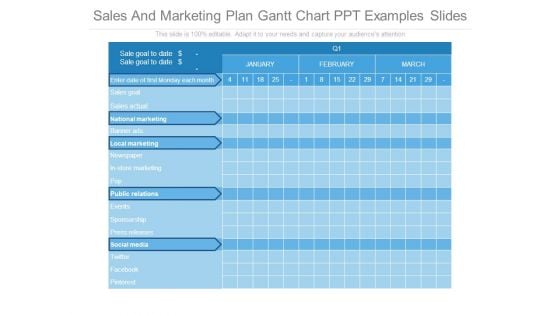
Sales And Marketing Plan Gantt Chart Ppt Examples Slides
This is a sales and marketing plan gantt chart ppt examples slides. This is a three stage process. The stages in this process are sales goal, sales actual, banner ads, newspaper, in store marketing.
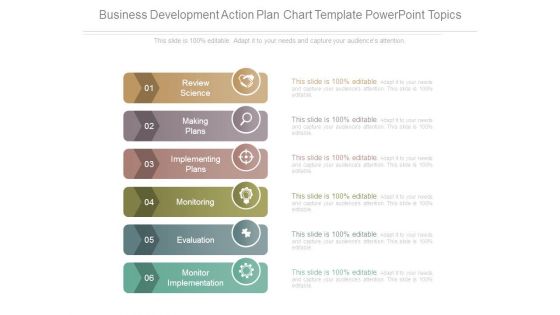
Business Development Action Plan Chart Template Powerpoint Topics
This is a business development action plan chart template powerpoint topics. This is a six stage process. The stages in this process are review science, making plans, implementing plans, monitoring, evaluation, monitor implementation.
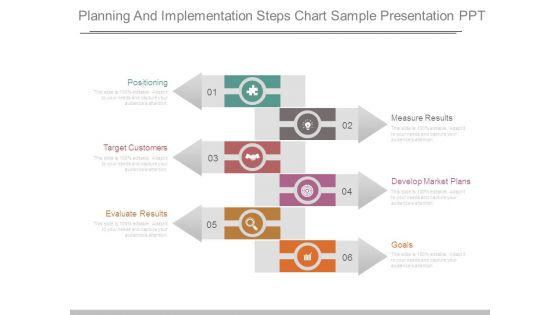
Planning And Implementation Steps Chart Sample Presentation Ppt
This is a planning and implementation steps chart sample presentation ppt. This is a six stage process. The stages in this process are positioning, target customers, evaluate results, measure results, develop market plans, goals.
Project Charter Linear Chart With Icons Powerpoint Slide Background
This is a project charter linear chart with icons powerpoint slide background. This is a five stage process. The stages in this process are resources team roles, project milestone, project scope, problem statement goal statement, business case.
Donut Pie Chart Ppt PowerPoint Presentation Icon Slide Portrait
This is a donut pie chart ppt powerpoint presentation icon slide portrait. This is a five stage process. The stages in this process are product, percentage, finance, donut, business.
Combo Chart Ppt PowerPoint Presentation Icon Design Templates
This is a combo chart ppt powerpoint presentation icon design templates. This is a three stage process. The stages in this process are market size, growth rate, product, business, success.
Scatter Line Chart Ppt PowerPoint Presentation Icon Files
This is a scatter line chart ppt powerpoint presentation icon files. This is a one stage process. The stages in this process are dollar in millions, product, sales in percentage.
Five Steps Chart With Icons Ppt PowerPoint Presentation Infographics Guidelines
This is a five steps chart with icons ppt powerpoint presentation infographics guidelines. This is a five stage process. The stages in this process are boxes and arrows, cartoon and arrows, text boxes with arrows.
Growth Arrow Chart Vector Icon Ppt PowerPoint Presentation Slides Mockup
This is a growth arrow chart vector icon ppt powerpoint presentation slides mockup. This is a three stage process. The stages in this process are rising arrow, growing arrow, increasing arrow.
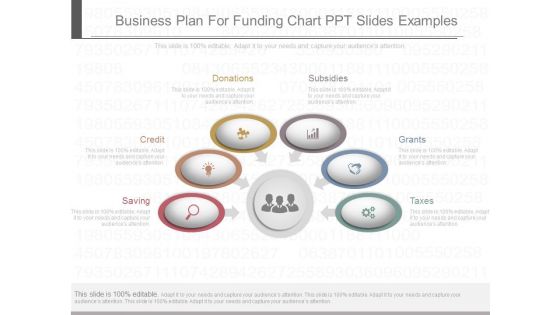
Business Plan For Funding Chart Ppt Slides Examples
This is a business plan for funding chart ppt slides examples. This is a five stage process. The stages in this process are saving, credit, donations, subsidies, grants, taxes.
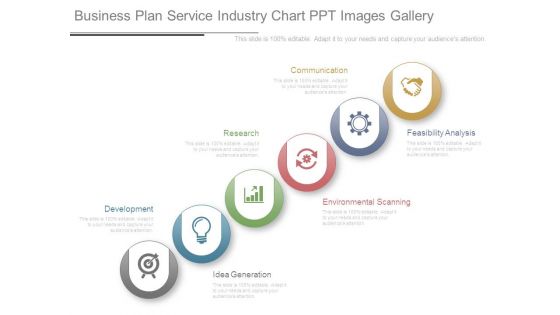
Business Plan Service Industry Chart Ppt Images Gallery
This is a business plan service industry chart ppt images gallery. This is a six stage process. The stages in this process are development, research, communication, idea generation, environmental scanning, feasibility analysis.
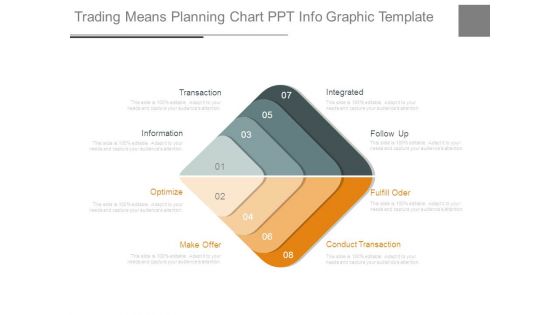
Trading Means Planning Chart Ppt Info Graphic Template
This is a trading means planning chart ppt info graphic template. This is a eight stage process. The stages in this process are transaction, information, optimize, make offer, integrated, follow up, fulfill order, conduct transaction.
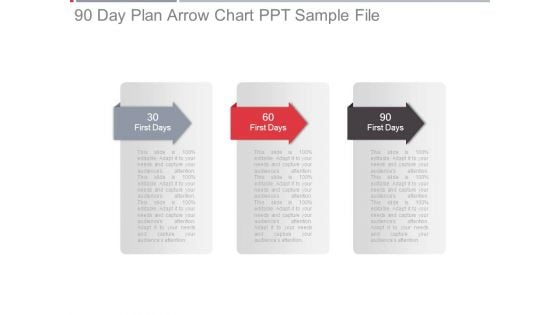
90 Day Plan Arrow Chart Ppt Sample File
This is a 90 day plan arrow chart ppt sample file. This is a three stage process. The stages in this process are 30 first days, 60 first days, 90 first days.
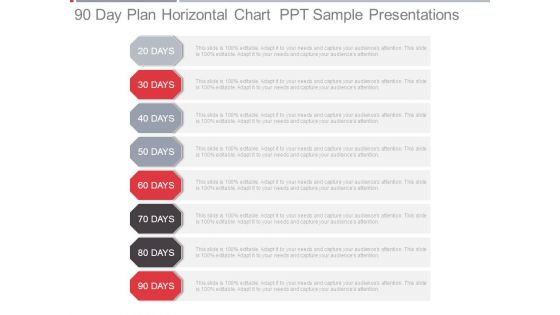
90 Day Plan Horizontal Chart Ppt Sample Presentations
This is a 90 day plan horizontal chart ppt sample presentations. This is a eight stage process. The stages in this process are 20 days, 30 days, 40 days, 50 days, 60 days, 70 days, 80 days, 90 days.
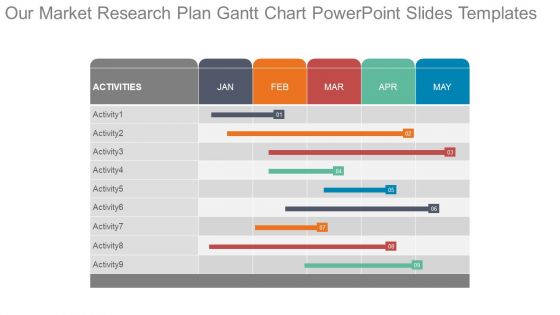
Our Market Research Plan Gantt Chart Powerpoint Slides Templates
This is a our market research plan gantt chart powerpoint slides templates. This is a nine stage process. The stages in this process are activities, jan, feb, mar, apr, may.
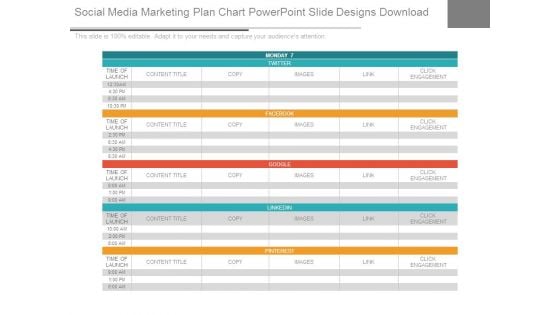
Social Media Marketing Plan Chart Powerpoint Slide Designs Download
This is a social media marketing plan chart powerpoint slide designs download. This is a five stage process. The stages in this process are content title, copy, images, link, click engagement.
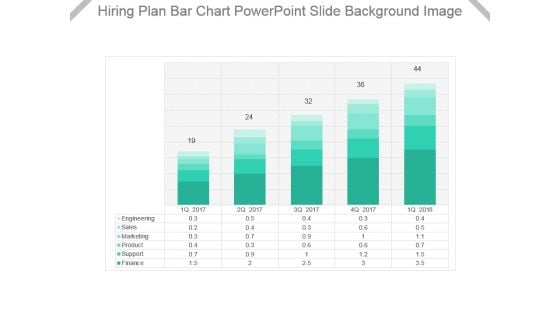
Hiring Plan Bar Chart Powerpoint Slide Background Image
This is a hiring plan bar chart powerpoint slide background image. This is a five stage process. The stages in this process are engineering, sales, marketing, product, support, finance.
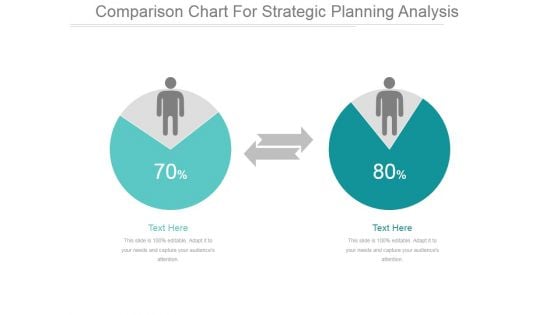
Comparison Chart For Strategic Planning Analysis Ppt PowerPoint Presentation Example
This is a comparison chart for strategic planning analysis ppt powerpoint presentation example. This is a two stage process. The stages in this process are business, finance, marketing, strategy, success.
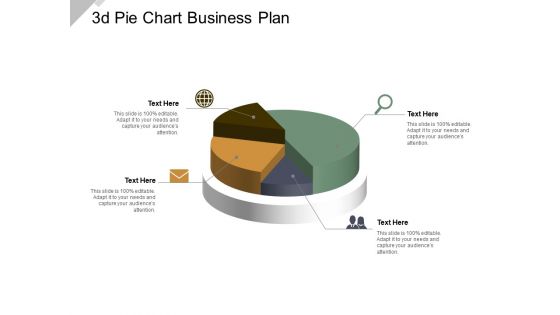
3D Pie Chart Business Plan Ppt PowerPoint Presentation Model Guidelines
This is a 3d pie chart business plan ppt powerpoint presentation model guidelines. This is a four stage process. The stages in this process are art, colouring, paint brush.
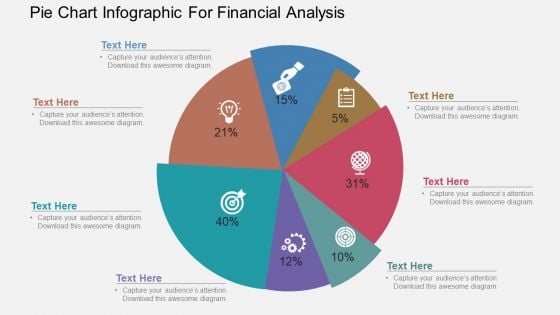
Pie Chart Infographic For Financial Analysis Powerpoint Template
Our above PowerPoint template has been designed with pie chart infographic. This slide is suitable to present financial analysis. Use this business diagram to present your work in a more smart and precise manner.
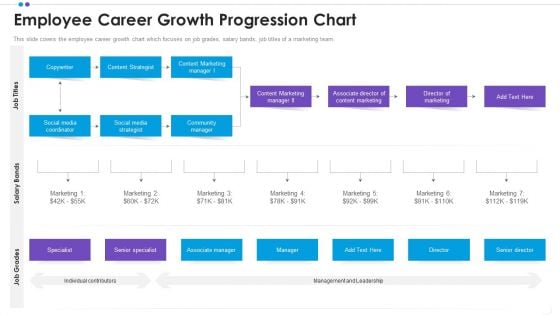
Employee Professional Development Employee Career Growth Progression Chart Formats PDF
This slide covers the employee career growth chart which focuses on job grades, salary bands, job titles of a marketing team.Deliver and pitch your topic in the best possible manner with this employee professional development employee career growth progression chart formats pdf Use them to share invaluable insights on social media coordinator, social media strategist, community manager and impress your audience. This template can be altered and modified as per your expectations. So, grab it now.
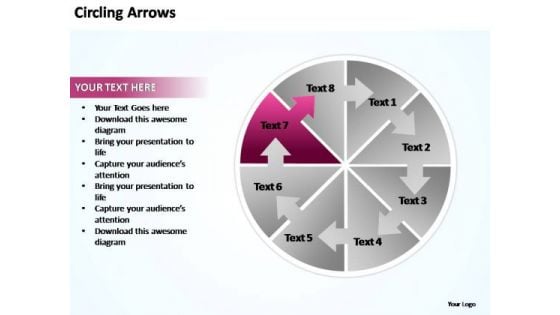
PowerPoint Templates Circling Arrows Flow Chart Ppt Backgrounds
PowerPoint Templates Circling Arrows Flow Chart PPT Backgrounds-Explore the various directions and layers existing in your in your plans and processes. Unravel the desired and essential elements of your overall strategy. Explain the relevance of the different layers and stages and directions in getting down to your core competence, ability and desired result. Recommend plans with our PowerPoint Templates Circling Arrows Flow Chart Ppt Backgrounds. Download without worries with our money back guaranteee.
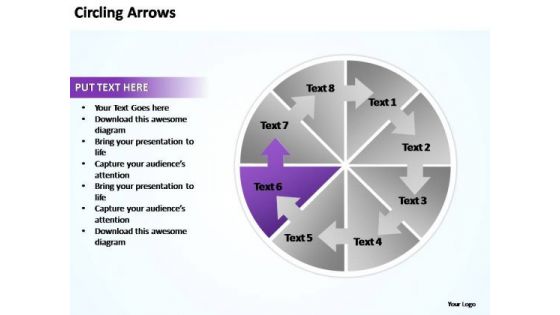
PowerPoint Templates Circling Arrows Flow Chart Ppt Design Slides
PowerPoint Templates Circling Arrows Flow Chart PPT Design Slides-Explore the various directions and layers existing in your in your plans and processes. Unravel the desired and essential elements of your overall strategy. Explain the relevance of the different layers and stages and directions in getting down to your core competence, ability and desired result. Our PowerPoint Templates Circling Arrows Flow Chart Ppt Design Slides give expression to your drive. They emit the essence of your determination.
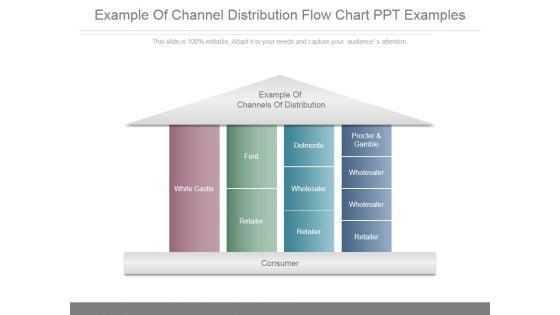
Example Of Channel Distribution Flow Chart Ppt Examples
This is a example of channel distribution flow chart ppt examples. This is a one stage process. The stages in this process are white castle, ford, retailer, delmont, wholesaler, retailer.
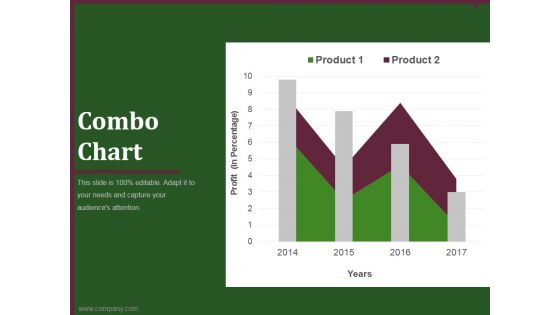
combo chart template 2 ppt powerpoint presentation background images
This is a combo chart template 2 ppt powerpoint presentation background images. This is a four stage process. The stages in this process are business, marketing, finance, timeline, product.
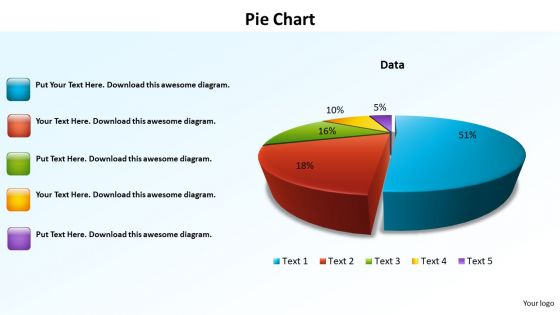
PowerPoint Templates Data Driven Pie Chart Ppt Themes
PowerPoint Templates Data Driven Pie Chart PPT Themes-The Circle of Life - a concept emmbedded in our minds and hence easy to comprehend. Life and Business is made up of processes comprising stages that flow from one to another. An excellent graphic to attract the attention of and understanding by your audience to improve earnings. Document growth with our PowerPoint Templates Data Driven Pie Chart Ppt Themes. Download without worries with our money back guaranteee.
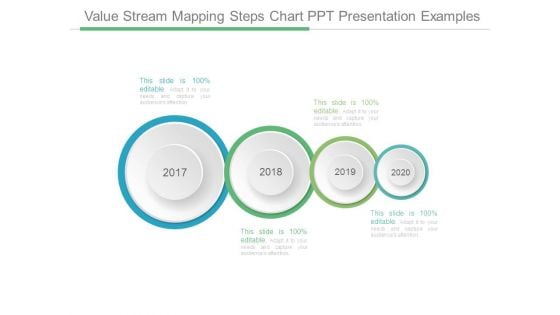
Value Stream Mapping Steps Chart Ppt Presentation Examples
This is a value stream mapping steps chart ppt presentation examples. This is a four stage process. The stages in this process are years, time planning, business, marketing, future.

High Low Close Chart Ppt PowerPoint Presentation Summary Ideas
This is a high low close chart ppt powerpoint presentation summary ideas. This is a five stage process. The stages in this process are business, strategy, marketing, analysis, growth.
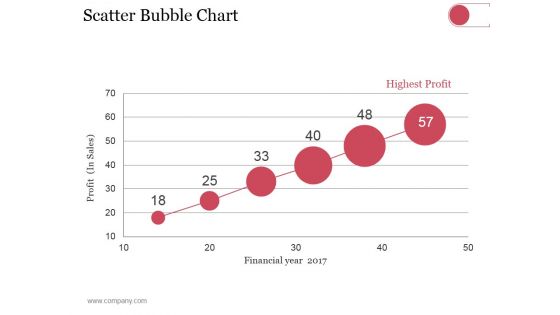
Scatter Bubble Chart Ppt PowerPoint Presentation Summary Pictures
This is a scatter bubble chart ppt powerpoint presentation summary pictures. This is a six stage process. The stages in this process are highest profit, financial year, profit in sales.
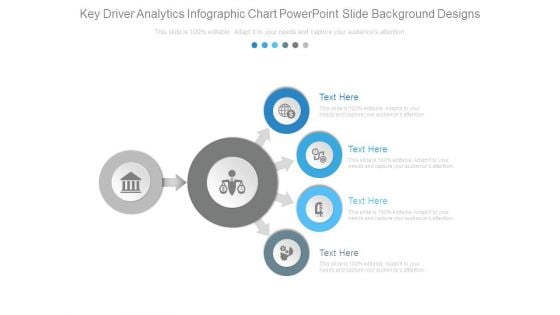
Key Driver Analytics Infographic Chart Powerpoint Slide Background Designs
This is a key driver analytics infographic chart powerpoint slide background designs. This is a four stage process. The stages in this process are business, marketing, arrows, icons, strategy.
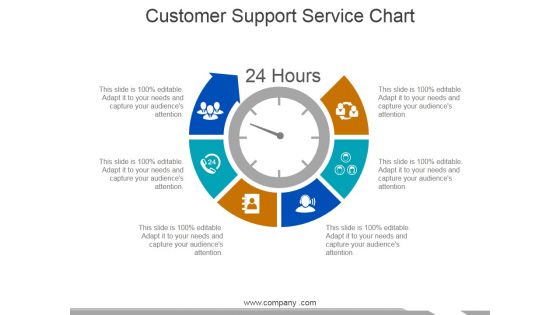
Customer Support Service Chart Ppt PowerPoint Presentation Infographic Template Graphics
This is a customer support service chart ppt powerpoint presentation infographic template graphics. This is a six stage process. The stages in this process are business, icons, strategy, marketing.
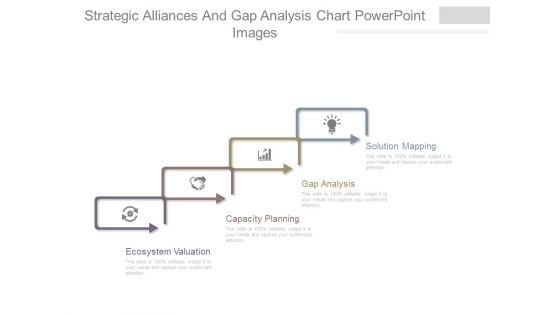
Strategic Alliances And Gap Analysis Chart Powerpoint Images
This is a strategic alliances and gap analysis chart powerpoint images. This is a four stage process. The stages in this process are solution mapping, gap analysis, capacity planning, ecosystem valuation.
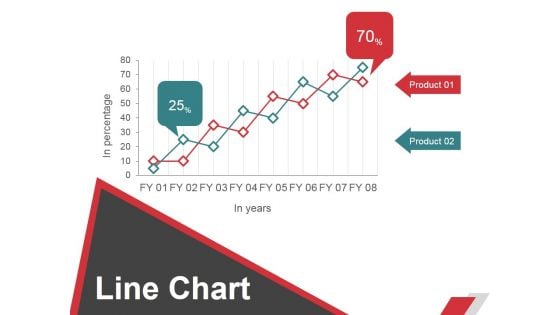
Line Chart Ppt PowerPoint Presentation File Graphic Images
This is a line chart ppt powerpoint presentation file graphic images. This is a two stage process. The stages in this process are business, strategy, marketing, planning, growth strategy, finance.

Donut Pie Chart Ppt PowerPoint Presentation Infographics Outfit
This is a donut pie chart ppt powerpoint presentation infographics outfit. This is a three stage process. The stages in this process are business, strategy, analysis, planning, dashboard, finance.
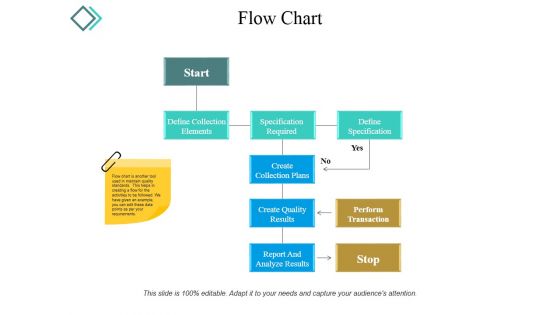
Flow Chart Ppt PowerPoint Presentation Styles Example Topics
This is a flow chart ppt powerpoint presentation styles example topics. This is a nine stage process. The stages in this process are start, create collection plans, define specification, specification required.

Donut Pie Chart Ppt PowerPoint Presentation File Example Introduction
This is a donut pie chart ppt powerpoint presentation file example introduction. This is a three stage process. The stages in this process are business, marketing, finance, planning, analysis.
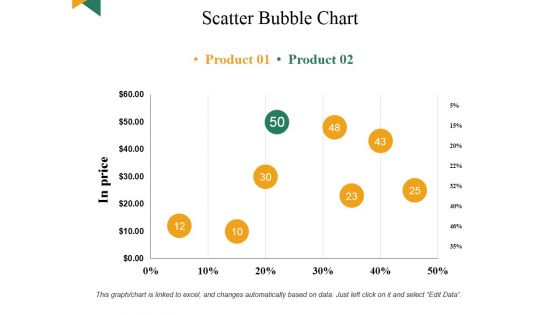
Scatter Bubble Chart Ppt PowerPoint Presentation Summary Visual Aids
This is a scatter bubble chart ppt powerpoint presentation summary visual aids. This is a eight stage process. The stages in this process are business, marketing, finance, analysis, planning.

Quality Cost Report Trend Chart Ppt PowerPoint Presentation Portfolio Maker
This is a quality cost report trend chart ppt powerpoint presentation portfolio maker. This is a two stage process. The stages in this process are compare, marketing, business, strategy, planning.
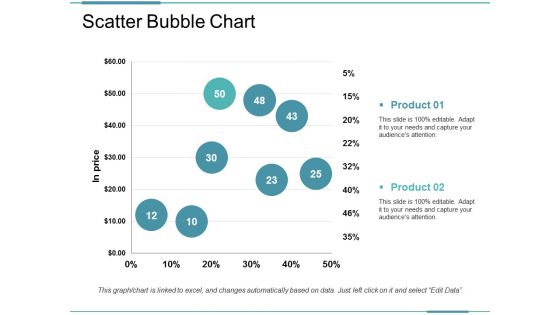
Scatter Bubble Chart Template Ppt PowerPoint Presentation Professional Background
This is a scatter bubble chart template ppt powerpoint presentation professional background. This is a six stage process. The stages in this process are business, marketing, strategy, planning, finance.
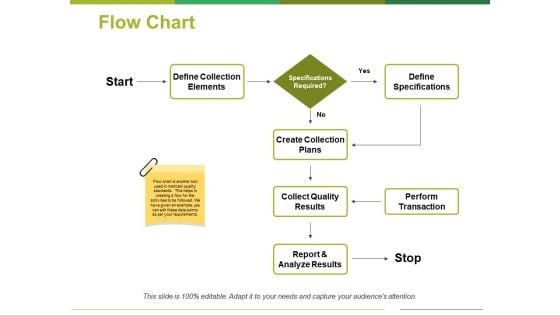
Flow Chart Ppt PowerPoint Presentation File Infographic Template
This is a flow chart ppt powerpoint presentation file infographic template. This is a seven stage process. The stages in this process are start, define specifications, perform transaction, create collection plans, report and analyze results.
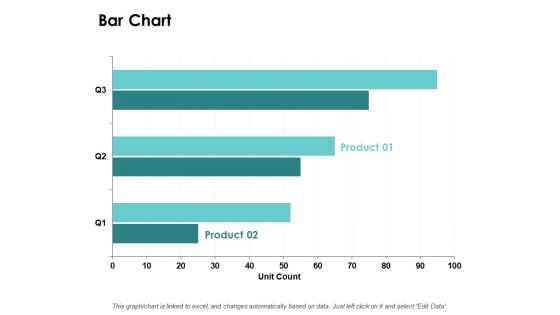
Bar Chart Graph Ppt PowerPoint Presentation Outline Structure
Presenting this set of slides with name bar chart graph ppt powerpoint presentation outline structure. The topics discussed in these slides are marketing, business, management, planning, strategy. This is a completely editable PowerPoint presentation and is available for immediate download. Download now and impress your audience.
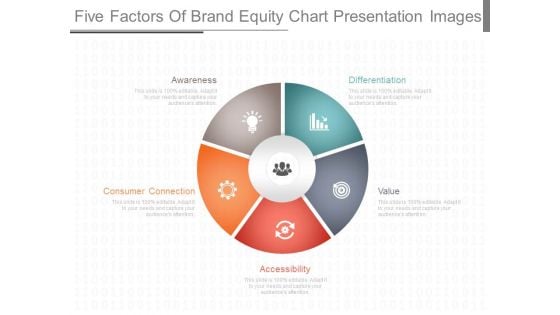
Five Factors Of Brand Equity Chart Presentation Images
This is a five factors of brand equity chart presentation images. This is a five stage process. The stages in this process are awareness, differentiation, consumer connection, accessibility, value. \n \n \n \n \n \n \n \n \n \n
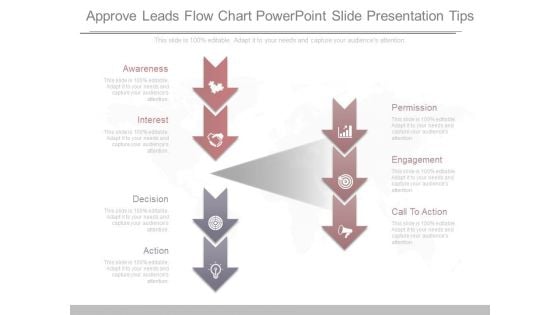
Approve Leads Flow Chart Powerpoint Slide Presentation Tips
This is a approve leads flow chart powerpoint slide presentation tips. This is a seven stage process. The stages in this process are awareness, interest, decision, action, permission, engagement, call to action.
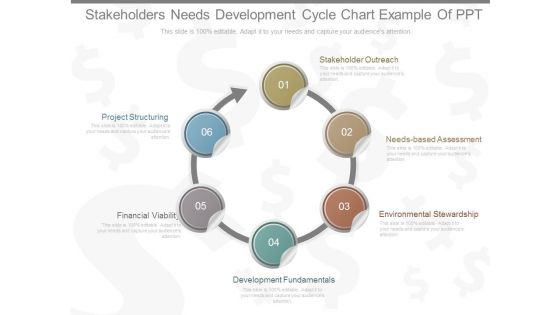
Stakeholders Needs Development Cycle Chart Example Of Ppt
This is a stakeholders needs development cycle chart example of ppt. This is a six stage process. The stages in this process are stakeholder outreach, needs based assessment, environmental stewardship,, development fundamentals, financial viability, project structuring.
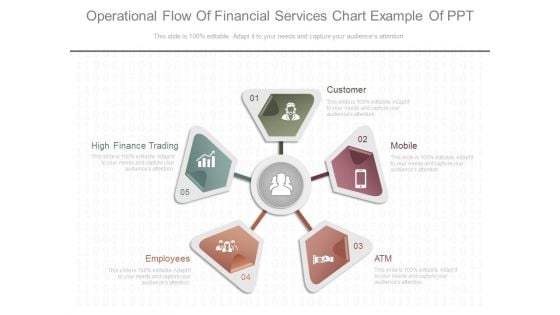
Operational Flow Of Financial Services Chart Example Of Ppt
This is a operational flow of financial services chart example of ppt. This is a five stage process. The stages in this process are customer, mobile, atm, employees, high finance trading.
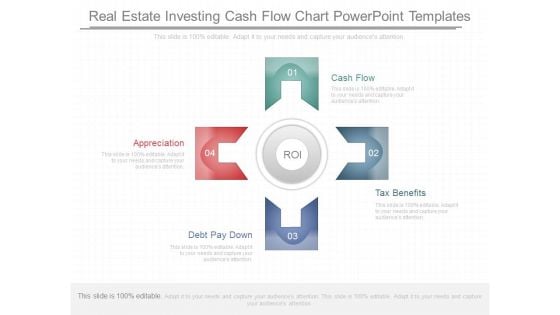
Real Estate Investing Cash Flow Chart Powerpoint Templates
This is a real estate investing cash flow chart powerpoint templates. This is a four stage process. The stages in this process are cash flow, tax benefits, debt pay down, appreciation.
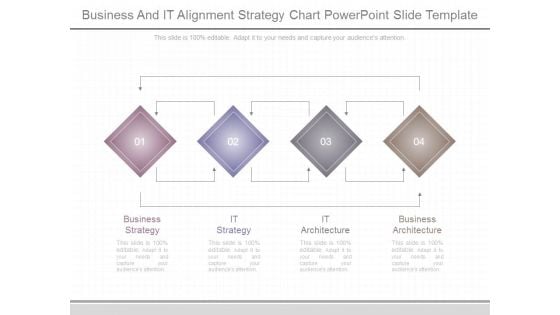
Business And It Alignment Strategy Chart Powerpoint Slide Template
This is a business and it alignment strategy chart powerpoint slide template. This is a four stage process. The stages in this process are business strategy, it strategy, it architecture, business architecture.
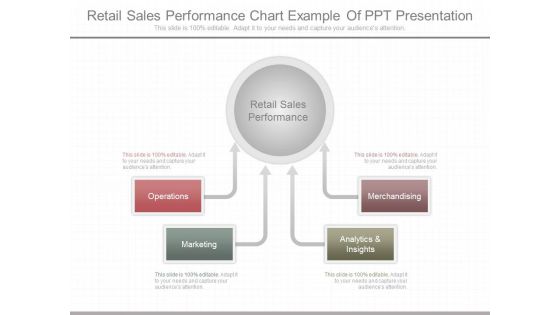
Retail Sales Performance Chart Example Of Ppt Presentation
This is a retail sales performance chart example of ppt presentation. This is a four stage process. The stages in this process are operations, marketing, analytics and insights, merchandising, retail sales performance.
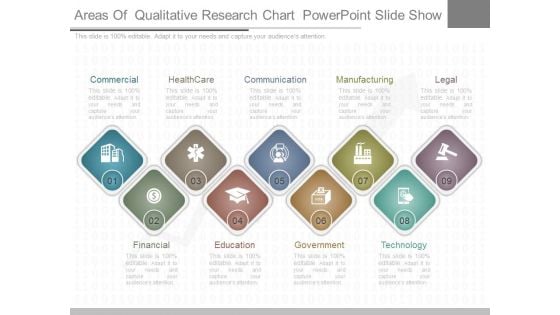
Areas Of Qualitative Research Chart Powerpoint Slide Show
This is a areas of qualitative research chart powerpoint slide show. This is a nine stage process. The stages in this process are commercial, healthcare, communication, manufacturing, legal, financial,, education, government, technology.
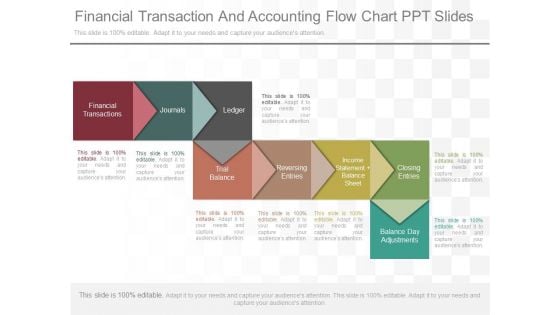
Financial Transaction And Accounting Flow Chart Ppt Slides
This is a financial transaction and accounting flow chart ppt slides. This is a eight stage process. The stages in this process are financial transactions, journals, ledger, trial balance, reversing entries, income statement balance sheet, closing entries, balance day adjustments.
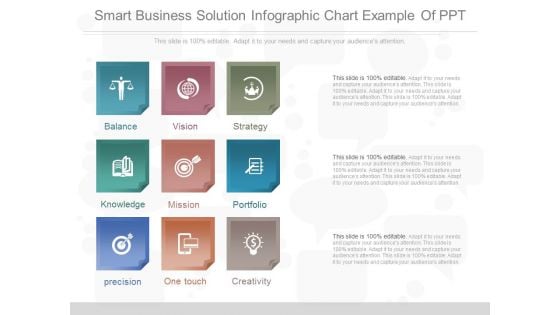
Smart Business Solution Infographic Chart Example Of Ppt
This is a smart business solution infographic chart example of ppt. This is a nine stage process. The stages in this process are balance, vision, strategy, knowledge, mission, portfolio, precision, one touch, creativity.


 Continue with Email

 Home
Home


