Control Chart
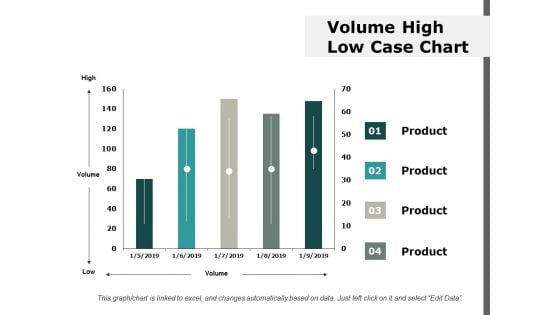
Volume High Low Case Chart Ppt Powerpoint Presentation Ideas Information
This is a volume high low case chart ppt powerpoint presentation ideas information. This is a four stage process. The stages in this process are finance, marketing, management, investment, analysis.
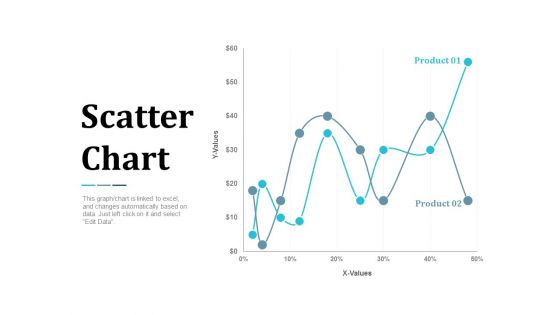
Scatter Chart Analysis Marketing Ppt Powerpoint Presentation Summary Infographic Template
This is a scatter chart analysis marketing ppt powerpoint presentation summary infographic template. This is a two stage process. The stages in this process are finance, marketing, management, investment, analysis.
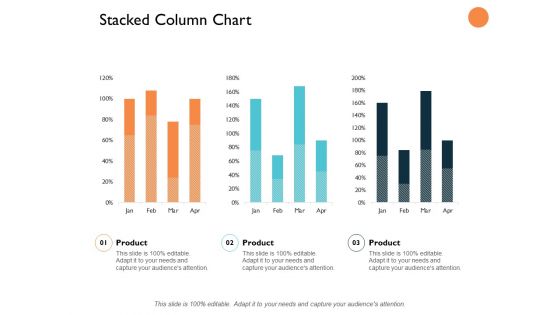
Stacked Column Chart Analysis Ppt PowerPoint Presentation Slides Graphics Design
This is a stacked column chart analysis ppt powerpoint presentation slides graphics design. This is a three stage process. The stages in this process are finance, marketing, management, investment, analysis.
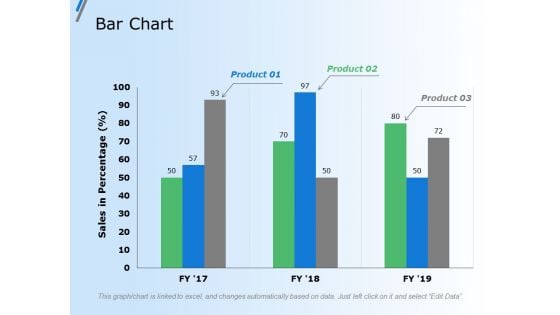
Bar Chart Finance Marketing Ppt Powerpoint Presentation Gallery Grid
This is a bar chart finance marketing ppt powerpoint presentation gallery grid. This is a three stage process. The stages in this process are finance, marketing, management, investment, analysis.
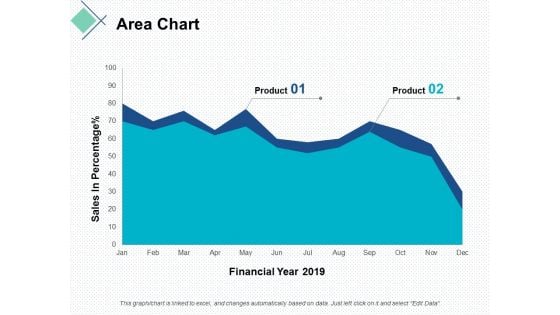
area chart finance ppt powerpoint presentation portfolio graphics download
This is a area chart finance ppt powerpoint presentation portfolio graphics download. This is a two stage process. The stages in this process are finance, marketing, management, investment, analysis.

Pie Chart Finance Ppt Powerpoint Presentation Layouts Design Ideas
This is a pie chart finance ppt powerpoint presentation layouts design ideas. This is a four stage process. The stages in this process are finance, marketing, management, investment, analysis.
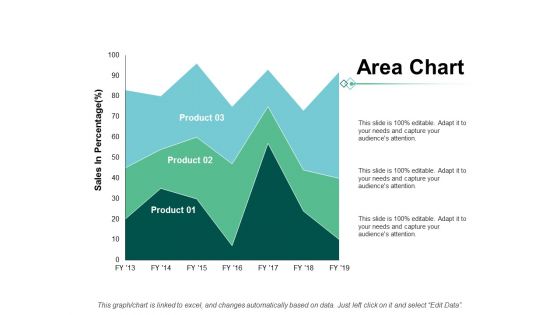
Area Chart Finance Marketing Ppt Powerpoint Presentation Show Grid
This is a area chart finance marketing ppt powerpoint presentation show grid. This is a three stage process. The stages in this process are finance, marketing, management, investment, analysis.
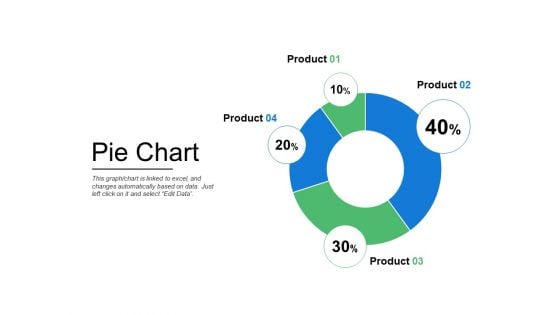
Pie Chart Finance Ppt PowerPoint Presentation Infographics Mockup
This is a pie chart finance ppt powerpoint presentation infographics mockup . This is a four stage process. The stages in this process are finance, marketing, management, investment, analysis.
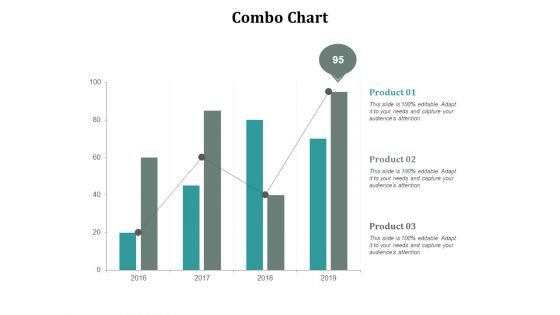
Combo Chart Marketing Ppt Powerpoint Presentation Ideas Format Ideas Cpb
This is a combo chart marketing ppt powerpoint presentation ideas format ideas cpb. This is a three stage process. The stages in this process are finance, marketing, management, investment, analysis.
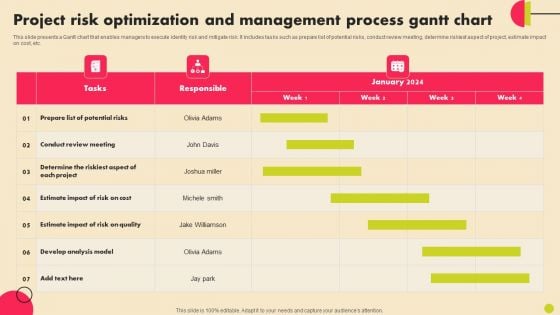
Project Risk Optimization And Management Process Gantt Chart Introduction PDF
This slide presents a Gantt chart that enables managers to execute identity risk and mitigate risk. It includes tasks such as prepare list of potential risks, conduct review meeting, determine riskiest aspect of project, estimate impact on cost, etc. Pitch your topic with ease and precision using this Project Risk Optimization And Management Process Gantt Chart Introduction PDF. This layout presents information on Determine, Develop Analysis Model, Potential Risks. It is also available for immediate download and adjustment. So, changes can be made in the color, design, graphics or any other component to create a unique layout.

Property And Casualties Insurance Business Profile Organisation Chart Sample PDF
The slide depicts the company hierarchical chart to define the various management positions in organization. It depicts chief executive officer, chief financial officer, executive vice president, sales and marketing director, legal advisor, actuary and IT consultant. It also shows board of directors, risk management committee and office of compliance. Deliver an awe inspiring pitch with this creative Property And Casualties Insurance Business Profile Organisation Chart Sample PDF bundle. Topics like Chief Executive Officer, Executive Of Directors, Board Of Directors can be discussed with this completely editable template. It is available for immediate download depending on the needs and requirements of the user.
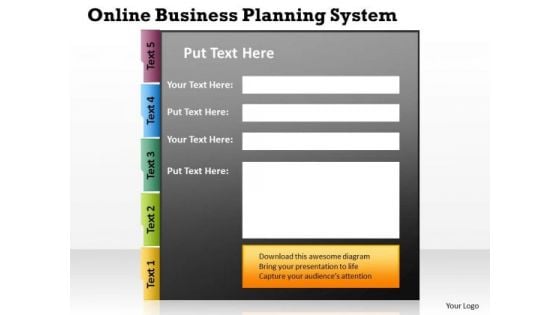
Online Business Planning System Cycle Process Chart PowerPoint Templates
We present our online business planning system Cycle Process Chart PowerPoint templates.Download and present our Technology PowerPoint Templates because you can Grab the attention of your team with this eye catching template signifying . Download and present our Business PowerPoint Templates because like the famed William Tell, they put aside all emotions and concentrate on the target. Download our Boxes PowerPoint Templates because like your thoughts arrows are inherently precise and true. Download and present our Symbol PowerPoint Templates because it enlightens your team and colleagues on the critical factors involved. Present our Process and Flows PowerPoint Templates because one pushes the other till it all comes back full circle.Use these PowerPoint slides for presentations relating to Abstract, Arrow, Backdrop, Background, Banner, Blank, Blue, Box, Bright, Brochure, Business, Chart, Circle, Color, Colorful, Concept, Cube, Description, Design, Diagram, Element, Empty, Flyer, Form, Frame, Graphic, Illustration, Item, Management, Marketing, Message, Modern, Network, Pink, Place, Presentation, Purple, Red, Shape, Sign, Site, Square, Style, Symbol, Template, Text. The prominent colors used in the PowerPoint template are Yellow, White, Black. We assure you our online business planning system Cycle Process Chart PowerPoint templates are designed by professionals Customers tell us our Bright PowerPoint templates and PPT Slides are Breathtaking. The feedback we get is that our online business planning system Cycle Process Chart PowerPoint templates are Liberated. We assure you our Box PowerPoint templates and PPT Slides look good visually. People tell us our online business planning system Cycle Process Chart PowerPoint templates are Chic. We assure you our Bright PowerPoint templates and PPT Slides are designed to make your presentations professional. Tickle their brains with our Online Business Planning System Cycle Process Chart PowerPoint Templates. They will find you an entertaining speaker.
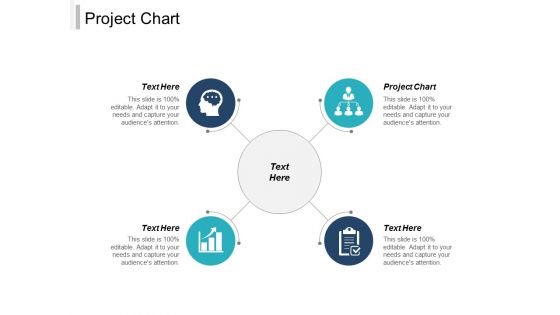
Project Chart Ppt PowerPoint Presentation Ideas Design Ideas Cpb
Presenting this set of slides with name project chart ppt powerpoint presentation ideas design ideas cpb. This is an editable Powerpoint four stages graphic that deals with topics like project chart to help convey your message better graphically. This product is a premium product available for immediate download and is 100 percent editable in Powerpoint. Download this now and use it in your presentations to impress your audience.
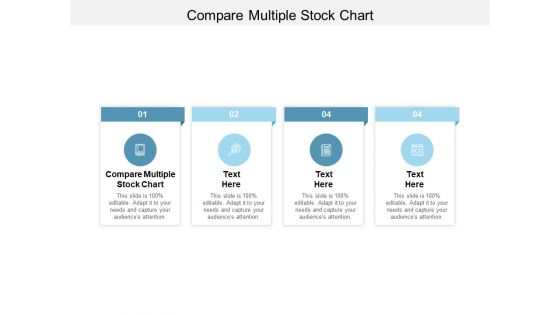
Compare Multiple Stock Chart Ppt PowerPoint Presentation Inspiration Layout Cpb
Presenting this set of slides with name compare multiple stock chart ppt powerpoint presentation inspiration layout cpb. This is an editable Powerpoint four stages graphic that deals with topics like compare multiple stock chart to help convey your message better graphically. This product is a premium product available for immediate download and is 100 percent editable in Powerpoint. Download this now and use it in your presentations to impress your audience.
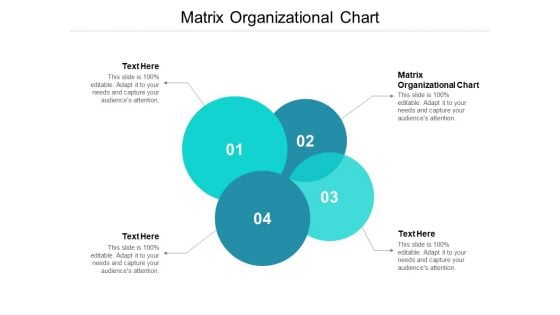
Matrix Organizational Chart Ppt PowerPoint Presentation Model Inspiration Cpb
Presenting this set of slides with name matrix organizational chart ppt powerpoint presentation model inspiration cpb. This is an editable Powerpoint four stages graphic that deals with topics like matrix organizational chart to help convey your message better graphically. This product is a premium product available for immediate download and is 100 percent editable in Powerpoint. Download this now and use it in your presentations to impress your audience.
Line Chart Business Data Ppt PowerPoint Presentation Styles Layout Cpb
Presenting this set of slides with name line chart business data ppt powerpoint presentation styles layout cpb. This is an editable Powerpoint three stages graphic that deals with topics like line chart business data to help convey your message better graphically. This product is a premium product available for immediate download and is 100 percent editable in Powerpoint. Download this now and use it in your presentations to impress your audience.
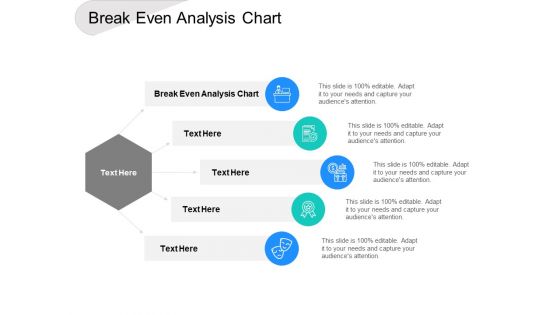
Break Even Analysis Chart Ppt PowerPoint Presentationmodel Brochure Cpb
Presenting this set of slides with name break even analysis chart ppt powerpoint presentationmodel brochure cpb. This is an editable Powerpoint five stages graphic that deals with topics like break even analysis chart to help convey your message better graphically. This product is a premium product available for immediate download and is 100 percent editable in Powerpoint. Download this now and use it in your presentations to impress your audience.
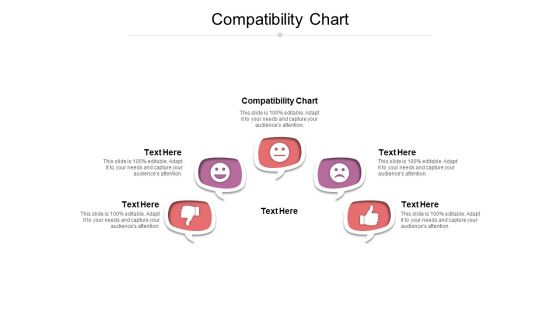
Compatibility Chart Ppt PowerPoint Presentation Summary Example File Cpb
Presenting this set of slides with name compatibility chart ppt powerpoint presentation summary example file cpb. This is an editable Powerpoint five stages graphic that deals with topics like compatibility chart to help convey your message better graphically. This product is a premium product available for immediate download and is 100 percent editable in Powerpoint. Download this now and use it in your presentations to impress your audience.
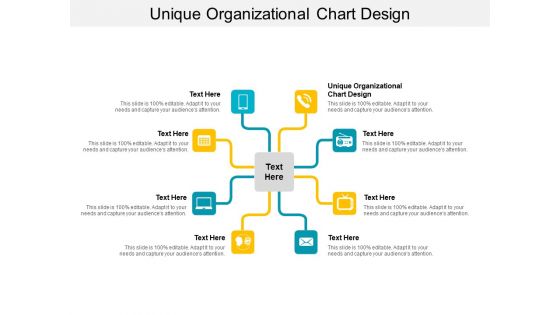
Unique Organizational Chart Design Ppt PowerPoint Presentation Background Cpb
Presenting this set of slides with name unique organizational chart design ppt powerpoint presentation background cpb. This is an editable Powerpoint eght stages graphic that deals with topics like unique organizational chart design to help convey your message better graphically. This product is a premium product available for immediate download and is 100 percent editable in Powerpoint. Download this now and use it in your presentations to impress your audience.
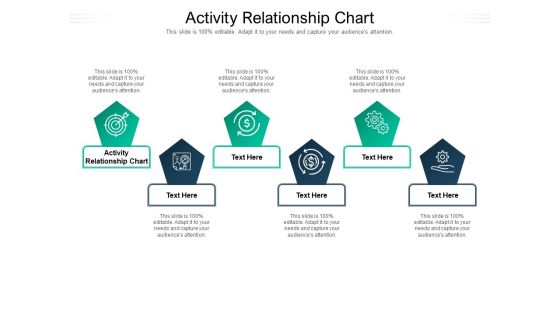
Activity Relationship Chart Ppt PowerPoint Presentation Professional Background Cpb Pdf
Presenting this set of slides with name activity relationship chart ppt powerpoint presentation professional background cpb pdf. This is an editable Powerpoint six stages graphic that deals with topics like activity relationship chart to help convey your message better graphically. This product is a premium product available for immediate download and is 100 percent editable in Powerpoint. Download this now and use it in your presentations to impress your audience.
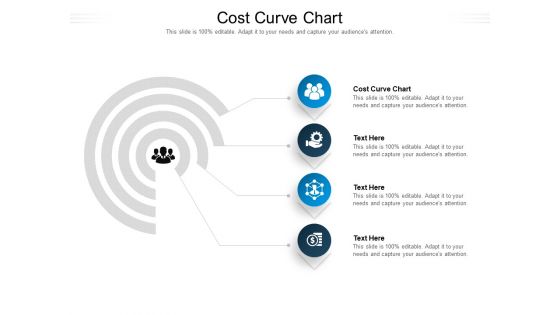
Cost Curve Chart Ppt PowerPoint Presentation Portfolio Pictures Cpb Pdf
Presenting this set of slides with name cost curve chart ppt powerpoint presentation portfolio pictures cpb pdf. This is an editable Powerpoint four stages graphic that deals with topics like cost curve chart to help convey your message better graphically. This product is a premium product available for immediate download and is 100 percent editable in Powerpoint. Download this now and use it in your presentations to impress your audience.
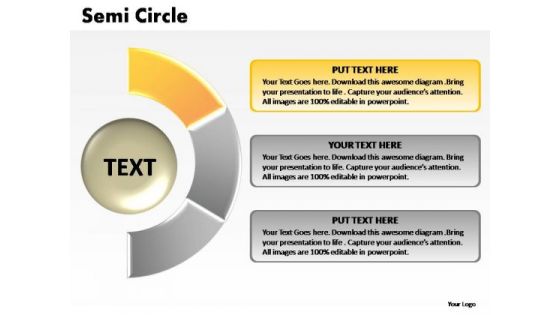
PowerPoint Presentation Education Semi Circle Chart Ppt Theme
PowerPoint Presentation Education Semi Circle Chart PPT Theme-The Circle of Life - a concept emmbedded in our minds and hence easy to comprehend. Life and Business is made up of processes comprising stages that flow from one to another. An excellent graphic to attract the attention of and understanding by your audience to improve earnings. Exhort your team with our PowerPoint Presentation Education Semi Circle Chart Ppt Theme. Urge them on to go one better.
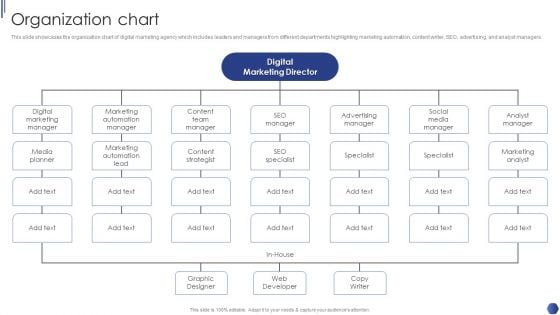
Digital Marketing Agency Business Profile Organization Chart Elements PDF
This slide showcases the organization chart of digital marketing agency which includes leaders and managers from different departments highlighting marketing automation, content writer, SEO, advertising, and analyst managers. Deliver and pitch your topic in the best possible manner with this Digital Marketing Agency Business Profile Organization Chart Elements PDF. Use them to share invaluable insights on Content Team Manager, Marketing Automation Manager, Digital Marketing Manager and impress your audience. This template can be altered and modified as per your expectations. So, grab it now.
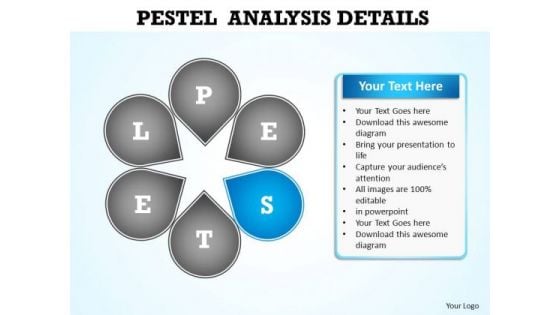
PowerPoint Slide Layout Chart Pestel Analysis Ppt Design
PowerPoint Slide layout Chart Pestel Analysis PPT Design-The Circle of Life - a concept embedded in our minds and hence easy to comprehend. Life and Business is made up of processes comprising stages that flow from one to another. An excellent graphic to attract the attention of and understanding by your audience to improve earnings. Be a conscious and capable citizen. Elaborate on your environmental concerns with our PowerPoint Slide Layout Chart Pestel Analysis Ppt Design.
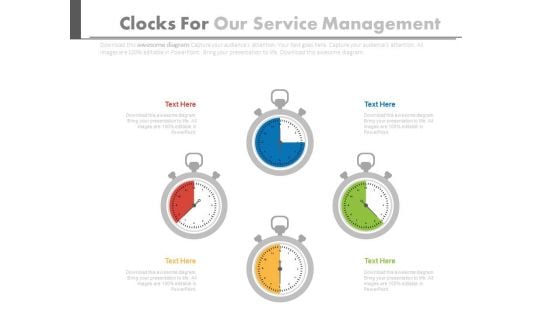
Four Stopwatches In Pie Chart Style Powerpoint Slides
This PPT slide has been designed with graphics of four stop watches in pie chart style. You may sue this PowerPoint template for time management. This dashboard slide may useful for multilevel status report creation and approval process.
Calorie Intake Chart In Powerpoint And Google Slides Cpb
Introducing our well designed Calorie Intake Chart In Powerpoint And Google Slides Cpb. This PowerPoint design presents information on topics like Calorie Intake Chart. As it is predesigned it helps boost your confidence level. It also makes you a better presenter because of its high quality content and graphics. This PPT layout can be downloaded and used in different formats like PDF, PNG, and JPG. Not only this, it is available in both Standard Screen and Widescreen aspect ratios for your convenience. Therefore, click on the download button now to persuade and impress your audience. Our Calorie Intake Chart In Powerpoint And Google Slides Cpb are topically designed to provide an attractive backdrop to any subject. Use them to look like a presentation pro.
Emotions Synonyms Chart In Powerpoint And Google Slides Cpb
Presenting our innovatively designed set of slides titled Emotions Synonyms Chart In Powerpoint And Google Slides Cpb. This completely editable PowerPoint graphic exhibits Emotions Synonyms Chart that will help you convey the message impactfully. It can be accessed with Google Slides and is available in both standard screen and widescreen aspect ratios. Apart from this, you can download this well structured PowerPoint template design in different formats like PDF, JPG, and PNG. So, click the download button now to gain full access to this PPT design. Our Emotions Synonyms Chart In Powerpoint And Google Slides Cpb are topically designed to provide an attractive backdrop to any subject. Use them to look like a presentation pro.
CPU Hierarchy Chart Toms In Powerpoint And Google Slides Cpb
Presenting our innovatively-designed set of slides titled CPU Hierarchy Chart Toms In Powerpoint And Google Slides Cpb. This completely editable PowerPoint graphic exhibits CPU Hierarchy Chart Toms that will help you convey the message impactfully. It can be accessed with Google Slides and is available in both standard screen and widescreen aspect ratios. Apart from this, you can download this well-structured PowerPoint template design in different formats like PDF, JPG, and PNG. So, click the download button now to gain full access to this PPT design. Our CPU Hierarchy Chart Toms In Powerpoint And Google Slides Cpb are topically designed to provide an attractive backdrop to any subject. Use them to look like a presentation pro.
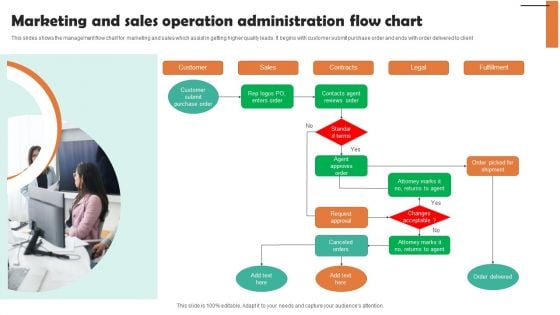
Marketing And Sales Operation Administration Flow Chart Ideas PDF
This slides shows the management flow chart for marketing and sales which assist in getting higher quality leads. It begins with customer submit purchase order and ends with order delivered to client. Presenting Marketing And Sales Operation Administration Flow Chart Ideas PDF to dispense important information. This template comprises one stages. It also presents valuable insights into the topics including Customer, Sales, Contracts. This is a completely customizable PowerPoint theme that can be put to use immediately. So, download it and address the topic impactfully.
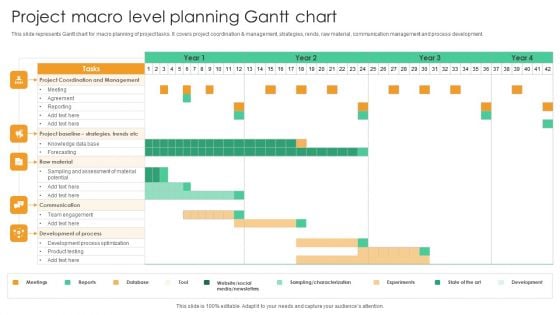
Project Macro Level Planning Gantt Chart Guidelines PDF
This slide represents Gantt chart for macro planning of project tasks. It covers project coordination and management, strategies, rends, raw material, communication management and process development. Pitch your topic with ease and precision using this Project Macro Level Planning Gantt Chart Guidelines PDF. This layout presents information on Project Coordination Management, Raw Material. It is also available for immediate download and adjustment. So, changes can be made in the color, design, graphics or any other component to create a unique layout.
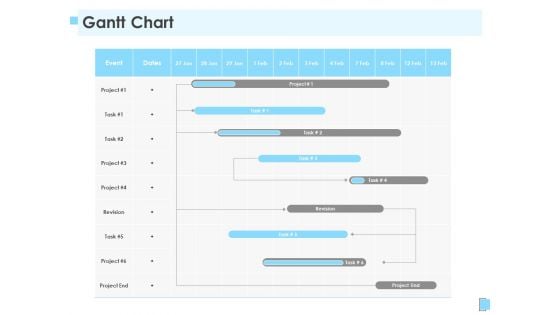
Strategic Management Gantt Chart Ppt Portfolio Outline PDF
Elucidate your project plan using our strategic management gantt chart ppt portfolio outline pdf. Capture the timeframe for every release by outlining crucial details like project beginning and end date, status, and assigned team. Establish coordination with other team members share your product plans, and discuss the project progress with the executives using this template. Furthermore, this task management chart helps you align your activities efficiently. Utilize the versatile nature of this template to initiate high-level resource planning and implement it flexibly for the benefit of your business. The slide is easy to edit so download it and schedule your projects resourcefully.

Price Catalogue Chart With Bulk Cost And Deviation Background PDF
This slide showcases list chart that can help consumer to compare the price per unit offered by organization in marketplace. It also showcases pricing for bulk purchase of product and deviation in prices Showcasing this set of slides titled price catalogue chart with bulk cost and deviation background pdf. The topics addressed in these templates are price catalogue chart with bulk cost and deviation. All the content presented in this PPT design is completely editable. Download it and make adjustments in color, background, font etc. as per your unique business setting.
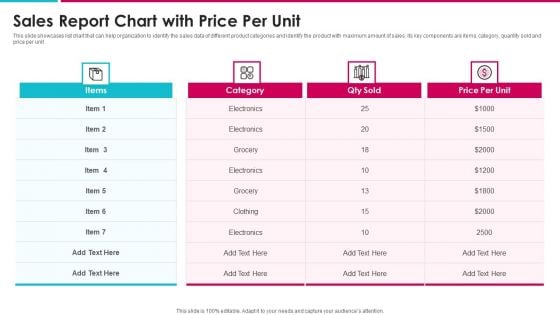
Sales Report Chart With Price Per Unit Information PDF
This slide showcases list chart that can help organization to identify the sales data of different product categories and identify the product with maximum amount of sales. Its key components are items, category, quantity sold and price per unit Showcasing this set of slides titled sales report chart with price per unit information pdf. The topics addressed in these templates are sales report chart with price per unit. All the content presented in this PPT design is completely editable. Download it and make adjustments in color, background, font etc. as per your unique business setting.
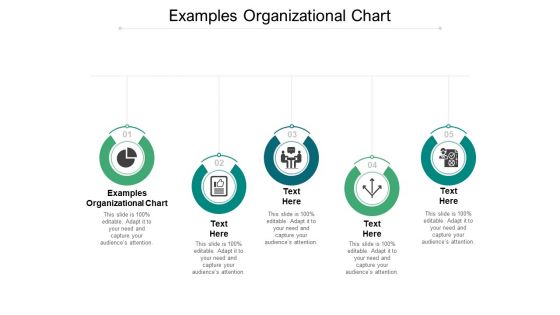
Examples Organizational Chart Ppt PowerPoint Presentation Infographic Template Themes Cpb
Presenting this set of slides with name examples organizational chart ppt powerpoint presentation infographic template themes cpb. This is an editable Powerpoint five stages graphic that deals with topics like examples organizational chart to help convey your message better graphically. This product is a premium product available for immediate download and is 100 percent editable in Powerpoint. Download this now and use it in your presentations to impress your audience.
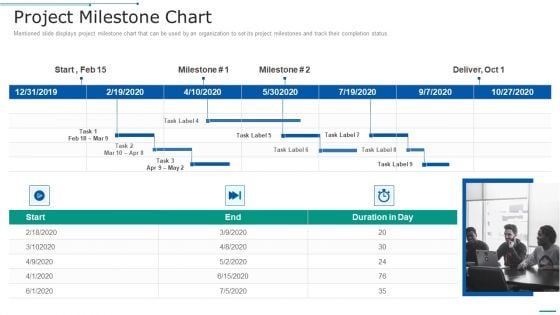
PMP Toolkit Project Milestone Chart Ppt Layouts Templates PDF
Mentioned slide displays project milestone chart that can be used by an organization to set its project milestones and track their completion status. This is a pmp toolkit project milestone chart ppt layouts templates pdf template with various stages. Focus and dispense information on one stages using this creative set, that comes with editable features. It contains large content boxes to add your information on topics like project milestone chart. You can also showcase facts, figures, and other relevant content using this PPT layout. Grab it now.
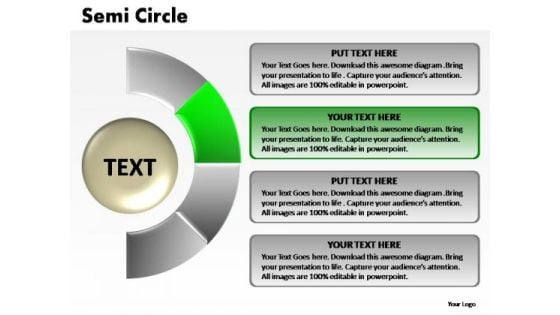
PowerPoint Presentation Strategy Semi Circle Chart Ppt Presentation
PowerPoint Presentation Strategy Semi Circle Chart PPT Presentation-The Circle of Life - a concept emmbedded in our minds and hence easy to comprehend. Life and Business is made up of processes comprising stages that flow from one to another. An excellent graphic to attract the attention of and understanding by your audience to improve earnings. Gain admission into entrepreneurship. Our PowerPoint Presentation Strategy Semi Circle Chart Ppt Presentation will enable your entry,
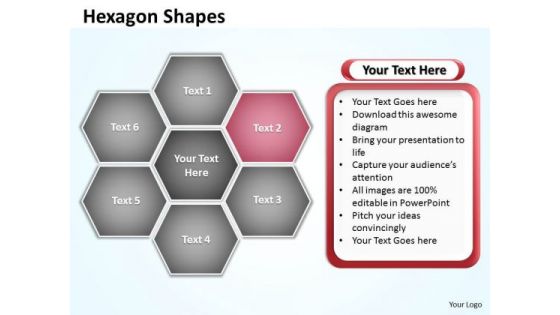
Ppt Hexagon Angles Shaped Chart Editable PowerPoint Templates 2007
PPT hexagon angles shaped chart editable powerpoint templates 2007-Use this Hexagon diagram to explain complex and difficult business strategic planning & staff development. This is an amazing tool to ensure that strategic planning sessions contribute to teambuilding, and are interesting too.-PPT hexagon angles shaped chart editable powerpoint templates 2007-Abstract, Background, Design, Digital, Elements, Graphic, Grey, Hexagon, Illustration, Light, Modern, Perspective, Triangles, Shapes, Shiny, Style, Technology, Template, Vector, Vertical, Virtual, Wallpaper, Web Our Ppt Hexagon Angles Shaped Chart Editable PowerPoint Templates 2007 impress people. With our money back guarantee you have nothing to lose.
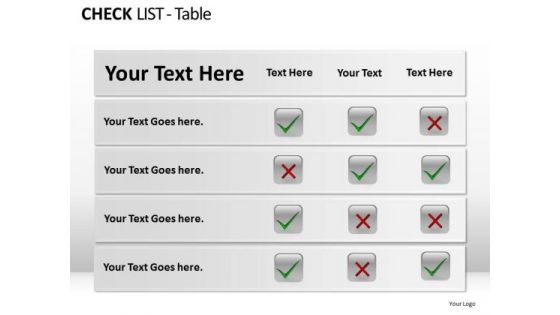
PowerPoint Presentation Designs Chart Check List Table Ppt Themes
PowerPoint Presentation Designs Chart Check List Table PPT Themes-These high quality powerpoint pre-designed slides and powerpoint templates have been carefully created by our professional team to help you impress your audience. All slides have been created and are 100% editable in powerpoint. Each and every property of any graphic - color, size, orientation, shading, outline etc. can be modified to help you build an effective powerpoint presentation. Any text can be entered at any point in the powerpoint template or slide. Simply DOWNLOAD, TYPE and PRESENT! Win genuine accolades with our PowerPoint Presentation Designs Chart Check List Table Ppt Themes. Dont waste time struggling with PowerPoint. Let us do it for you.
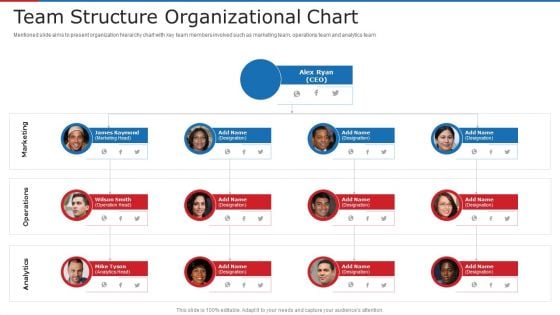
Team Structure Organizational Chart Ppt Infographics Example Introduction PDF
Mentioned slide aims to present organization hierarchy chart with key team members involved such as marketing team, operations team and analytics team. This is a team structure organizational chart ppt infographics example introduction pdf template with various stages. Focus and dispense information on four stages using this creative set, that comes with editable features. It contains large content boxes to add your information on topics like team structure organizational chart. You can also showcase facts, figures, and other relevant content using this PPT layout. Grab it now.

Our Market Research Plan Gantt Chart Powerpoint Slide Backgrounds
This is a our market research plan gantt chart powerpoint slide backgrounds. This is a nine stage process. The stages in this process are jan, feb, mar, apr, may.
Risk Tracker Chart Of The Production One Pager Documents
This one pager covers the risk tracker chart of the company that can be used to track the risk factors and how the company is planning to overcome the same. Presenting you an exemplary Risk Tracker Chart Of The Production One Pager Documents. Our one-pager comprises all the must-have essentials of an inclusive document. You can edit it with ease, as its layout is completely editable. With such freedom, you can tweak its design and other elements to your requirements. Download this Risk Tracker Chart Of The Production One Pager Documents brilliant piece now.
Risk Tracker Chart Of The Enterprise One Pager Documents
This one pager covers the risk tracker chart of the company that can be used to track the risk factors and how the company is planning to overcome the same. Presenting you an exemplary Risk Tracker Chart Of The Enterprise One Pager Documents. Our one-pager comprises all the must-have essentials of an inclusive document. You can edit it with ease, as its layout is completely editable. With such freedom, you can tweak its design and other elements to your requirements. Download this Risk Tracker Chart Of The Enterprise One Pager Documents brilliant piece now.
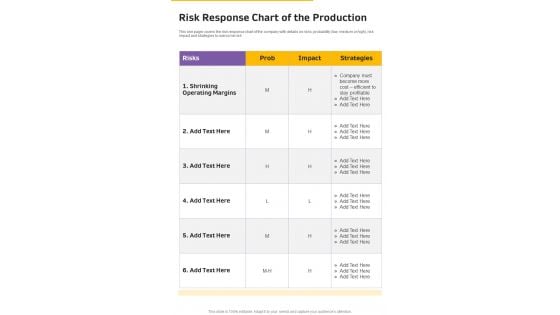
Risk Response Chart Of The Production One Pager Documents
This one pager covers the risk response chart of the company with details on risks, probability low, medium or high, risk impact and strategies to overcome risk. Presenting you a fantastic Risk Response Chart Of The Production One Pager Documents. This piece is crafted on hours of research and professional design efforts to ensure you have the best resource. It is completely editable and its design allow you to rehash its elements to suit your needs. Get this Risk Response Chart Of The Production One Pager Documents A4 One-pager now.

Risk Response Chart Of The Enterprise One Pager Documents
This one pager covers the risk response chart of the company with details on risks, probability low, medium or high, risk impact and strategies to overcome risk. Presenting you a fantastic Risk Response Chart Of The Enterprise One Pager Documents. This piece is crafted on hours of research and professional design efforts to ensure you have the best resource. It is completely editable and its design allow you to rehash its elements to suit your needs. Get this Risk Response Chart Of The Enterprise One Pager Documents A4 One-pager now.
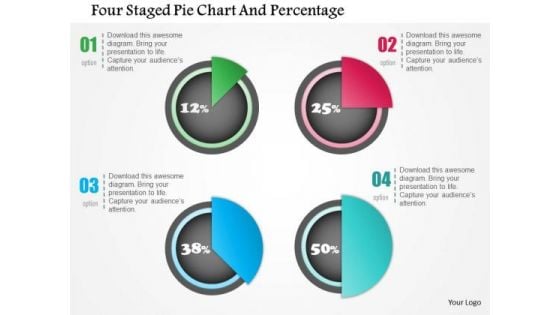
Business Diagram Four Staged Pie Chart And Percentage Presentation Template
Four staged pie chart and percentage values has been used to design this power point template. This PPT contains the concept of financial result analysis. Use this PPT for business and marketing related presentations.
Unsaturated Fat Foods Chart In Powerpoint And Google Slides Cpb
Introducing our well-designed Unsaturated Fat Foods Chart In Powerpoint And Google Slides Cpb. This PowerPoint design presents information on topics like Unsaturated Fat Foods Chart. As it is predesigned it helps boost your confidence level. It also makes you a better presenter because of its high-quality content and graphics. This PPT layout can be downloaded and used in different formats like PDF, PNG, and JPG. Not only this, it is available in both Standard Screen and Widescreen aspect ratios for your convenience. Therefore, click on the download button now to persuade and impress your audience. Our Unsaturated Fat Foods Chart In Powerpoint And Google Slides Cpb are topically designed to provide an attractive backdrop to any subject. Use them to look like a presentation pro.
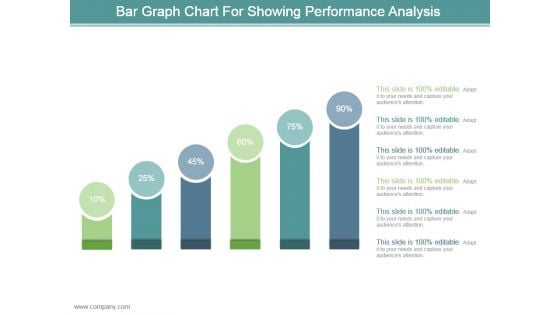
Bar Graph Chart For Showing Performance Analysis Ppt Design
This is a bar graph chart for showing performance analysis ppt design. This is a six stage process. The stages in this process are business, marketing, process, success, presentation.

PowerPoint Design Slides Chart Rectangular Jigsaw Puzzle Ppt Designs
PowerPoint Design Slides Chart Rectangular Jigsaw Puzzle PPT Designs- It is all there in bits and pieces. Individual components well researched and understood in their place. Now you need to get it all together to form the complete picture and reach the goal. You have the ideas and plans on how to go about it. Use this template to illustrate your method, piece by piece, and interlock the whole process in the minds of your audience.-PowerPoint Design Slides Chart Rectangular Jigsaw Puzzle PPT Designs Electrify your audience with our PowerPoint Design Slides Chart Rectangular Jigsaw Puzzle Ppt Designs. Just download, type and present.
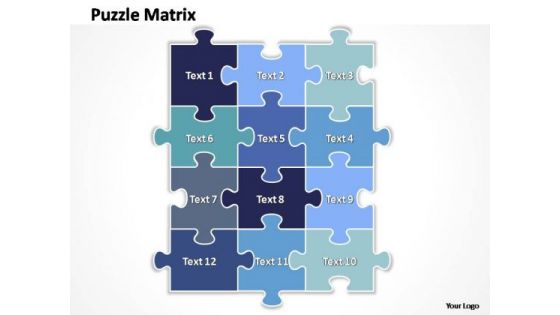
PowerPoint Slide Layout Chart Rectangular Jigsaw Puzzle Ppt Template
PowerPoint Slide layout Chart Rectangular Jigsaw Puzzle PPT Template- It is all there in bits and pieces. Individual components well researched and understood in their place. Now you need to get it all together to form the complete picture and reach the goal. You have the ideas and plans on how to go about it. Use this template to illustrate your method, piece by piece, and interlock the whole process in the minds of your audience.-PowerPoint Slide layout Chart Rectangular Jigsaw Puzzle PPT Template Address eco-clubs with our PowerPoint Slide Layout Chart Rectangular Jigsaw Puzzle Ppt Template. Advocate curbing of carbon emissions.
Four Steps Chart With Growth Icons Powerpoint Template
Growth planning for business can be defined with this business diagram. This slide depicts diagram of four steps chart with growth icons Present your views using this innovative slide and be assured of leaving a lasting impression
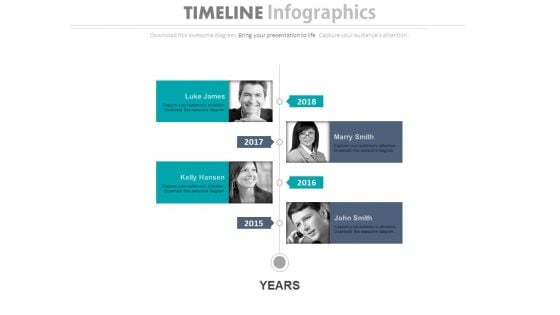
Four Employees Timeline Chart With Years Powerpoint Slides
This PowerPoint template has been designed with graphics of timeline with team pictures. You may download this timeline diagram slide to display team planning and management steps. Chart the course you intend to take with this slide.
Communication Chart In Powerpoint And Google Slides Cpb
Introducing our well designed Communication Chart In Powerpoint And Google Slides Cpb. This PowerPoint design presents information on topics like Communication Chart. As it is predesigned it helps boost your confidence level. It also makes you a better presenter because of its high quality content and graphics. This PPT layout can be downloaded and used in different formats like PDF, PNG, and JPG. Not only this, it is available in both Standard Screen and Widescreen aspect ratios for your convenience. Therefore, click on the download button now to persuade and impress your audience. Our Communication Chart In Powerpoint And Google Slides Cpb are topically designed to provide an attractive backdrop to any subject. Use them to look like a presentation pro.
Motherboard Compatibility Chart In Powerpoint And Google Slides Cpb
Introducing our well-designed Motherboard Compatibility Chart In Powerpoint And Google Slides Cpb. This PowerPoint design presents information on topics like Motherboard Compatibility Chart. As it is predesigned it helps boost your confidence level. It also makes you a better presenter because of its high-quality content and graphics. This PPT layout can be downloaded and used in different formats like PDF, PNG, and JPG. Not only this, it is available in both Standard Screen and Widescreen aspect ratios for your convenience. Therefore, click on the download button now to persuade and impress your audience. Our Motherboard Compatibility Chart In Powerpoint And Google Slides Cpb are topically designed to provide an attractive backdrop to any subject. Use them to look like a presentation pro.
Performance Internet Chart In Powerpoint And Google Slides Cpb
Introducing our well designed Performance Internet Chart In Powerpoint And Google Slides Cpb. This PowerPoint design presents information on topics like Performance Internet Chart. As it is predesigned it helps boost your confidence level. It also makes you a better presenter because of its high quality content and graphics. This PPT layout can be downloaded and used in different formats like PDF, PNG, and JPG. Not only this, it is available in both Standard Screen and Widescreen aspect ratios for your convenience. Therefore, click on the download button now to persuade and impress your audience. Our Performance Internet Chart In Powerpoint And Google Slides Cpb are topically designed to provide an attractive backdrop to any subject. Use them to look like a presentation pro.
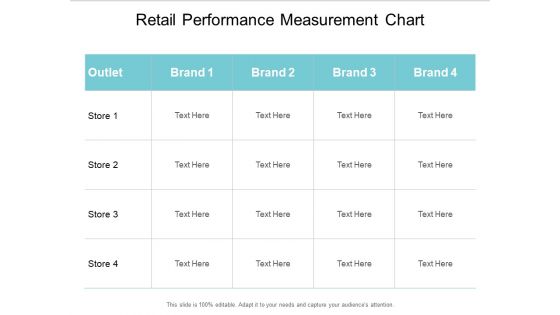
Retail Performance Measurement Chart Ppt PowerPoint Presentation Ideas Structure
This is a retail performance measurement chart ppt powerpoint presentation ideas structure. This is a four stage process. The stages in this process are product distribution, distribution system, numeric distribution.
Six Steps Circular Chart With Icons Powerpoint Slides
This PowerPoint template has been designed with six steps circular chart with icons. This PPT slide may be used to display business and management functions. Download this slide to build unique presentation.
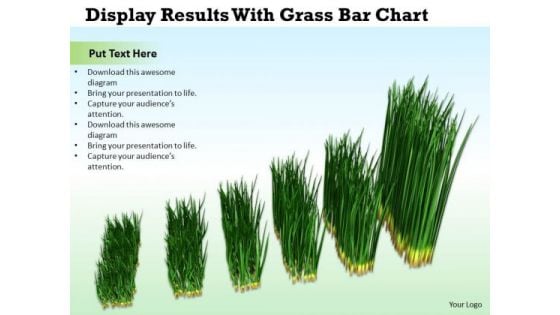
Business And Strategy Display Results With Grass Bar Chart Images
Analyze Ailments On Our business and strategy display results with grass bar chart images Powerpoint Templates. Bring Out The Thinking Doctor In You. Dock Your Thoughts With Our Agriculture Powerpoint Templates. They Will Launch Them Into Orbit.
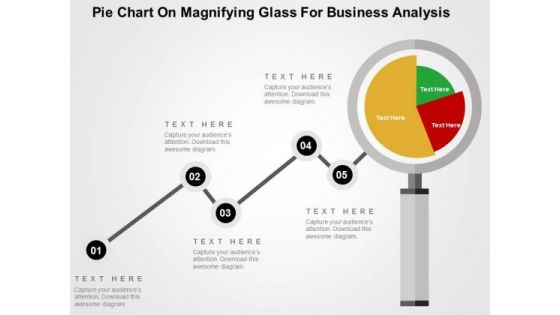
Pie Chart On Magnifying Glass For Business Analysis PowerPoint Template
Visually support your presentation with our above template showing pie chart on magnifying glass. This slide has been professionally designed to emphasize the concept of market research and analysis. Deliver amazing presentations to mesmerize your audience.
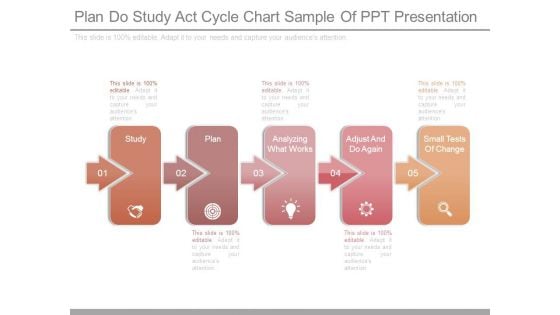
Plan Do Study Act Cycle Chart Sample Of Ppt Presentation
This is a plan do study act cycle chart sample of ppt presentation. This is a five stage process. The stages in this process are study, plan, analyzing what works, adjust and do again, small tests of change.
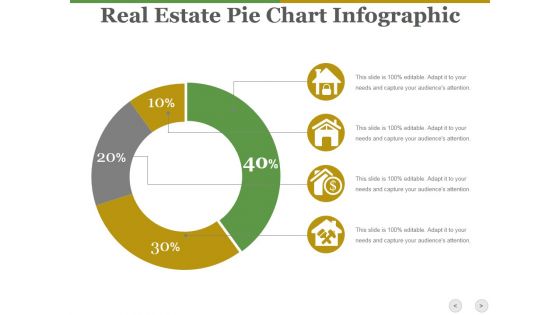
Real Estate Pie Chart Infographic Ppt PowerPoint Presentation Show Diagrams
This is a real estate pie chart infographic ppt powerpoint presentation show diagrams. This is a four stage process. The stages in this process are business, icons, marketing, strategy, process.


 Continue with Email

 Home
Home


