Control Chart

Business Chart Success PowerPoint Themes And PowerPoint Slides 0211
Microsoft PowerPoint Theme and Slides with growing gold graph with a red arrow pointing upward Bid farewell to ifs and buts. With our Business Chart Success PowerPoint Themes And PowerPoint Slides 0211 you will be assured and decisive.
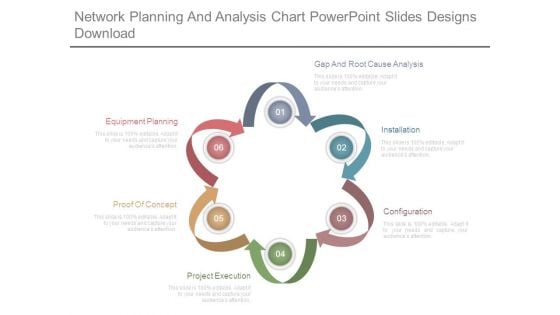
Network Planning And Analysis Chart Powerpoint Slides Designs Download
This is a network planning and analysis chart powerpoint slides designs download. This is a six stage process. The stages in this process are equipment planning, proof of concept, project execution, configuration, installation, gap and root cause analysis.
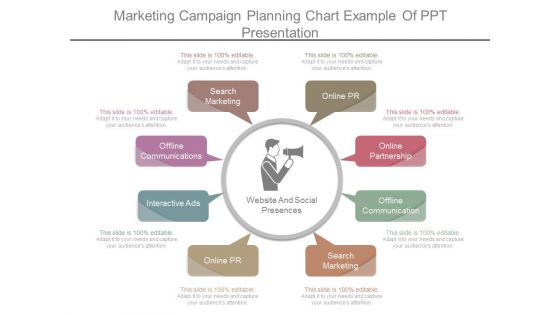
Marketing Campaign Planning Chart Example Of Ppt Presentation
This is a marketing campaign planning chart example of ppt presentation. This is a eight stage process. The stages in this process are search marketing, offline communications, interactive ads, online pr, online partnership, offline communication, search marketing.
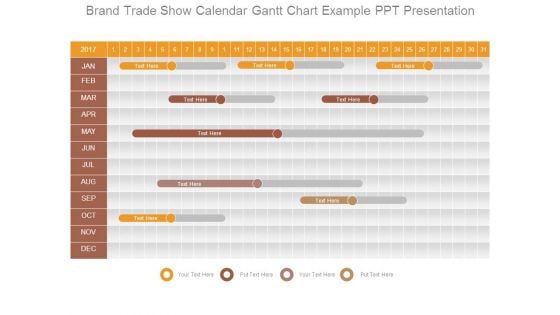
Brand Trade Show Calendar Gantt Chart Example Ppt Presentation
This is a brand trade show calendar gantt chart example ppt presentation. This is a one stage process. The stages in this process are jan, feb, mar, apr, may, jun, jul, aug, sep, oct, nov, dec.
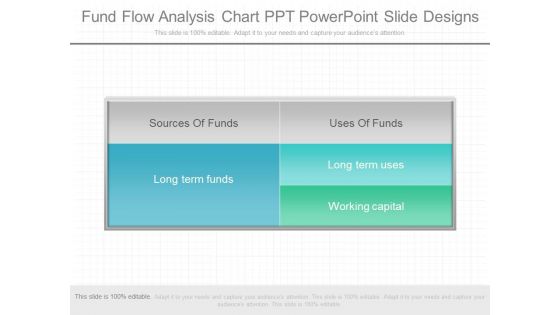
Fund Flow Analysis Chart Ppt Powerpoint Slide Designs
This is a fund flow analysis chart ppt powerpoint slide designs. This is a five stage process. The stages in this process are sources of funds, long term funds, uses of funds, long term uses, working capital.
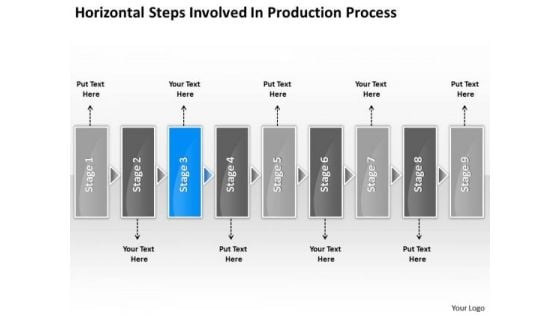
Steps Involved Production Processs Chart Electrical Design PowerPoint Slides
We present our steps involved production processs chart electrical design PowerPoint Slides.Download and present our Advertising PowerPoint Templates because you require care and diligence to function well. Download and present our Business PowerPoint Templates because you can see clearly through to the bigger bowl ahead. Time your jump to perfection and hit the nail on the head. Download and present our Shapes PowerPoint Templates because you have the people in place, selected the team leaders and all are raring to go. Download our Process and Flow PowerPoint Templates because there is a very good saying that prevention is better than cure, either way you have a store of knowledge for sure. Present our Arrows PowerPoint Templates because excite your audience with the brilliance of your thoughts.Use these PowerPoint slides for presentations relating to Abstract, Action, Attach, Box, Business, Center, Chain, Chart, Color, Communication, Concept, Connection, Cube, Cycle, Data, Diagram, Flow, Globe, Horizontal, Idea, Illustration, Information, Interaction, Jigsaw, Join, Link, Pieces, Process, Puzzle, Relation, Relationship, Shape, Success. The prominent colors used in the PowerPoint template are Blue, Gray, White. PowerPoint presentation experts tell us our steps involved production processs chart electrical design PowerPoint Slides will help you be quick off the draw. Just enter your specific text and see your points hit home. Customers tell us our Chart PowerPoint templates and PPT Slides are Flirty. Use our steps involved production processs chart electrical design PowerPoint Slides are Elevated. Use our Box PowerPoint templates and PPT Slides are Graceful. We assure you our steps involved production processs chart electrical design PowerPoint Slides are Majestic. People tell us our Chart PowerPoint templates and PPT Slides are Versatile. Beat criticism with our Steps Involved Production Processs Chart Electrical Design PowerPoint Slides. You will come out on top.
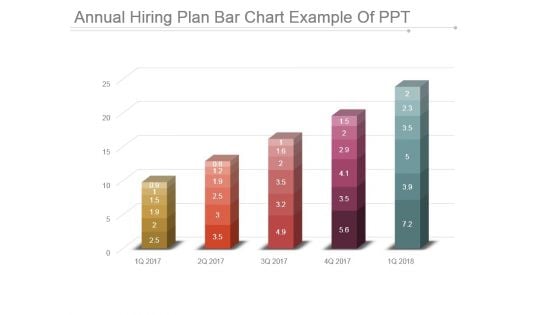
Annual Hiring Plan Bar Chart Example Of Ppt
This is a annual hiring plan bar chart example of ppt. This is a five stage process. The stages in this process are bar graph, business, marketing, growth, success.
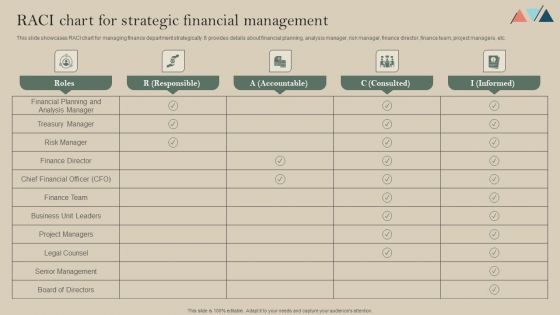
RACI Chart For Strategic Financial Management Diagrams PDF
This slide showcases RACI chart for managing finance department strategically. It provides details about financial planning, analysis manager, risk manager, finance director, finance team, project managers, etc. Here you can discover an assortment of the finest PowerPoint and Google Slides templates. With these templates, you can create presentations for a variety of purposes while simultaneously providing your audience with an eye-catching visual experience. Download RACI Chart For Strategic Financial Management Diagrams PDF to deliver an impeccable presentation. These templates will make your job of preparing presentations much quicker, yet still, maintain a high level of quality. Slidegeeks has experienced researchers who prepare these templates and write high-quality content for you. Later on, you can personalize the content by editing the RACI Chart For Strategic Financial Management Diagrams PDF.
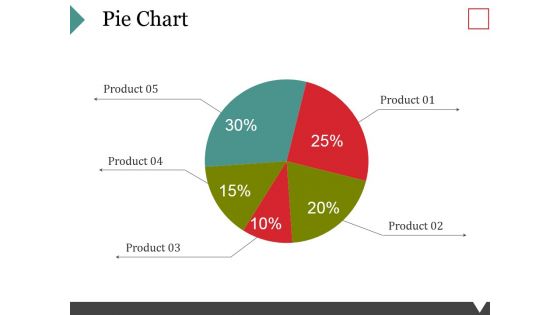
Pie Chart Ppt PowerPoint Presentation Summary Background Image
This is a pie chart ppt powerpoint presentation summary background image. This is a five stage process. The stages in this process are business, marketing, product, finance, strategy, planning.
Five Circles Sequential Chart With Icons Powerpoint Slides
This PowerPoint template contains sequential chart of five circles with icons. You may download this PPT slide to depict corporate vision, mission and strategy analysis. Add this slide to your presentation and impress your superiors.

Enterprise Value Timing Factors Chart Ppt Examples Professional
This is a enterprise value timing factors chart ppt examples professional. This is a four stage process. The stages in this process are industry dynamics, company performance, organic growth, strategic acquisitions.
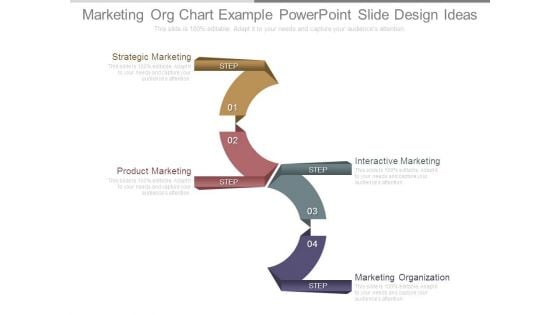
Marketing Org Chart Example Powerpoint Slide Design Ideas
This is a marketing org chart example powerpoint slide design ideas. This is a four stage process. The stages in this process are strategic marketing, product marketing, interactive marketing, marketing organization.
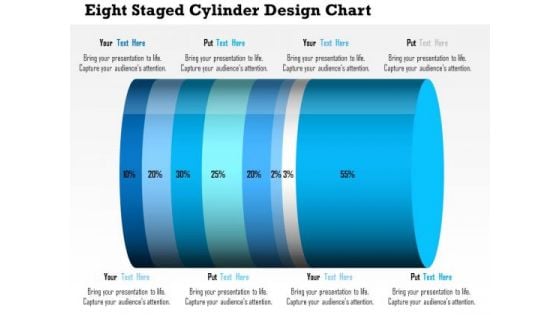
Business Daigram Eight Staged Cylinder Design Chart Presentation Templets
This business diagram contains eight staged cylinder design chart with percentage ratio. Download this diagram to display financial analysis. Use this diagram to make business and marketing related presentations.

Bar Chart Business PowerPoint Templates And PowerPoint Backgrounds 0411
Microsoft PowerPoint Template and Background with arrow pointing up in bar chat If you have doubts about the effort required? Be assured our Bar Chart Business PowerPoint Templates And PowerPoint Backgrounds 0411 will make it fairly easy.
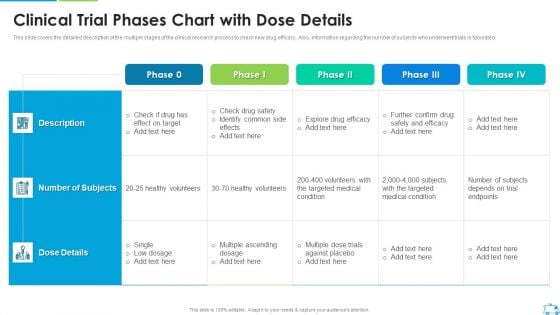
Clinical Trial Phases Chart With Dose Details Graphics PDF
This slide covers the detailed description of the multiple stages of the clinical research process to check new drug efficacy. Also, information regarding the number of subjects who underwent trials is tabulated.Deliver an awe inspiring pitch with this creative Clinical Trial Phases Chart With Dose Details Graphics PDF bundle. Topics like Clinical Trial Phases Chart With Dose Details can be discussed with this completely editable template. It is available for immediate download depending on the needs and requirements of the user.
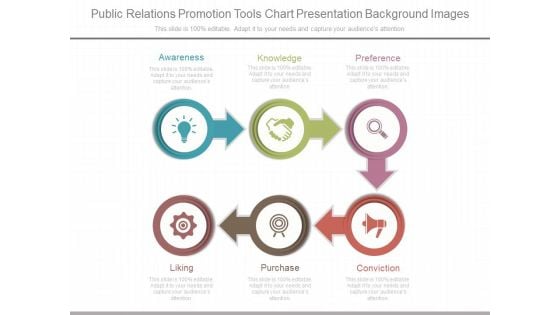
Public Relations Promotion Tools Chart Presentation Background Images
This is a public relations promotion tools chart presentation background images. This is a six stage process. The stages in this process are awareness, knowledge, preference, conviction, purchase, liking.
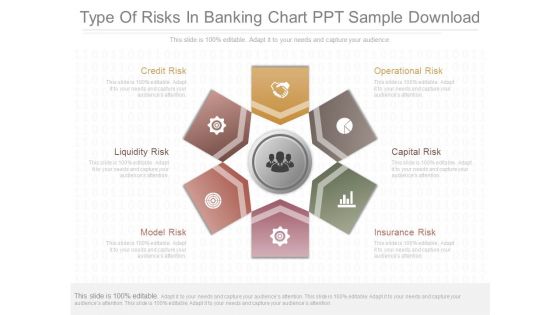
Type Of Risks In Banking Chart Ppt Sample Download
This is a type of risks in banking chart ppt sample download. This is a six stage process. The stages in this process are credit risk, liquidity risk, model risk, operational risk, capital risk, insurance risk.
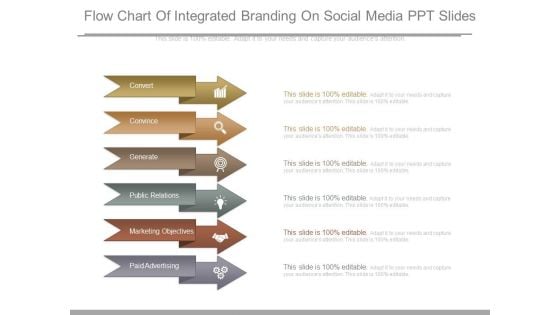
Flow Chart Of Integrated Branding On Social Media Ppt Slides
This is a flow chart of integrated branding on social media ppt slides. This is a six stage process. The stages in this process are convert, convince, generate, public relations, marketing objectives, paid advertising.
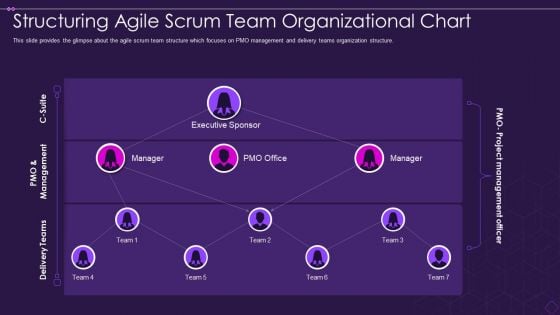
Structuring Agile Scrum Team Organizational Chart Ideas PDF
This slide provides the glimpse about the agile scrum team structure which focuses on PMO management and delivery teams organization structure. Deliver an awe inspiring pitch with this creative structuring agile scrum team organizational chart ideas pdf bundle. Topics like structuring agile scrum team organizational chart can be discussed with this completely editable template. It is available for immediate download depending on the needs and requirements of the user.
Hexagonal Chart With Finance And Communication Icons Powerpoint Template
Our above slide contains hexagonal chart with finance and communication icons. This PowerPoint template helps to display communication steps. Use this diagram to impart more clarity to data and to create more sound impact on viewers.
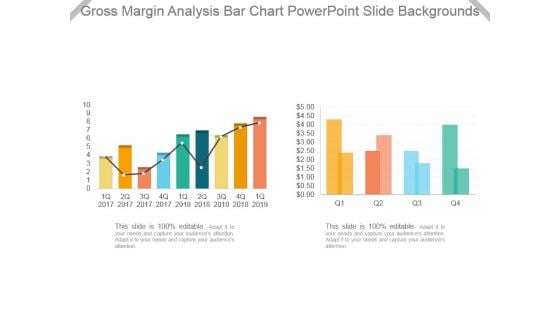
Gross Margin Analysis Bar Chart Powerpoint Slide Backgrounds
This is a gross margin analysis bar chart powerpoint slide backgrounds. This is a two stage process. The stages in this process are bar graph, business, marketing, growth, success.
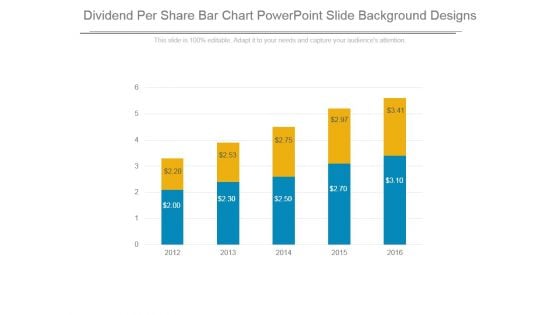
Dividend Per Share Bar Chart Powerpoint Slide Background Designs
This is a dividend per share bar chart powerpoint slide background designs. This is a five stage process. The stages in this process are business, marketing, success, growth, bar graph.
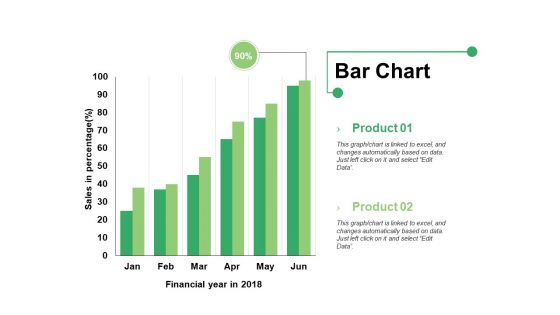
Bar Chart Ppt PowerPoint Presentation Infographics Format Ideas
This is a bar chart ppt powerpoint presentation infographics format ideas. This is a two stage process. The stages in this process are bar graph, product, financial year, sales in percentage.
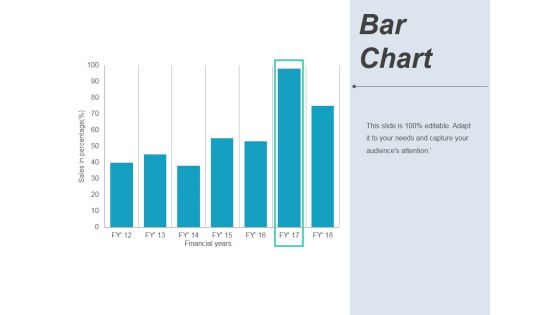
Bar Chart Ppt PowerPoint Presentation Pictures Background Image
This is a bar chart ppt powerpoint presentation pictures background image. This is a seven stage process. The stages in this process are financial years, sales in percentage, graph, business.
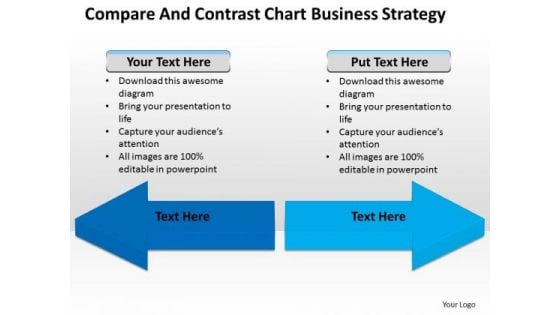
Consulting PowerPoint Template Compare And Contrast Chart Business Strategy Slides
When in doubt use our consulting PowerPoint template compare and contrast chart business strategy Slides. The way ahead will become crystal clear. With our Leadership PowerPoint Templates you will be doubly sure. They possess that stamp of authority. Our Finance PowerPoint Templates do it in double quick time. Speed up the process in a tangible way. Dream big wins with our Consulting PowerPoint Template Compare And Contrast Chart Business Strategy Slides. You will come out on top.
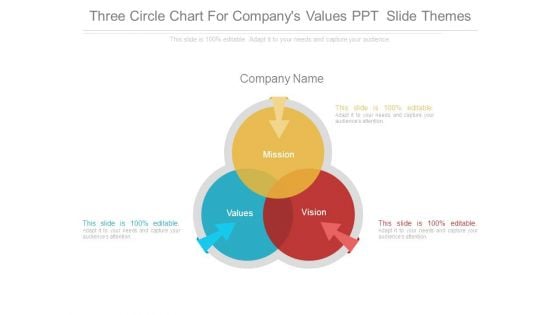
Three Circle Chart For Companys Values Ppt Slide Themes
This is a three circle chart for companys values ppt slide themes. This is a three stage process. The stages in this process are mission, company name, values, vision.
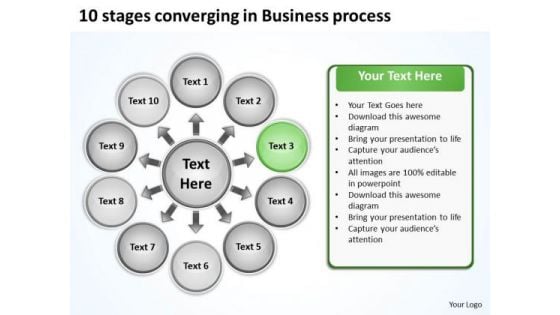
In Business PowerPoint Presentations Process Circular Chart Slides
We present our in business powerpoint presentations process Circular Chart Slides.Present our Arrows PowerPoint Templates because it demonstrates to your audience how the best and most refined ideas pass through. Download and present our Business PowerPoint Templates because it helps you to explain your plans in all earnest to your colleagues and raise the bar for all. Present our Signs PowerPoint Templates because support groups are an essential element of the on going struggle against cancer. Download and present our Shapes PowerPoint Templates because this slide represents the tools of the trade. Use our Spheres PowerPoint Templates because honesty is the best policy has an ardent follower in you.Use these PowerPoint slides for presentations relating to Arrows, Business, Chart, Circular, Commerce, Concept, Contribution, Cycle, Development, Diagram, Global, Idea, Informative, Internet, Join, Making, Manage, Management, Market, Marketing, Partner, Paying, Performance, Plans, Process, Productive, Productivity, Profit, Profitable, Project. The prominent colors used in the PowerPoint template are Green, Black, Gray. Professionals tell us our in business powerpoint presentations process Circular Chart Slides are Zippy. You can be sure our Chart PowerPoint templates and PPT Slides are Attractive. Customers tell us our in business powerpoint presentations process Circular Chart Slides will help you be quick off the draw. Just enter your specific text and see your points hit home. Professionals tell us our Circular PowerPoint templates and PPT Slides are Classic. People tell us our in business powerpoint presentations process Circular Chart Slides will generate and maintain the level of interest you desire. They will create the impression you want to imprint on your audience. People tell us our Cycle PowerPoint templates and PPT Slides are Nostalgic. Exhibit your talent with our In Business PowerPoint Presentations Process Circular Chart Slides. Let the audience see your dexterity.
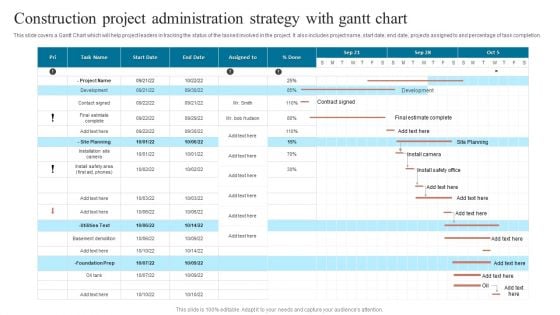
Construction Project Administration Strategy With Gantt Chart Topics PDF
This slide covers a Gantt Chart which will help project leaders in tracking the status of the tasked involved in the project. It also includes project name, start date, end date, projects assigned to and percentage of task completion.Pitch your topic with ease and precision using this Construction Project Administration Strategy With Gantt Chart Topics PDF. This layout presents information on Estimate Complete, Basement Demolition, Contract Signed. It is also available for immediate download and adjustment. So, changes can be made in the color, design, graphics or any other component to create a unique layout.
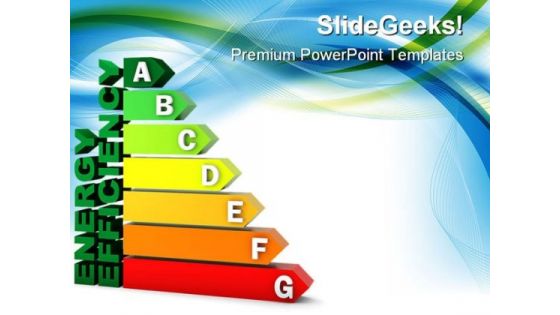
Energy Efficiency Chart Geographical PowerPoint Themes And PowerPoint Slides 0311
Microsoft PowerPoint Theme and Slide with energy efficiency rating certification system Fashion yourfate with our Energy Efficiency Chart Geographical PowerPoint Themes And PowerPoint Slides 0311. Your efforts will achieve their every aim.
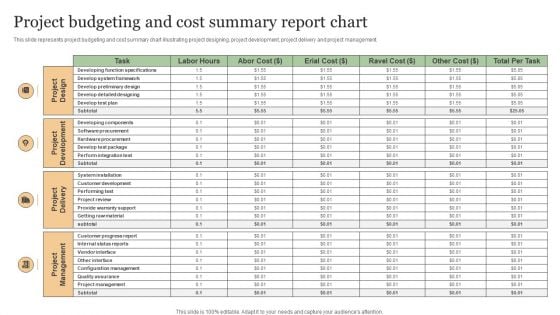
Project Budgeting And Cost Summary Report Chart Demonstration PDF
This slide represents project budgeting and cost summary chart illustrating project designing, project development, project delivery and project management. Pitch your topic with ease and precision using this Project Budgeting And Cost Summary Report Chart Demonstration PDF. This layout presents information on Project Management, Project Delivery, Project Development. It is also available for immediate download and adjustment. So, changes can be made in the color, design, graphics or any other component to create a unique layout.
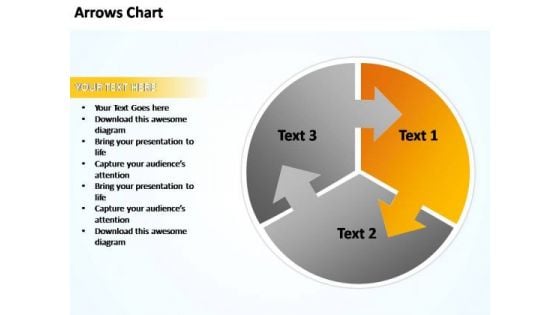
PowerPoint Templates Business Circular Plan With Arrows Chart Ppt Theme
PowerPoint Templates Business Circular Plan With Arrows Chart PPT Theme-Explore the various directions and layers existing in your in your plans and processes. Unravel the desired and essential elements of your overall strategy. Explain the relevance of the different layers and stages and directions in getting down to your core competence, ability and desired result. Cheer to success with our PowerPoint Templates Business Circular Plan With Arrows Chart Ppt Theme. You will come out on top.
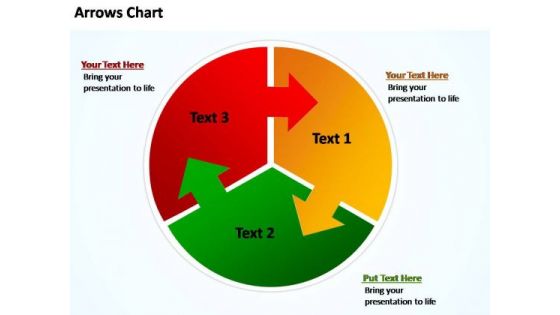
PowerPoint Templates Business Circular Plan With Arrows Chart Ppt Themes
PowerPoint Templates Business Circular Plan With Arrows Chart PPT Themes-Explore the various directions and layers existing in your in your plans and processes. Unravel the desired and essential elements of your overall strategy. Explain the relevance of the different layers and stages and directions in getting down to your core competence, ability and desired result. Our PowerPoint Templates Business Circular Plan With Arrows Chart Ppt Themes are colorful compositions. Their array of colors will catch the eye.
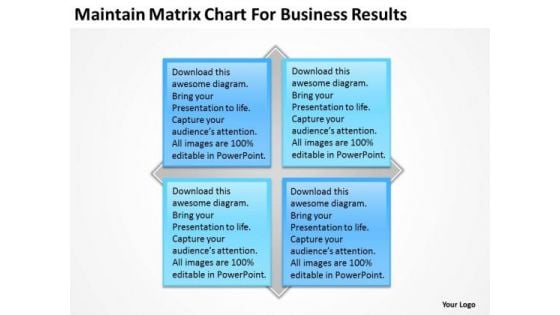
Maintain Matrix Chart For Business Results Plan Sample PowerPoint Slides
Blend your views with our maintain matrix chart for business results plan sample PowerPoint Slides. They are made for each other. Our Boxes Powerpoint templates are duly appointed. They have all the facets you require. There is no subject too dull for our Process and Flows Powerpoint templates. They will always generate keenness. Create failsafe designs with our Maintain Matrix Chart For Business Results Plan Sample PowerPoint Slides. Examine likely defects in detail.
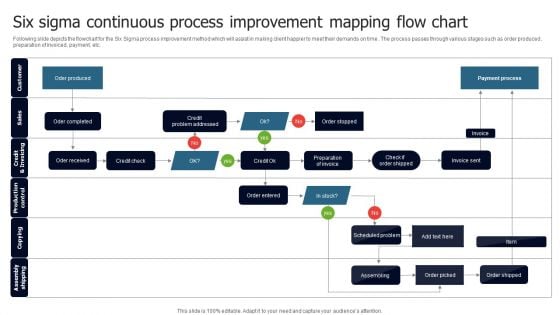
Six Sigma Continuous Process Improvement Mapping Flow Chart Introduction PDF
Following slide depicts the flowchart for the Six Sigma process improvement method which will assist in making client happier to meet their demands on time . The process passes through various stages such as order produced , preparation of invoiced, payment, etc. Showcasing this set of slides titled Six Sigma Continuous Process Improvement Mapping Flow Chart Introduction PDF. The topics addressed in these templates are Oder Produced, Oder Completed, Oder Received. All the content presented in this PPT design is completely editable. Download it and make adjustments in color, background, font etc. as per your unique business setting.
Business Analysis Chart Vector Icon Ppt PowerPoint Presentation Professional Display
This is a business analysis chart vector icon ppt powerpoint presentation professional display. This is a four stage process. The stages in this process are business marketing plan, business marketing strategies, business marketing approach.
Donut Pie Chart Ppt PowerPoint Presentation Icon Background Images
This is a donut pie chart ppt powerpoint presentation icon background images. This is a four stage process. The stages in this process are donut, process, planning, percentage, finance.
High Low Close Chart Ppt PowerPoint Presentation Icon Background Images
This is a high low close chart ppt powerpoint presentation icon background images. This is a ten stage process. The stages in this process are finance, analysis, planning, business, process.
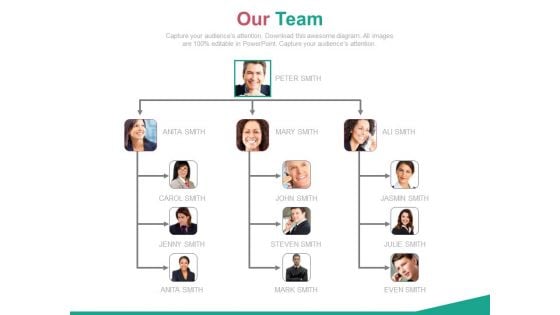
Organizational Chart For Business Intelligence Team Powerpoint Slides
Our above PowerPoint template displays an organizational chart with team pictures. This PPT slide may be used to display working of business intelligence team. You may download this PPT slide to present topics like team strategy and success.
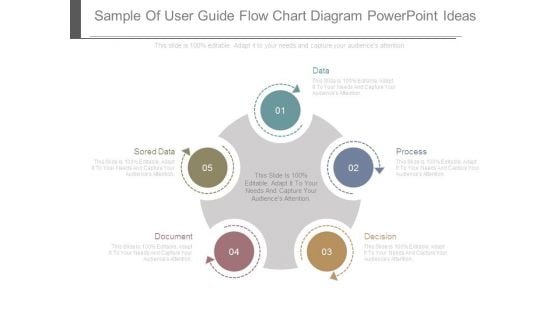
Sample Of User Guide Flow Chart Diagram Powerpoint Ideas
This is a sample of user guide flow chart diagram powerpoint ideas. This is a five stage process. The stages in this process are data, process, decision, document, sored data.
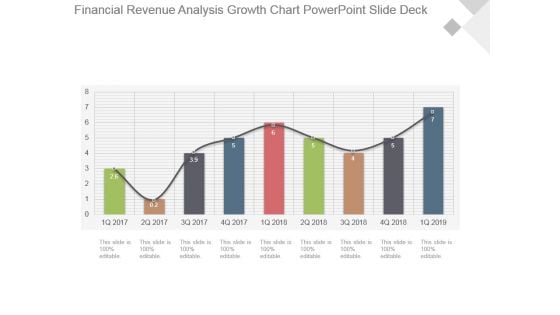
Financial Revenue Analysis Growth Chart Powerpoint Slide Deck
This is a financial revenue analysis growth chart powerpoint slide deck. This is a nine stage process. The stages in this process are growth, success, business, marketing, bar graph.
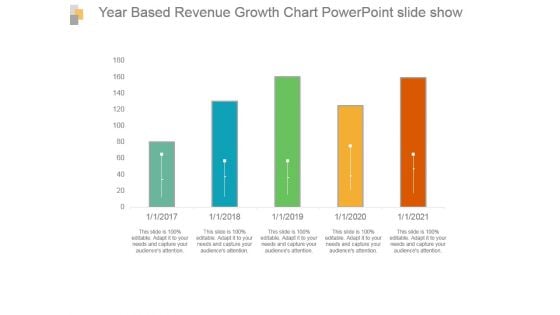
Year Based Revenue Growth Chart Powerpoint Slide Show
This is a year based revenue growth chart powerpoint slide show. This is a five stage process. The stages in this process are bar graph, growth, revenue, year, success.
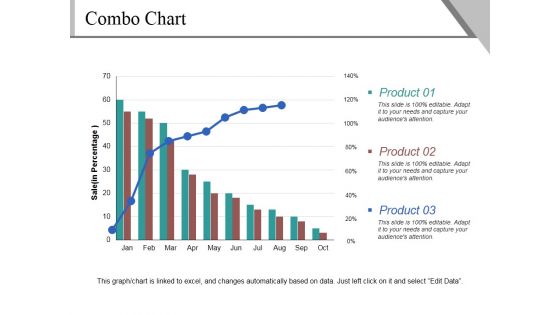
Combo Chart Ppt PowerPoint Presentation Ideas Visual Aids
This is a combo chart ppt powerpoint presentation ideas visual aids. This is a three stage process. The stages in this process are product, sales, bar graph, business, marketing.
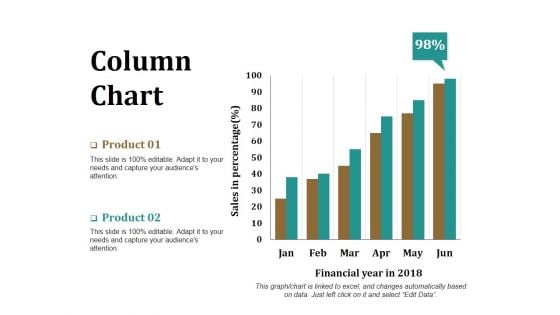
Column Chart Ppt PowerPoint Presentation Model Graphics Download
This is a column chart ppt powerpoint presentation model graphics download. This is a two stage process. The stages in this process are product, financial year, sales in percentage, bar graph, success.
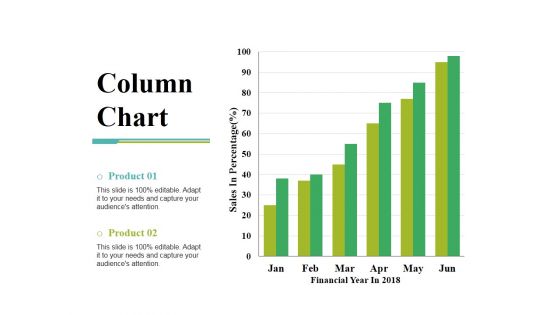
Column Chart Ppt PowerPoint Presentation Gallery Slide Portrait
This is a column chart ppt powerpoint presentation gallery slide portrait. This is a two stage process. The stages in this process are sales in percentage, financial year, product, bar graph, growth.
Mutual Fund Operation Flow Chart Diagram Ppt Icon
This is a mutual fund operation flow chart diagram ppt icon. This is a four stage process. The stages in this process are return, securities, investors, fund, mutual fund operation.
Feature Listing Price Comparison Chart Ppt PowerPoint Presentation Outline Icons
Presenting this set of slides with name feature listing price comparison chart ppt powerpoint presentation outline icons. The topics discussed in these slides are free, standard, premium, our plan. This is a completely editable PowerPoint presentation and is available for immediate download. Download now and impress your audience.
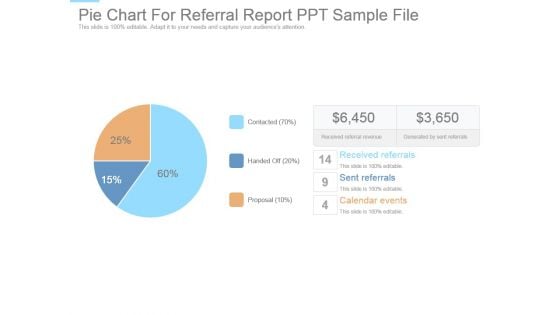
Pie Chart For Referral Report Ppt Sample File
This is a pie chart for referral report ppt sample file. This is a three stage process. The stages in this process are received referrals, sent referrals, calendar events, proposal, handed off, contacted, received referral revenue, generated by sent referrals.
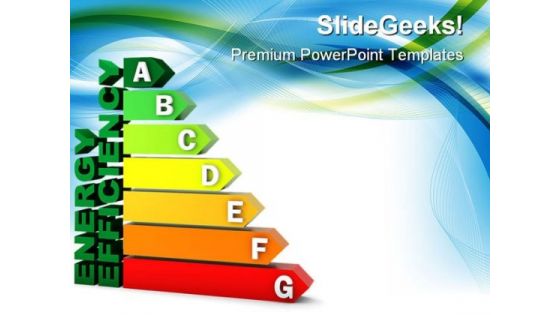
Energy Efficiency Chart Geographical PowerPoint Templates And PowerPoint Backgrounds 0311
Microsoft PowerPoint Template and Background with energy efficiency rating certification system Change is a constant in corporate life. Detect the correct co-efficient with our Energy Efficiency Chart Geographical PowerPoint Templates And PowerPoint Backgrounds 0311.
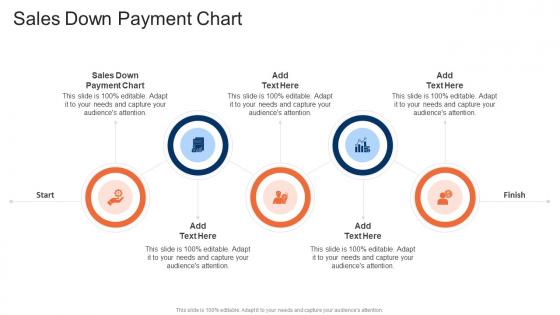
Sales Down Payment Chart In Powerpoint And Google Slides Cpb
Presenting our innovatively-designed set of slides titled Sales Down Payment Chart In Powerpoint And Google Slides Cpb. This completely editable PowerPoint graphic exhibits Sales Down Payment Chart that will help you convey the message impactfully. It can be accessed with Google Slides and is available in both standard screen and widescreen aspect ratios. Apart from this, you can download this well-structured PowerPoint template design in different formats like PDF, JPG, and PNG. So, click the download button now to gain full access to this PPT design. Our Sales Down Payment Chart In Powerpoint And Google Slides Cpb are topically designed to provide an attractive backdrop to any subject. Use them to look like a presentation pro.
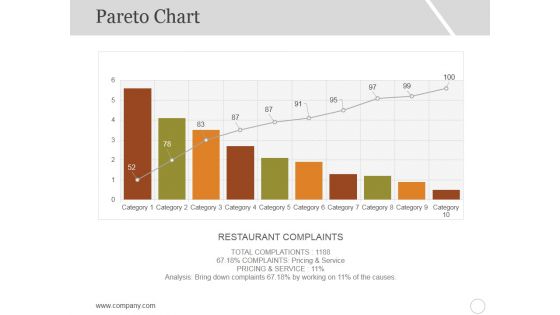
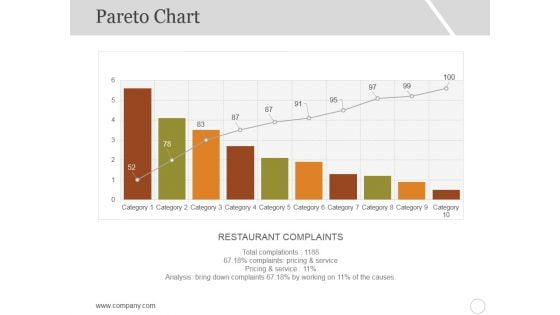
Pareto Chart Template 1 Ppt PowerPoint Presentation Ideas Graphics
This is a pareto chart template 1 ppt powerpoint presentation ideas graphics. This is a ten stage process. The stages in this process are restaurant complaints, category, business, graph.
Pareto Chart Template 2 Ppt PowerPoint Presentation Portfolio Gallery
This is a pareto chart template 2 ppt powerpoint presentation portfolio gallery. This is a ten stage process. The stages in this process are restaurant complaints, category, business, graph.
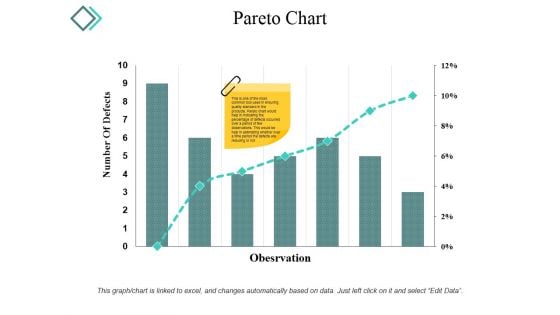
Pareto Chart Ppt PowerPoint Presentation Infographic Template Microsoft
This is a pareto chart ppt powerpoint presentation infographic template microsoft. This is a seven stage process. The stages in this process are number of defects, observation, graph, percentage, business.
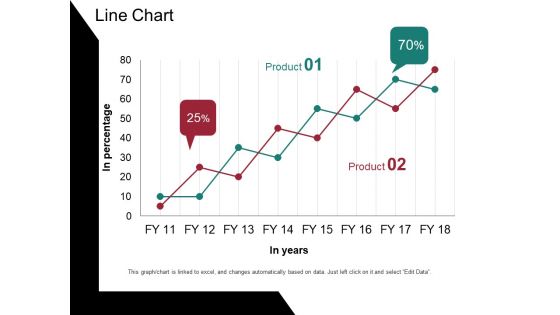
Line Chart Ppt PowerPoint Presentation Portfolio Design Templates
This is a line chart ppt powerpoint presentation portfolio design templates. This is a two stage process. The stages in this process are in percentage, in years, percentage, business, graph.
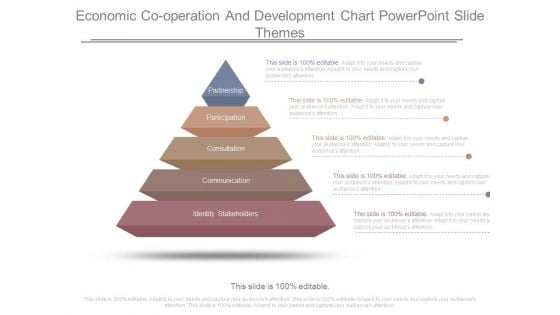
Economic Cooperation And Development Chart Powerpoint Slide Themes
This is a economic cooperation and development chart powerpoint slide themes. This is a five stage process. The stages in this process are partnership, participation, consultation, communication, identify, stakeholders.
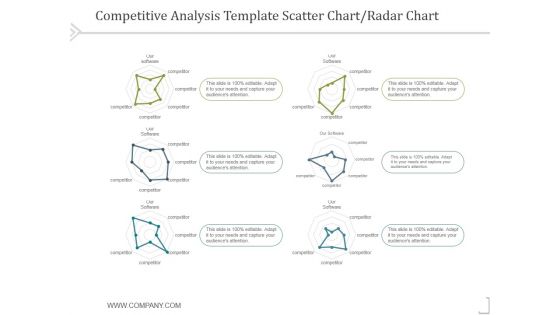
Competitive Analysis Scatter Chart Template 1 Ppt PowerPoint Presentation Themes
This is a competitive analysis scatter chart template 1 ppt powerpoint presentation themes. This is a six stage process. The stages in this process are business, strategy, marketing, success, analysis.
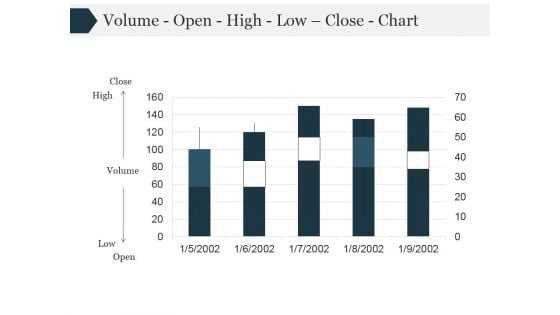
Volume Open High Low Close Chart Ppt PowerPoint Presentation Themes
This is a volume open high low close chart ppt powerpoint presentation themes. This is a five stage process. The stages in this process are high, volume, close, low.
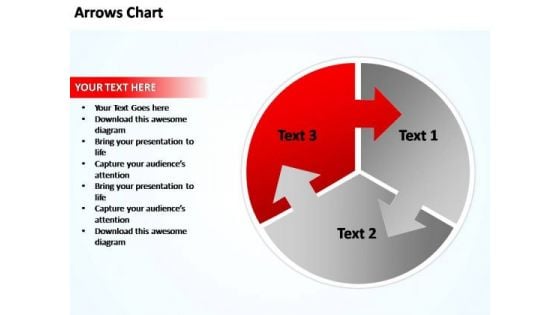
PowerPoint Templates Business Circular Plan With Arrows Chart Ppt Slides
PowerPoint Templates Business Circular Plan With Arrows Chart PPT Slides-Explore the various directions and layers existing in your in your plans and processes. Unravel the desired and essential elements of your overall strategy. Explain the relevance of the different layers and stages and directions in getting down to your core competence, ability and desired result. Compose your song with our PowerPoint Templates Business Circular Plan With Arrows Chart Ppt Slides. You will come out on top.
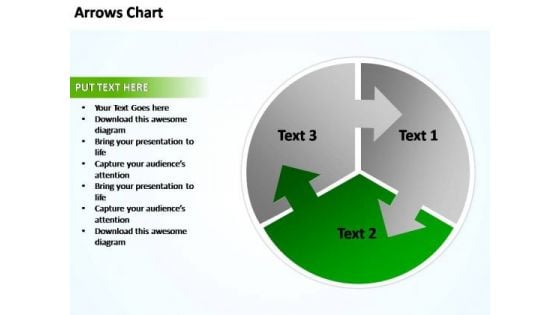
PowerPoint Templates Business Circular Plan With Arrows Chart Ppt Designs
PowerPoint Templates Business Circular Plan With Arrows Chart PPT Designs-Explore the various directions and layers existing in your in your plans and processes. Unravel the desired and essential elements of your overall strategy. Explain the relevance of the different layers and stages and directions in getting down to your core competence, ability and desired result. Exert influence with our PowerPoint Templates Business Circular Plan With Arrows Chart Ppt Designs. Get opinions going for you.

Conversion Rate Optimization Flow Chart Sample Diagram Powerpoint Slides Images
This is a conversion rate optimization flow chart sample diagram powerpoint slides images. This is a five stage process. The stages in this process are gather insights, measure, unique, pitch, status, future.

Conversion Rate Optimization Flow Chart Sample Diagram Example Ppt
This is a conversion rate optimization flow chart sample diagram example ppt. This is a four stage process. The stages in this process are measure, gather insights, test, form hypothesis.


 Continue with Email

 Home
Home


