Control Chart
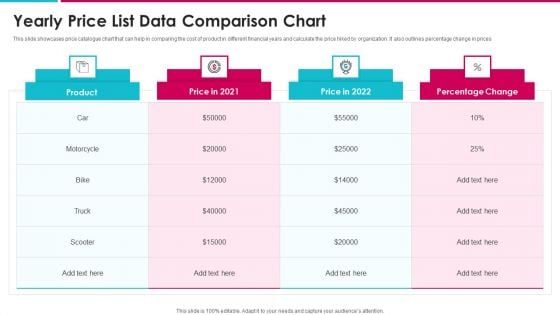
Yearly Price List Data Comparison Chart Structure PDF
This slide showcases price catalogue chart that can help in comparing the cost of product in different financial years and calculate the price hiked by organization. It also outlines percentage change in prices Showcasing this set of slides titled yearly price list data comparison chart structure pdf. The topics addressed in these templates are yearly price list data comparison chart. All the content presented in this PPT design is completely editable. Download it and make adjustments in color, background, font etc. as per your unique business setting.
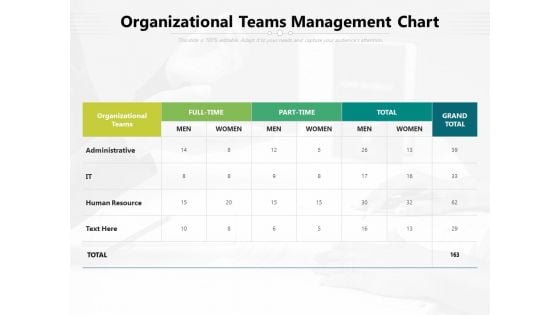
Organizational Teams Management Chart Ppt PowerPoint Presentation File Outline PDF
Presenting this set of slides with name organizational teams management chart ppt powerpoint presentation file outline pdf. The topics discussed in these slides are administrative, human resource, organizational teams. This is a completely editable PowerPoint presentation and is available for immediate download. Download now and impress your audience.
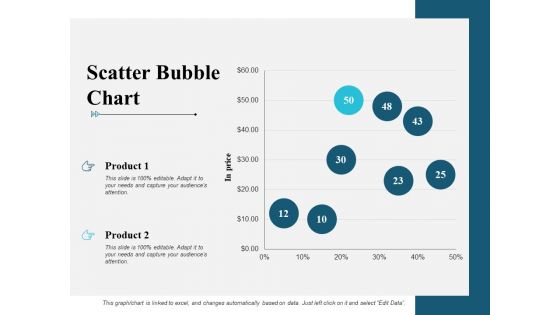
Scatter Bubble Chart Graph Ppt PowerPoint Presentation Infographic Template Maker
This is a scatter bubble chart graph ppt powerpoint presentation infographic template maker. This is a two stage process. The stages in this process are finance, marketing, management, investment, analysis.
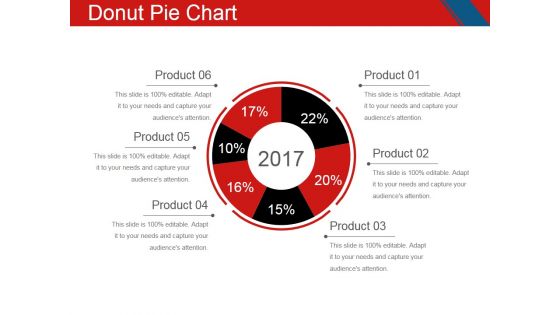
Donut Pie Chart Ppt PowerPoint Presentation Infographic Template Sample
This is a donut pie chart ppt powerpoint presentation infographic template sample. This is a six stage process. The stages in this process are business, pie, process, planning, strategy.
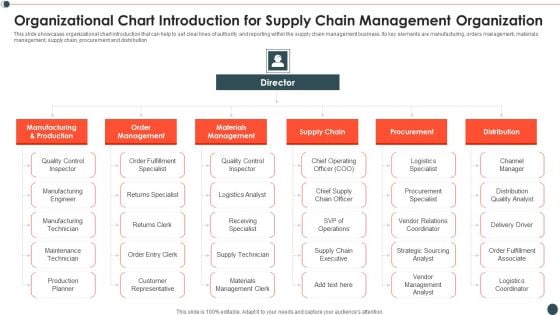
Organizational Chart Introduction For Supply Chain Management Organization Infographics PDF
This slide showcases organizational chart introduction that can help to set clear lines of authority and reporting within the supply chain management business. Its key elements are manufacturing, orders management, materials management, supply chain, procurement and distribution.Showcasing this set of slides titled Organizational Chart Introduction For Supply Chain Management Organization Infographics PDF The topics addressed in these templates are Manufacturing Production, Order Management, Materials Management All the content presented in this PPT design is completely editable. Download it and make adjustments in color, background, font etc. as per your unique business setting.
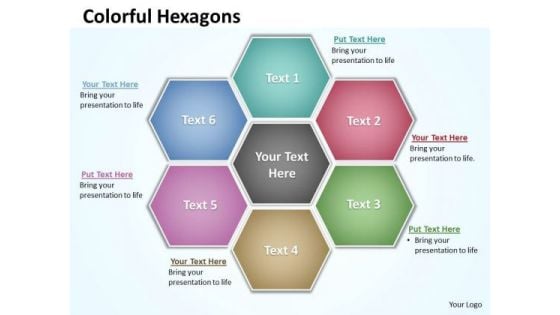
Ppt Hexagon Shapes Chart Presentation PowerPoint Tips Free Download Templates
PPT hexagon shapes chart presentation powerpoint tips free download Templates-This Hexagon diagram is a graphical illustration of the relationships between and among sets of data, groups of objects. . Present your views using this innovative slide and be assured of leaving a lasting impression.-PPT hexagon shapes chart presentation powerpoint tips free download Templates-Abstract, Background, Design, Digital, Elements, Graphic, Grey, Hexagon, Illustration, Light, Modern, Perspective, Triangles, Shapes, Shiny, Style, Technology, Template, Vector, Vertical, Virtual, Wallpaper, Web Experience the aesthetics of our Ppt Hexagon Shapes Chart Presentation PowerPoint Tips Free Download Templates. They are created with brilliant design sense.
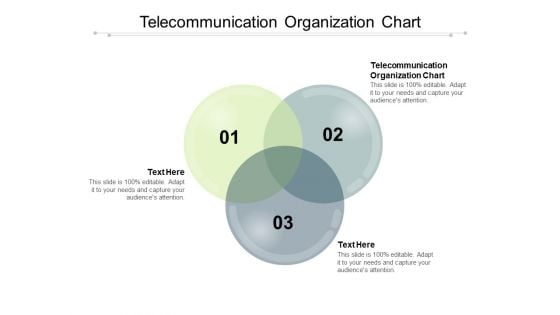
Telecommunication Organization Chart Ppt PowerPoint Presentation Slides Guide Cpb Pdf
Presenting this set of slides with name telecommunication organization chart ppt powerpoint presentation slides guide cpb pdf. This is an editable Powerpoint three stages graphic that deals with topics like telecommunication organization chart to help convey your message better graphically. This product is a premium product available for immediate download and is 100 percent editable in Powerpoint. Download this now and use it in your presentations to impress your audience.
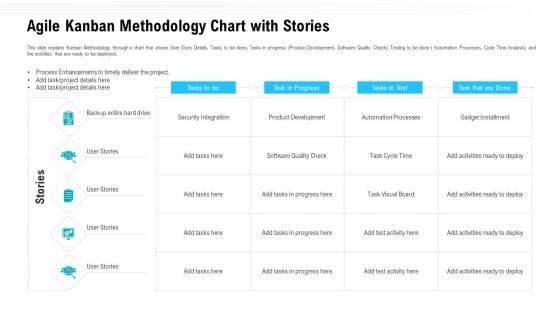
Agile Kanban Methodology Chart With Stories Ppt Model Show PDF
This slide explains Kanban Methodology through a chart that shows User Story Details, Tasks to be done, Tasks in progress Product Development, Software Quality Check, Testing to be done Automation Processes, Cycle Time Analysis and the activities that are ready to be deployed. Deliver an awe inspiring pitch with this creative agile kanban methodology chart with stories ppt model show pdf bundle. Topics like product development, process enhancements to timely deliver the project, agile kanban methodology chart with stories can be discussed with this completely editable template. It is available for immediate download depending on the needs and requirements of the user.
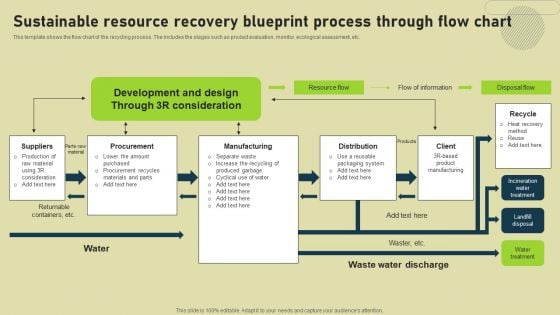
Sustainable Resource Recovery Blueprint Process Through Flow Chart Inspiration PDF
This template shows the flow chart of the recycling process. The includes the stages such as product evaluation, monitor, ecological assessment, etc. Pitch your topic with ease and precision using this Sustainable Resource Recovery Blueprint Process Through Flow Chart Inspiration PDF. This layout presents information on Procurement, Manufacturing, Suppliers. It is also available for immediate download and adjustment. So, changes can be made in the color, design, graphics or any other component to create a unique layout.
Chart Extracellular In Powerpoint And Google Slides Cpb
Introducing our well designed Chart Extracellular In Powerpoint And Google Slides Cpb This PowerPoint design presents information on topics like Chart Extracellular As it is predesigned it helps boost your confidence level. It also makes you a better presenter because of its high quality content and graphics. This PPT layout can be downloaded and used in different formats like PDF, PNG, and JPG. Not only this, it is available in both Standard Screen and Widescreen aspect ratios for your convenience. Therefore, click on the download button now to persuade and impress your audience. Our Chart Extracellular In Powerpoint And Google Slides Cpb are topically designed to provide an attractive backdrop to any subject. Use them to look like a presentation pro.
Levels Chart Examples In Powerpoint And Google Slides Cpb
Introducing our well designed Levels Chart Examples In Powerpoint And Google Slides Cpb This PowerPoint design presents information on topics like Levels Chart Examples As it is predesigned it helps boost your confidence level. It also makes you a better presenter because of its high quality content and graphics. This PPT layout can be downloaded and used in different formats like PDF, PNG, and JPG. Not only this, it is available in both Standard Screen and Widescreen aspect ratios for your convenience. Therefore, click on the download button now to persuade and impress your audience. Our Levels Chart Examples In Powerpoint And Google Slides Cpb are topically designed to provide an attractive backdrop to any subject. Use them to look like a presentation pro.
Function Flow Chart In Powerpoint And Google Slides Cpb
Introducing our well designed Function Flow Chart In Powerpoint And Google Slides Cpb. This PowerPoint design presents information on topics like Function Flow Chart. As it is predesigned it helps boost your confidence level. It also makes you a better presenter because of its high quality content and graphics. This PPT layout can be downloaded and used in different formats like PDF, PNG, and JPG. Not only this, it is available in both Standard Screen and Widescreen aspect ratios for your convenience. Therefore, click on the download button now to persuade and impress your audience. Our Function Flow Chart In Powerpoint And Google Slides Cpb are topically designed to provide an attractive backdrop to any subject. Use them to look like a presentation pro.
Pregnancy Heart Rate Chart In Powerpoint And Google Slides Cpb
Introducing our well designed Pregnancy Heart Rate Chart In Powerpoint And Google Slides Cpb. This PowerPoint design presents information on topics like Pregnancy Heart Rate Chart. As it is predesigned it helps boost your confidence level. It also makes you a better presenter because of its high quality content and graphics. This PPT layout can be downloaded and used in different formats like PDF, PNG, and JPG. Not only this, it is available in both Standard Screen and Widescreen aspect ratios for your convenience. Therefore, click on the download button now to persuade and impress your audience. Our Pregnancy Heart Rate Chart In Powerpoint And Google Slides Cpb are topically designed to provide an attractive backdrop to any subject. Use them to look like a presentation pro.
Triptans Comparison Chart In Powerpoint And Google Slides Cpb
Presenting our innovatively designed set of slides titled Triptans Comparison Chart In Powerpoint And Google Slides Cpb This completely editable PowerPoint graphic exhibits Triptans Comparison Chart that will help you convey the message impactfully. It can be accessed with Google Slides and is available in both standard screen and widescreen aspect ratios. Apart from this, you can download this well structured PowerPoint template design in different formats like PDF, JPG, and PNG. So, click the download button now to gain full access to this PPT design. Our Triptans Comparison Chart In Powerpoint And Google Slides Cpb are topically designed to provide an attractive backdrop to any subject. Use them to look like a presentation pro.
Foods Chart In Powerpoint And Google Slides Cpb
Introducing our well designed Foods Chart In Powerpoint And Google Slides Cpb. This PowerPoint design presents information on topics like Foods Chart. As it is predesigned it helps boost your confidence level. It also makes you a better presenter because of its high-quality content and graphics. This PPT layout can be downloaded and used in different formats like PDF, PNG, and JPG. Not only this, it is available in both Standard Screen and Widescreen aspect ratios for your convenience. Therefore, click on the download button now to persuade and impress your audience. Our Foods Chart In Powerpoint And Google Slides Cpb are topically designed to provide an attractive backdrop to any subject. Use them to look like a presentation pro.
Sound Quality Chart In Powerpoint And Google Slides Cpb
Presenting our innovatively designed set of slides titled Sound Quality Chart In Powerpoint And Google Slides Cpb. This completely editable PowerPoint graphic exhibits Sound Quality Chart that will help you convey the message impactfully. It can be accessed with Google Slides and is available in both standard screen and widescreen aspect ratios. Apart from this, you can download this well structured PowerPoint template design in different formats like PDF, JPG, and PNG. So, click the download button now to gain full access to this PPT design. Our Sound Quality Chart In Powerpoint And Google Slides Cpb are topically designed to provide an attractive backdrop to any subject. Use them to look like a presentation pro.
Gantt Chart Multiple Projects In Powerpoint And Google Slides Cpb
Introducing our well designed Gantt Chart Multiple Projects In Powerpoint And Google Slides Cpb. This PowerPoint design presents information on topics like Gantt Chart Multiple Projects. As it is predesigned it helps boost your confidence level. It also makes you a better presenter because of its high quality content and graphics. This PPT layout can be downloaded and used in different formats like PDF, PNG, and JPG. Not only this, it is available in both Standard Screen and Widescreen aspect ratios for your convenience. Therefore, click on the download button now to persuade and impress your audience. Our Gantt Chart Multiple Projects In Powerpoint And Google Slides Cpb are topically designed to provide an attractive backdrop to any subject. Use them to look like a presentation pro.
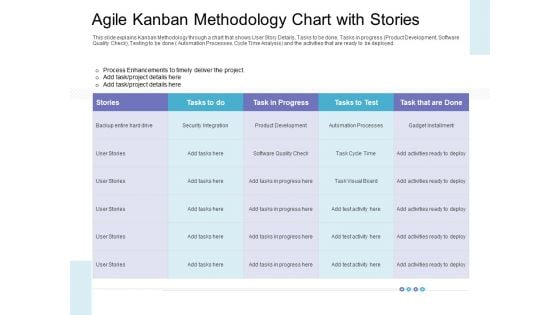
Agile Kanban Methodology Chart With Stories Formats PDF
This slide explains Kanban Methodology through a chart that shows User Story Details, Tasks to be done, Tasks in progress Product Development, Software Quality Check, Testing to be done Automation Processes, Cycle Time Analysis and the activities that are ready to be deployed. Deliver an awe-inspiring pitch with this creative agile kanban methodology chart with stories formats pdf bundle. Topics like agile kanban methodology chart with stories can be discussed with this completely editable template. It is available for immediate download depending on the needs and requirements of the user.
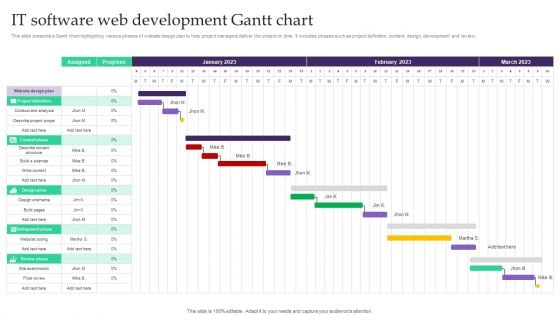
IT Software Web Development Gantt Chart Topics PDF
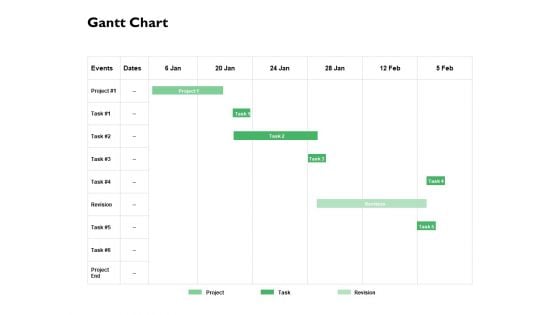
Gantt Chart Finance Ppt PowerPoint Presentation Outline Elements
Presenting this set of slides with name gantt chart finance ppt powerpoint presentation outline elements. The topics discussed in these slides are business, planning, strategy, marketing, management. This is a completely editable PowerPoint presentation and is available for immediate download. Download now and impress your audience.
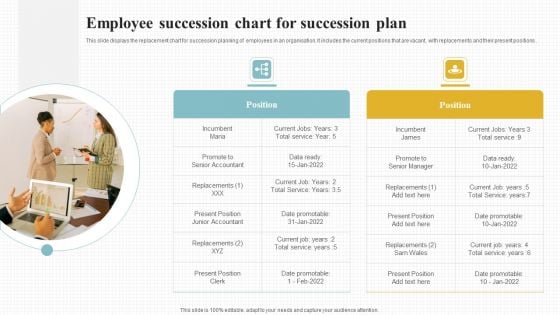
Employee Succession Chart For Succession Plan Elements PDF
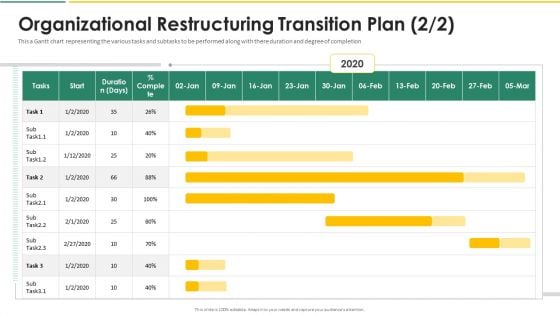
Organization Chart And Corporate Model Transformation Organizational Restructuring Background PDF
This a Gantt chart representing the various tasks and subtasks to be performed along with there duration and degree of completion. Deliver and pitch your topic in the best possible manner with this organization chart and corporate model transformation organizational restructuring background pdf. Use them to share invaluable insights on organizational restructuring transition plan and impress your audience. This template can be altered and modified as per your expectations. So, grab it now.
Product Marketing Department Team Organizational Chart Icon Professional PDF
Persuade your audience using this Product Marketing Department Team Organizational Chart Icon Professional PDF. This PPT design covers three stages, thus making it a great tool to use. It also caters to a variety of topics including Team Organizational Chart Icon, Product Marketing Department. Download this PPT design now to present a convincing pitch that not only emphasizes the topic but also showcases your presentation skills.
Confidence Chart Ppt PowerPoint Presentation Icon Background Cpb Pdf
Presenting this set of slides with name confidence chart ppt powerpoint presentation icon background cpb pdf. This is an editable Powerpoint five stages graphic that deals with topics like confidence chart to help convey your message better graphically. This product is a premium product available for immediate download and is 100 percent editable in Powerpoint. Download this now and use it in your presentations to impress your audience.
Business Quality Improvement Chart Icon With Arrow Graphics PDF
Persuade your audience using this Business Quality Improvement Chart Icon With Arrow Graphics PDF This PPT design covers one stage, thus making it a great tool to use. It also caters to a variety of topics including Business Quality, Improvement Chart, Icon With Arrow Download this PPT design now to present a convincing pitch that not only emphasizes the topic but also showcases your presentation skills.
Cost Benefit Analysis Chart With Icons Powerpoint Layout
This is a cost benefit analysis chart with icons powerpoint layout. This is a two stage process. The stages in this process are balance scale, compare, business, marketing, management.
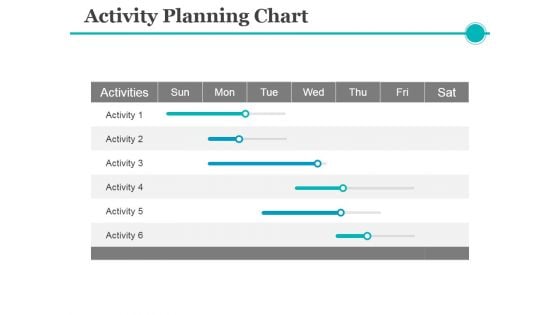
Activity Planning Chart Ppt PowerPoint Presentation Visual Aids Model
This is a activity planning chart ppt powerpoint presentation visual aids model. This is a six stage process. The stages in this process are activities, business, management, table, planning.
Combo Chart Marketing Analysis Ppt Powerpoint Presentation Pictures Icons
This is a combo chart marketing analysis ppt powerpoint presentation pictures icons. This is a three stage process. The stages in this process are finance, marketing, management, investment, analysis.
Clustered Bar Chart Finance Ppt Powerpoint Presentation Icon Graphics Template
This is a clustered bar chart finance ppt powerpoint presentation icon graphics template. This is a four stage process. The stages in this process are finance, marketing, management, investment, analysis.

Insurance Claim Approval Flow Chart Ppt Powerpoint Presentation Styles Gallery
This is a insurance claim approval flow chart ppt powerpoint presentation styles gallery. This is a four stage process. The stages in this process are insurance claim process, insurance claim steps, insurance claim procedure.
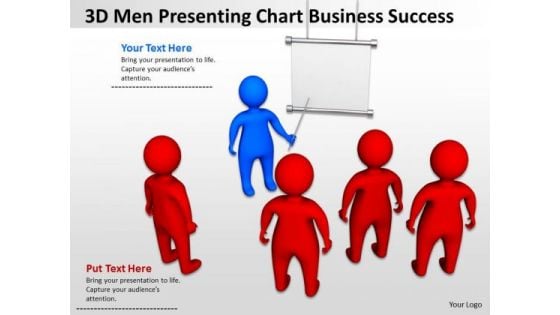
Business Organizational Chart Examples 3d Men Pressenting Success PowerPoint Slides
We present our business organizational chart examples 3d men pressenting success PowerPoint Slides.Present our Communication PowerPoint Templates because Our PowerPoint Templates and Slides ensures Effective communication. They help you put across your views with precision and clarity. Download and present our Business PowerPoint Templates because Our PowerPoint Templates and Slides will let your ideas bloom. Create a bed of roses for your audience. Use our Shapes PowerPoint Templates because Our PowerPoint Templates and Slides will Embellish your thoughts. They will help you illustrate the brilliance of your ideas. Download and present our People PowerPoint Templates because It can Bubble and burst with your ideas. Present our Leadership PowerPoint Templates because Our PowerPoint Templates and Slides will effectively help you save your valuable time. They are readymade to fit into any presentation structure. Use these PowerPoint slides for presentations relating to 3d, Background, Blank, Board, Business, Character, Chart, Communication, Computer, Concept, Consultant, Cooperation, Cute, Dialogue, Discussion, Easel, Empty, Expert, Expertise, Figure, Flipchart, Graphic, Group, Guy, Human, Icon, Idea, Illustration, Leader, Leadership, Manager, Meeting, Men, People, Person, Plan, Pointing, Present, Presentation, Puppet, Speaker, Speech, Teamwork, Whiteboard. The prominent colors used in the PowerPoint template are Red, White, Blue. Presenters tell us our business organizational chart examples 3d men pressenting success PowerPoint Slides are visually appealing. PowerPoint presentation experts tell us our Chart PowerPoint templates and PPT Slides are designed by professionals Professionals tell us our business organizational chart examples 3d men pressenting success PowerPoint Slides will make you look like a winner. People tell us our Chart PowerPoint templates and PPT Slides are designed by a team of presentation professionals. The feedback we get is that our business organizational chart examples 3d men pressenting success PowerPoint Slides are designed by professionals Customers tell us our Chart PowerPoint templates and PPT Slides will get their audience's attention. Correct wrongs with our Business Organizational Chart Examples 3d Men Pressenting Success PowerPoint Slides. Download without worries with our money back guaranteee.
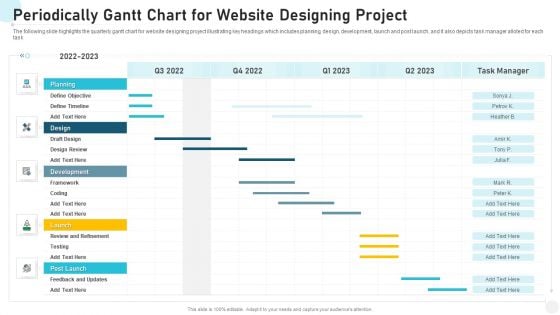
Periodically Gantt Chart For Website Designing Project Portrait PDF
The following slide highlights the quarterly gantt chart for website designing project illustrating key headings which includes planning, design, development, launch and post launch, and it also depicts task manager alloted for each task Showcasing this set of slides titled periodically gantt chart for website designing project portrait pdf. The topics addressed in these templates are periodically gantt chart for website designing project. All the content presented in this PPT design is completely editable. Download it and make adjustments in color, background, font etc. as per your unique business setting.

Price Catalogue Chart For Supplier Services Assessment Inspiration PDF
This slide showcases price catalogue chart that can help organization to make comparative assessment of transportation and warehousing costs of different suppliers. It also outlines cost per unit comparison of raw materials of Showcasing this set of slides titled price catalogue chart for supplier services assessment inspiration pdf. The topics addressed in these templates are price catalogue chart for supplier services assessment. All the content presented in this PPT design is completely editable. Download it and make adjustments in color, background, font etc. as per your unique business setting.
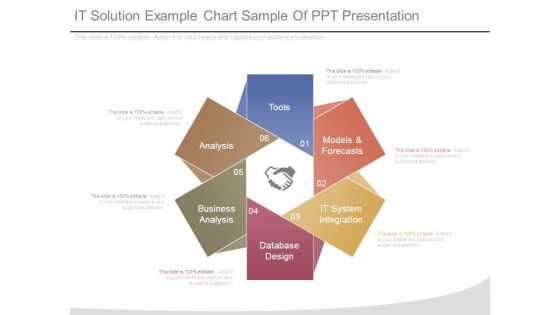
It Solution Example Chart Sample Of Ppt Presentation
This is a it solution example chart sample of ppt presentation. This is a six stage process. The stages in this process are tools, models and forecasts, it system integration, database design, business analysis, analysis.
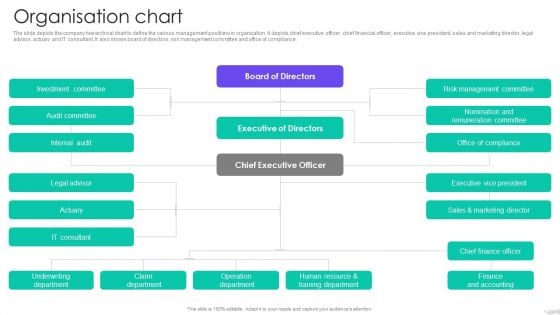
Insurance Services Firm Profile Organisation Chart Diagrams PDF
The slide depicts the company hierarchical chart to define the various management positions in organization. It depicts chief executive officer, chief financial officer, executive vice president, sales and marketing director, legal advisor, actuary and IT consultant. It also shows board of directors, risk management committee and office of compliance. Deliver an awe inspiring pitch with this creative Insurance Services Firm Profile Organisation Chart Diagrams PDF bundle. Topics like Executive Of Directors, Chief Executive Officer, Board Of Directors can be discussed with this completely editable template. It is available for immediate download depending on the needs and requirements of the user.
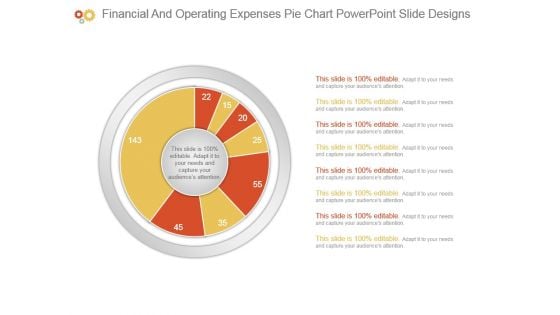
Financial And Operating Expenses Pie Chart Powerpoint Slide Designs
This is a financial and operating expenses pie chart powerpoint slide designs. This is a eight stage process. The stages in this process are business, diagram, marketing, management, presentation.
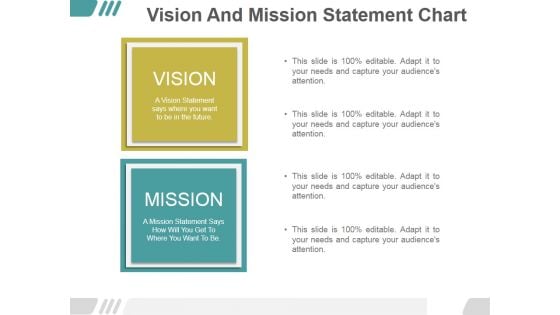
Vision And Mission Statement Chart Ppt PowerPoint Presentation Samples
This is a vision and mission statement chart ppt powerpoint presentation samples. This is a two stage process. The stages in this process are vision, business, marketing, mission, management.
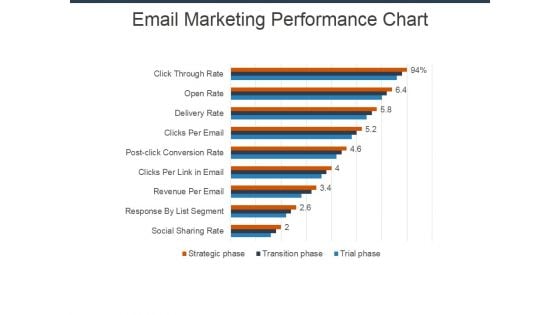
Email Marketing Performance Chart Ppt Powerpoint Presentation Pictures Show
This is a email marketing performance chart ppt powerpoint presentation pictures show. This is a nine stage process. The stages in this process are finance, planning, marketing, business, management, strategy.

Emotional Investing Chart Ppt PowerPoint Presentation Portfolio Model Cpb Pdf
Presenting this set of slides with name emotional investing chart ppt powerpoint presentation portfolio model cpb pdf. This is an editable Powerpoint one stages graphic that deals with topics like emotional investing chart to help convey your message better graphically. This product is a premium product available for immediate download and is 100 percent editable in Powerpoint. Download this now and use it in your presentations to impress your audience.
Companies Comparison Chart Vector Icon Ppt PowerPoint Presentation Files PDF
Persuade your audience using this companies comparison chart vector icon ppt powerpoint presentation files pdf. This PPT design covers one stages, thus making it a great tool to use. It also caters to a variety of topics including companies comparison chart vector icon. Download this PPT design now to present a convincing pitch that not only emphasizes the topic but also showcases your presentation skills.
Hierarchy Chart Organizational Structure Ppt PowerPoint Presentation Icon Guide Cpb
Presenting this set of slides with name hierarchy chart organizational structure ppt powerpoint presentation icon guide cpb. This is an editable Powerpoint four stages graphic that deals with topics like hierarchy chart organizational structure to help convey your message better graphically. This product is a premium product available for immediate download and is 100 percent editable in Powerpoint. Download this now and use it in your presentations to impress your audience.
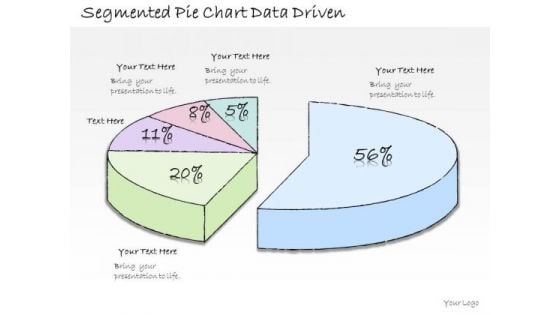
Ppt Slide Segmented Pie Chart Data Driven Business Diagrams
Dribble Away With Our PPT Slide segmented pie chart data driven business diagrams Powerpoint Templates. Score A Goal With Your Ideas. Drill It In With Our Business Plan Powerpoint Templates. Embed Your Message Into The Minds Of Your Audience.
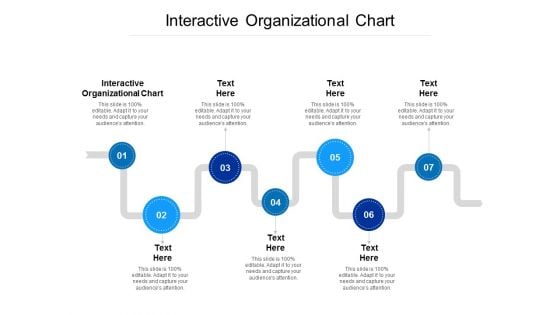
Interactive Organizational Chart Ppt PowerPoint Presentation Pictures Good Cpb
Presenting this set of slides with name interactive organizational chart ppt powerpoint presentation pictures good cpb. This is an editable Powerpoint seven stages graphic that deals with topics like interactive organizational chart to help convey your message better graphically. This product is a premium product available for immediate download and is 100 percent editable in Powerpoint. Download this now and use it in your presentations to impress your audience.
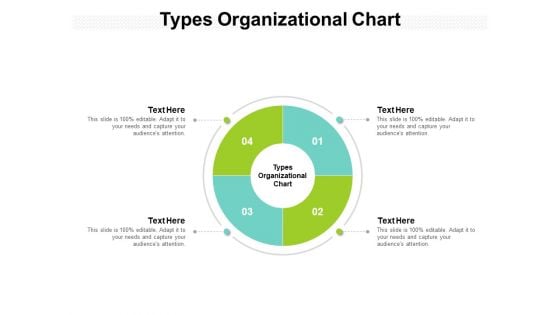
Types Organizational Chart Ppt PowerPoint Presentation Show Cpb
Presenting this set of slides with name types organizational chart ppt powerpoint presentation show cpb. This is an editable Powerpoint four stages graphic that deals with topics like types organizational chart to help convey your message better graphically. This product is a premium product available for immediate download and is 100 percent editable in Powerpoint. Download this now and use it in your presentations to impress your audience.
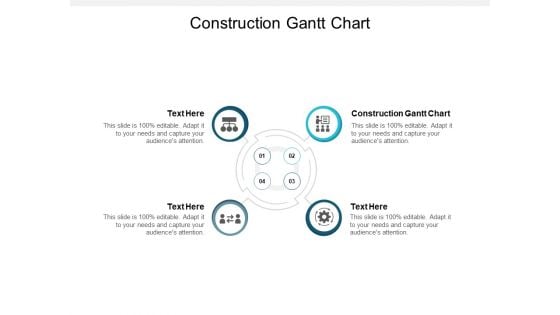
Construction Gantt Chart Ppt PowerPoint Presentation Show Vector Cpb
Presenting this set of slides with name construction gantt chart ppt powerpoint presentation show vector cpb. This is an editable Powerpoint four stages graphic that deals with topics like construction gantt chart to help convey your message better graphically. This product is a premium product available for immediate download and is 100 percent editable in Powerpoint. Download this now and use it in your presentations to impress your audience.
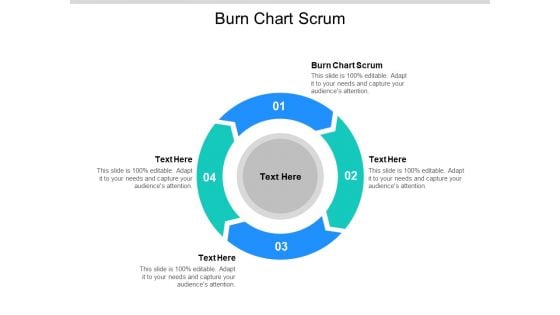
Burn Chart Scrum Ppt PowerPoint Presentation Sample Cpb Pdf
Presenting this set of slides with name burn chart scrum ppt powerpoint presentation sample cpb pdf. This is an editable Powerpoint four stages graphic that deals with topics like burn chart scrum to help convey your message better graphically. This product is a premium product available for immediate download and is 100 percent editable in Powerpoint. Download this now and use it in your presentations to impress your audience.
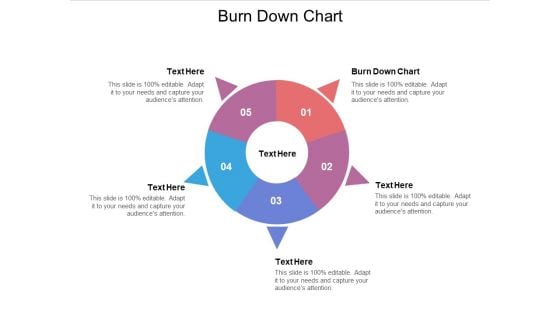
Burn Down Chart Ppt PowerPoint Presentation Slides Influencers Cpb Pdf
Presenting this set of slides with name burn down chart ppt powerpoint presentation slides influencers cpb pdf. This is an editable Powerpoint five stages graphic that deals with topics like burn down chart to help convey your message better graphically. This product is a premium product available for immediate download and is 100 percent editable in Powerpoint. Download this now and use it in your presentations to impress your audience.
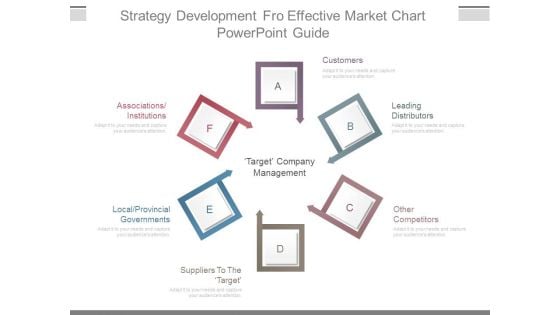
Strategy Development Fro Effective Market Chart Powerpoint Guide
This is a strategy development fro effective market chart powerpoint guide. This is a six stage process. The stages in this process are customers, leading distributors, other competitors, suppliers to the target, local provincial governments, associations institutions, target company management.
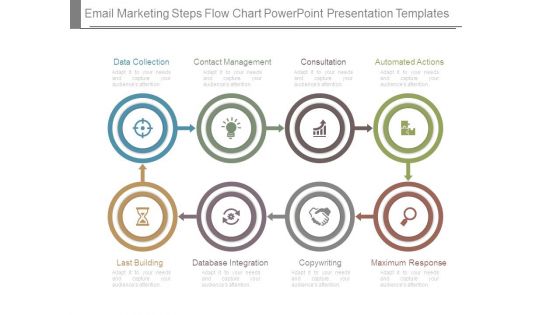
Email Marketing Steps Flow Chart Powerpoint Presentation Templates
This is a email marketing steps flow chart powerpoint presentation templates. This is a eight stage process. The stages in this process are data collection, contact management, consultation, automated actions, last building, database integration, copywriting, maximum response.

Our Offers Vs The Competition Comparison Chart Ppt Example File
This is a our offers vs the competition comparison chart ppt example file. This is a five stage process. The stages in this process are compare, table, management, business, strategy.
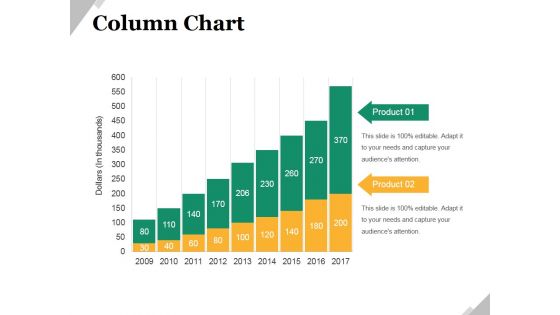
Column Chart Ppt PowerPoint Presentation Infographic Template Graphic Images
This is a column chart ppt powerpoint presentation infographic template graphic images. This is a nine stage process. The stages in this process are business, marketing, growth, product, management.
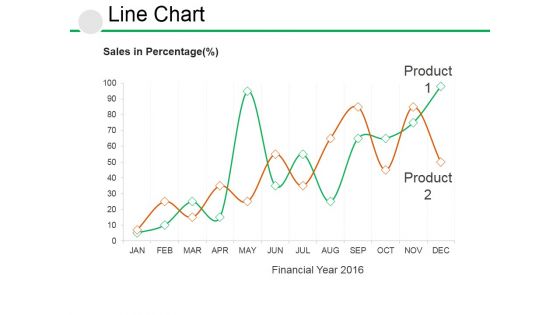
Line Chart Ppt PowerPoint Presentation Visual Aids Example File
This is a line chart ppt powerpoint presentation visual aids example file. This is a two stage process. The stages in this process are business, growth, strategy, analysis, management.
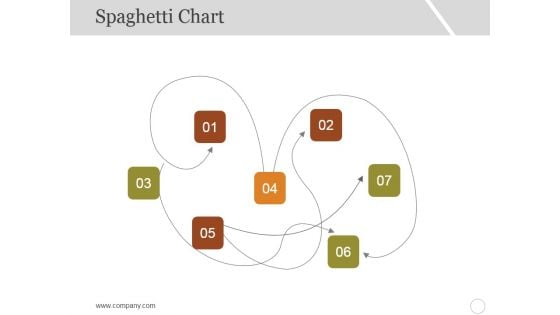
Spaghetti Chart Template 1 Ppt PowerPoint Presentation Slides Graphics Example
This is a spaghetti chart template 1 ppt powerpoint presentation slides graphics example. This is a seven stage process. The stages in this process are business, marketing, management, numbering.
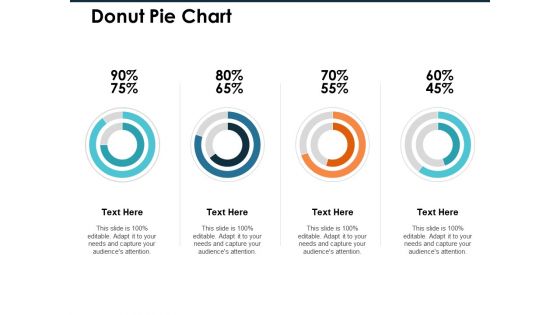
Donut Pie Chart Ppt PowerPoint Presentation Infographic Template Professional
This is a donut pie chart ppt powerpoint presentation infographic template professional. This is a four stage process. The stages in this process are finance, marketing, management, investment, analysis.
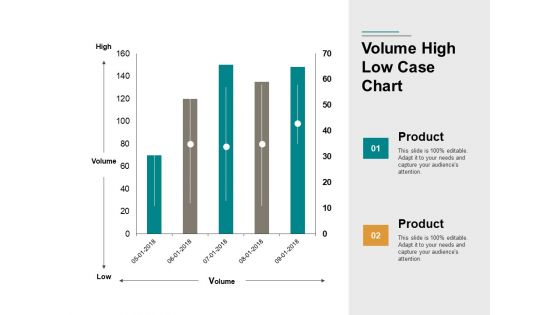
Volume High Low Case Chart Ppt PowerPoint Presentation Portfolio Images
This is a volume high low case chart ppt powerpoint presentation portfolio images. This is a two stage process. The stages in this process are finance, business, marketing, management.
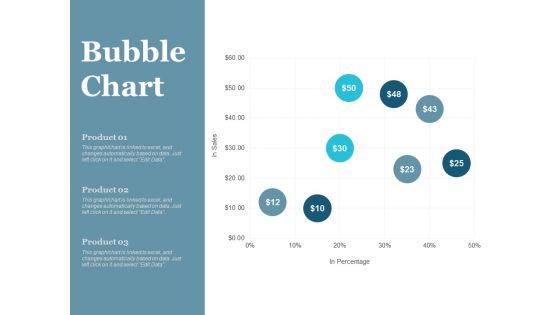
Bubble Chart Finance Ppt PowerPoint Presentation File Master Slide
This is a bubble chart finance ppt powerpoint presentation file master slide. This is a three stage process. The stages in this process are finance, marketing, management, investment, analysis.
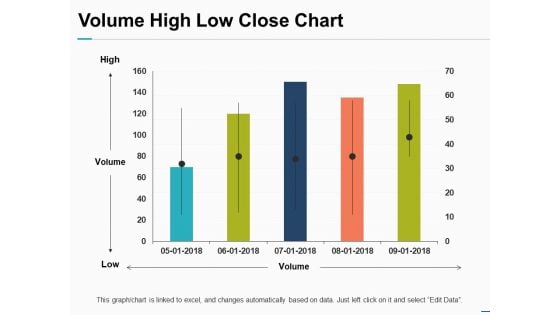
Volume High Low Close Chart Ppt PowerPoint Presentation Pictures Objects
This is a volume high low close chart ppt powerpoint presentation pictures objects. This is a one stage process. The stages in this process are finance, marketing, management, investment, analysis.
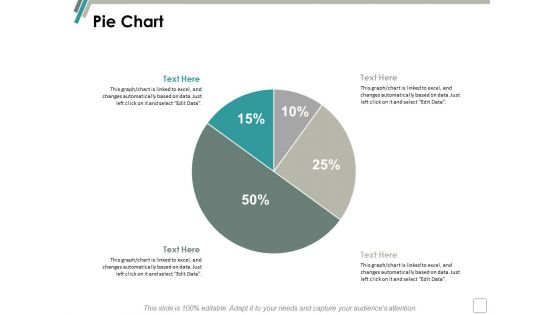
Pie Chart Finance Marketing Ppt Powerpoint Presentation Infographics Background
This is a pie chart finance marketing ppt powerpoint presentation infographics background. This is a two stage process. The stages in this process are finance, marketing, management, investment, analysis.
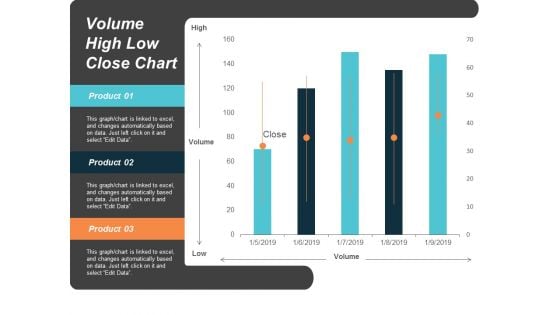
Volume High Low Close Chart Ppt Powerpoint Presentation Slides Images
This is a volume high low close chart ppt powerpoint presentation slides images. This is a five stage process. The stages in this process are finance, marketing, management, investment, analysis.

Area Chart Finance Marketing Ppt Powerpoint Presentation Gallery Slides
This is a area chart finance marketing ppt powerpoint presentation gallery slides. This is a three stage process. The stages in this process are finance, marketing, management, investment, analysis.


 Continue with Email

 Home
Home


