Daily Snapshot
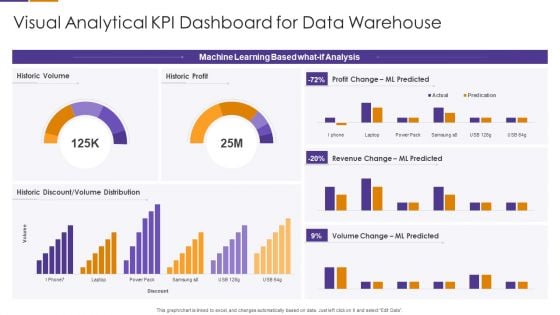
Visual Analytical KPI Dashboard For Data Warehouse Template PDF
Pitch your topic with ease and precision using this Visual Analytical KPI Dashboard For Data Warehouse Template PDF This layout presents information on Machine Learning Based, Volume Change, Revenue Change It is also available for immediate download and adjustment. So, changes can be made in the color, design, graphics or any other component to create a unique layout.

Descriptive And Inferential Methods Data Analytics For Informed Decision Ppt Slide
This slide represents the different techniques of descriptive and inferential statistical analysis. These are univariate, bivariate, multivariate, central limit theorem, binomial theorem, hypothesis testing, normal distribution, applied to means, etc. Find highly impressive Descriptive And Inferential Methods Data Analytics For Informed Decision Ppt Slide on Slidegeeks to deliver a meaningful presentation. You can save an ample amount of time using these presentation templates. No need to worry to prepare everything from scratch because Slidegeeks experts have already done a huge research and work for you. You need to download Descriptive And Inferential Methods Data Analytics For Informed Decision Ppt Slide for your upcoming presentation. All the presentation templates are 100 percent editable and you can change the color and personalize the content accordingly. Download now This slide represents the different techniques of descriptive and inferential statistical analysis. These are univariate, bivariate, multivariate, central limit theorem, binomial theorem, hypothesis testing, normal distribution, applied to means, etc.
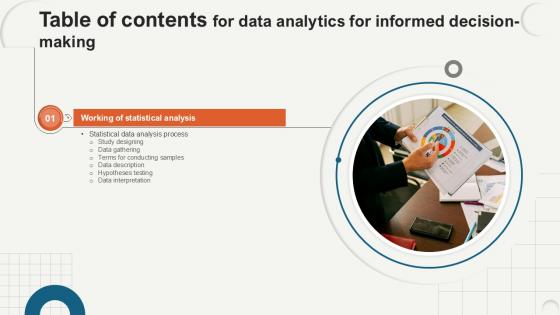
Table Of Contents Data Analytics For Informed Decision Making Ppt Slide
Get a simple yet stunning designed Table Of Contents Data Analytics For Informed Decision Making Ppt Slide. It is the best one to establish the tone in your meetings. It is an excellent way to make your presentations highly effective. So, download this PPT today from Slidegeeks and see the positive impacts. Our easy-to-edit Table Of Contents Data Analytics For Informed Decision Making Ppt Slide can be your go-to option for all upcoming conferences and meetings. So, what are you waiting for Grab this template today. Our Table Of Contents Data Analytics For Informed Decision Making Ppt Slide are topically designed to provide an attractive backdrop to any subject. Use them to look like a presentation pro.
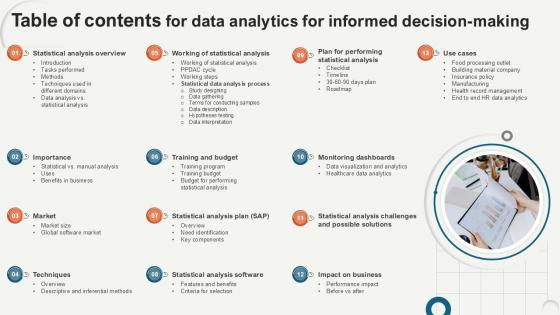
Table Of Contents For Data Analytics For Informed Decision Making Ppt Slide
From laying roadmaps to briefing everything in detail, our templates are perfect for you. You can set the stage with your presentation slides. All you have to do is download these easy-to-edit and customizable templates. Table Of Contents For Data Analytics For Informed Decision Making Ppt Slide will help you deliver an outstanding performance that everyone would remember and praise you for. Do download this presentation today. Our Table Of Contents For Data Analytics For Informed Decision Making Ppt Slide are topically designed to provide an attractive backdrop to any subject. Use them to look like a presentation pro.
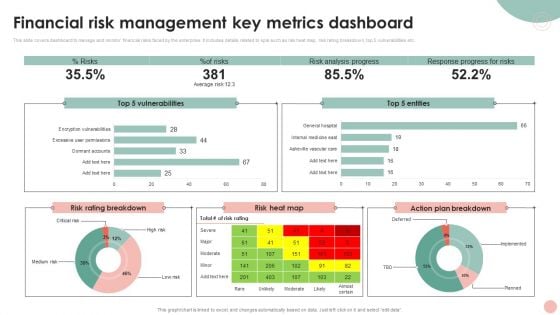
Company Risk Assessment Plan Financial Risk Management Key Metrics Dashboard Brochure PDF
This slide covers dashboard to manage and monitor financial risks faced by the enterprise. It includes details related to kpis such as risk heat map, risk rating breakdown, top 5 vulnerabilities etc. Crafting an eye catching presentation has never been more straightforward. Let your presentation shine with this tasteful yet straight forward Company Risk Assessment Plan Financial Risk Management Key Metrics Dashboard Brochure PDF template. It offers a minimalistic and classy look that is great for making a statement. The colors have been employed intelligently to add a bit of playfulness while still remaining professional. Construct the ideal Company Risk Assessment Plan Financial Risk Management Key Metrics Dashboard Brochure PDF that effortlessly grabs the attention of your audience. Begin now and be certain to wow your customers.
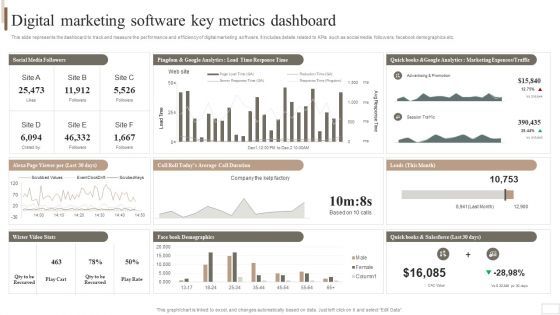
Strategic Plan For Enterprise Digital Marketing Software Key Metrics Dashboard Brochure PDF
This slide represents the dashboard to track and measure the performance and efficiency of digital marketing software. It includes details related to KPIs such as social media followers, facebook demographics etc. Do you have an important presentation coming up Are you looking for something that will make your presentation stand out from the rest Look no further than Strategic Plan For Enterprise Digital Marketing Software Key Metrics Dashboard Brochure PDF. With our professional designs, you can trust that your presentation will pop and make delivering it a smooth process. And with Slidegeeks, you can trust that your presentation will be unique and memorable. So why wait Grab Strategic Plan For Enterprise Digital Marketing Software Key Metrics Dashboard Brochure PDF today and make your presentation stand out from the rest.
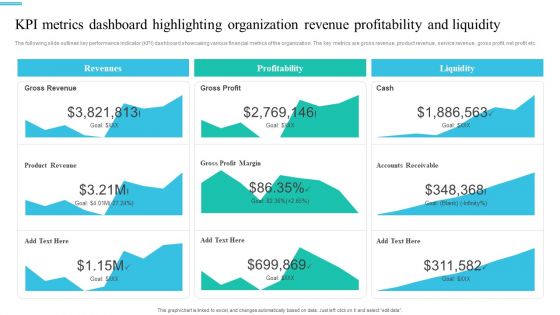
Monetary Planning And Evaluation Guide KPI Metrics Dashboard Highlighting Organization Revenue Profitability And Liquidity Ppt Diagram Images PDF
The following slide outlines key performance indicator KPI dashboard showcasing various financial metrics of the organization. The key metrics are gross revenue, product revenue, service revenue, gross profit, net profit etc. Coming up with a presentation necessitates that the majority of the effort goes into the content and the message you intend to convey. The visuals of a PowerPoint presentation can only be effective if it supplements and supports the story that is being told. Keeping this in mind our experts created Monetary Planning And Evaluation Guide KPI Metrics Dashboard Highlighting Organization Revenue Profitability And Liquidity Ppt Diagram Images PDF to reduce the time that goes into designing the presentation. This way, you can concentrate on the message while our designers take care of providing you with the right template for the situation.
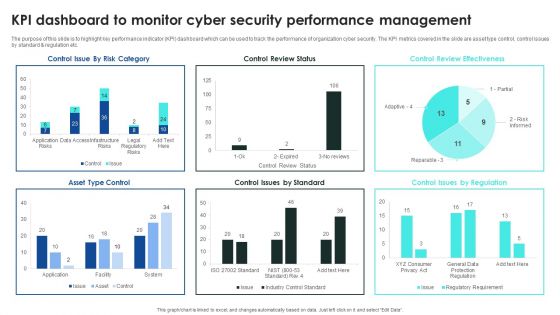
Implementing Cybersecurity Awareness Program To Prevent Attacks KPI Dashboard To Monitor Cyber Security Introduction PDF
The purpose of this slide is to highlight key performance indicator KPI dashboard which can be used to track the performance of organization cyber security. The KPI metrics covered in the slide are asset type control, control issues by standard and regulation etc. This Implementing Cybersecurity Awareness Program To Prevent Attacks KPI Dashboard To Monitor Cyber Security Introduction PDF is perfect for any presentation, be it in front of clients or colleagues. It is a versatile and stylish solution for organizing your meetings. The Implementing Cybersecurity Awareness Program To Prevent Attacks KPI Dashboard To Monitor Cyber Security Introduction PDF features a modern design for your presentation meetings. The adjustable and customizable slides provide unlimited possibilities for acing up your presentation. Slidegeeks has done all the homework before launching the product for you. So, do not wait, grab the presentation templates today
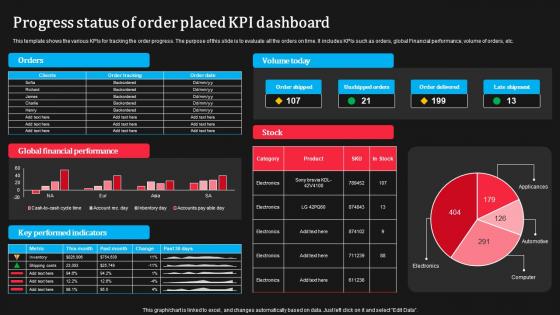
Progress Status Of Order Placed KPI Dashboard Sample Pdf
This template shows the various KPIs for tracking the order progress. The purpose of this slide is to evaluate all the orders on time. It includes KPIs such as orders, global Financial performance, volume of orders, etc.Pitch your topic with ease and precision using this Progress Status Of Order Placed KPI Dashboard Sample Pdf This layout presents information on Progress Status, Order Placed, KPI Dashboard It is also available for immediate download and adjustment. So, changes can be made in the color, design, graphics or any other component to create a unique layout. This template shows the various KPIs for tracking the order progress. The purpose of this slide is to evaluate all the orders on time. It includes KPIs such as orders, global Financial performance, volume of orders, etc.
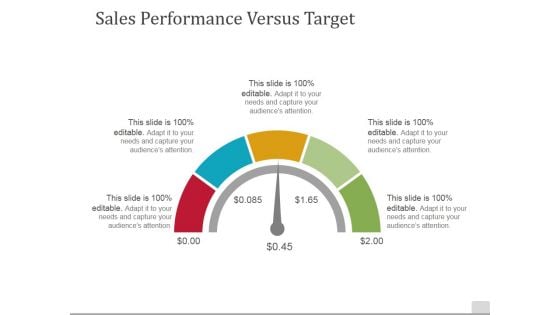
Sales Performance Versus Target Ppt PowerPoint Presentation Pictures Structure
This is a sales performance versus target ppt powerpoint presentation pictures structure. This is a five stage process. The stages in this process are business, dashboard, technology, process, marketing.
Schedule To Save Time Vector Icon Ppt PowerPoint Presentation File Gridlines PDF
Presenting this set of slides with name schedule to save time vector icon ppt powerpoint presentation file gridlines pdf. This is a three stage process. The stages in this process are schedule to save time vector icon. This is a completely editable PowerPoint presentation and is available for immediate download. Download now and impress your audience.
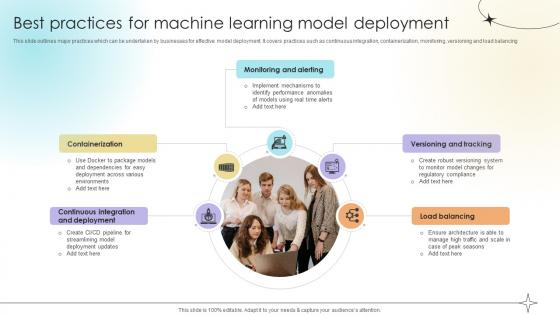
Best Practices For Machine Learning Model Deployment Data Analytics SS V
This slide outlines major practices which can be undertaken by businesses for effective model deployment. It covers practices such as continuous integration, containerization, monitoring, versioning and load balancing.This Best Practices For Machine Learning Model Deployment Data Analytics SS V is perfect for any presentation, be it in front of clients or colleagues. It is a versatile and stylish solution for organizing your meetings. The Best Practices For Machine Learning Model Deployment Data Analytics SS V features a modern design for your presentation meetings. The adjustable and customizable slides provide unlimited possibilities for acing up your presentation. Slidegeeks has done all the homework before launching the product for you. So, do not wait, grab the presentation templates today This slide outlines major practices which can be undertaken by businesses for effective model deployment. It covers practices such as continuous integration, containerization, monitoring, versioning and load balancing.
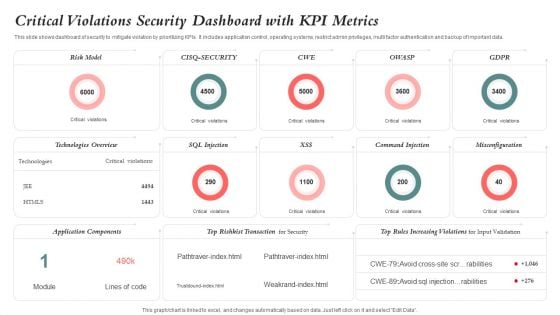
Critical Violations Security Dashboard With KPI Metrics Graphics PDF
This slide shows dashboard of security to mitigate violation by prioritizing KPIs. It includes application control, operating systems, restrict admin privileges, multi factor authentication and backup of important data. Showcasing this set of slides titled Critical Violations Security Dashboard With KPI Metrics Graphics PDF. The topics addressed in these templates are Risk Model, Application Components, Technologies Overview. All the content presented in this PPT design is completely editable. Download it and make adjustments in color, background, font etc. as per your unique business setting.
B2B Marketing Techniques Dashboard For Tracking Social Media Marketing Campaign
This slide showcases social media marketing campaign performance tracking dashboard which helps identify most profitable advertising channel. It provides information regarding KPIs such as impressions, likes, comments, shares, clicks, followers, cost er sessions etc. This modern and well-arranged B2B Marketing Techniques Dashboard For Tracking Social Media Marketing Campaign provides lots of creative possibilities. It is very simple to customize and edit with the Powerpoint Software. Just drag and drop your pictures into the shapes. All facets of this template can be edited with Powerpoint, no extra software is necessary. Add your own material, put your images in the places assigned for them, adjust the colors, and then you can show your slides to the world, with an animated slide included. This slide showcases social media marketing campaign performance tracking dashboard which helps identify most profitable advertising channel. It provides information regarding KPIs such as impressions, likes, comments, shares, clicks, followers, cost er sessions etc.
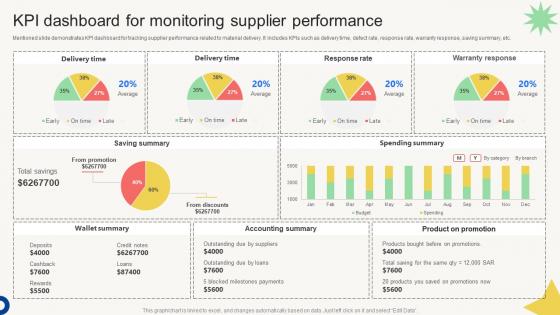
Vendor Management Audit KPI Dashboard For Monitoring Supplier Performance
Mentioned slide demonstrates KPI dashboard for tracking supplier performance related to material delivery. It includes KPIs such as delivery time, defect rate, response rate, warranty response, saving summary, etc. This modern and well-arranged Vendor Management Audit KPI Dashboard For Monitoring Supplier Performance provides lots of creative possibilities. It is very simple to customize and edit with the Powerpoint Software. Just drag and drop your pictures into the shapes. All facets of this template can be edited with Powerpoint, no extra software is necessary. Add your own material, put your images in the places assigned for them, adjust the colors, and then you can show your slides to the world, with an animated slide included. Mentioned slide demonstrates KPI dashboard for tracking supplier performance related to material delivery. It includes KPIs such as delivery time, defect rate, response rate, warranty response, saving summary, etc.
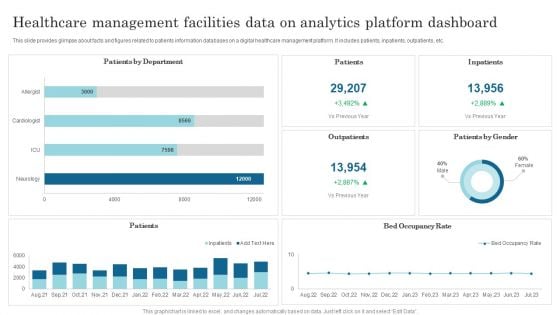
Healthcare Management Facilities Data On Analytics Platform Dashboard Slides PDF
This slide provides glimpse about facts and figures related to patients information databases on a digital healthcare management platform. It includes patients, inpatients, outpatients, etc. Showcasing this set of slides titled Healthcare Management Facilities Data On Analytics Platform Dashboard Slides PDF. The topics addressed in these templates are Patients By Department, Patients, Inpatients. All the content presented in this PPT design is completely editable. Download it and make adjustments in color, background, font etc. as per your unique business setting.
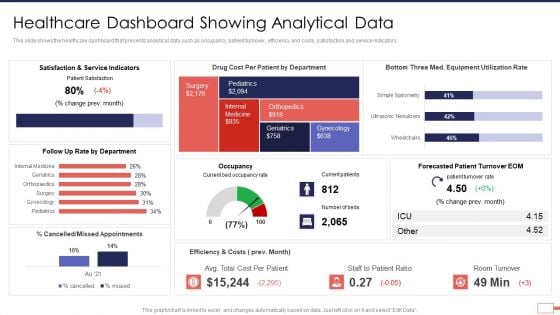
Iot Digital Twin Technology Post Covid Expenditure Management Healthcare Dashboard Showing Analytical Data Brochure PDF
This slide shows the healthcare dashboard that presents analytical data such as occupancy, patient turnover, efficiency and costs, satisfaction and service indicators. Deliver an awe inspiring pitch with this creative iot digital twin technology post covid expenditure management healthcare dashboard showing analytical data brochure pdf bundle. Topics like service, indicators, cost, appointments, turnover can be discussed with this completely editable template. It is available for immediate download depending on the needs and requirements of the user.
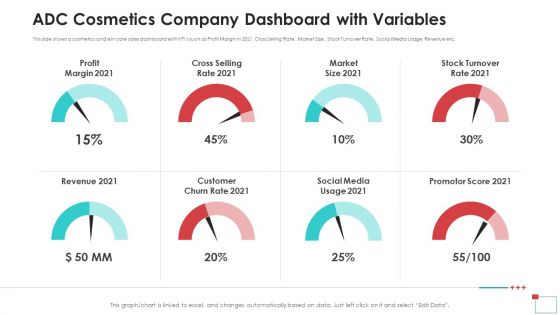
ADC Cosmetics Company Dashboard With Variables Introduction PDF
This slide shows a cosmetics and skin care sales dashboard with KPIs such as Profit Margin in 2021, Cross Selling Rate, Market Size, Stock Turnover Rate, Social Media Usage, Revenue etc. Presenting adc cosmetics company dashboard with variables introduction pdf to provide visual cues and insights. Share and navigate important information on eight stages that need your due attention. This template can be used to pitch topics like profit margin, revenue, market size, social media, promotor score. In addition, this PPT design contains high-resolution images, graphics, etc, that are easily editable and available for immediate download.
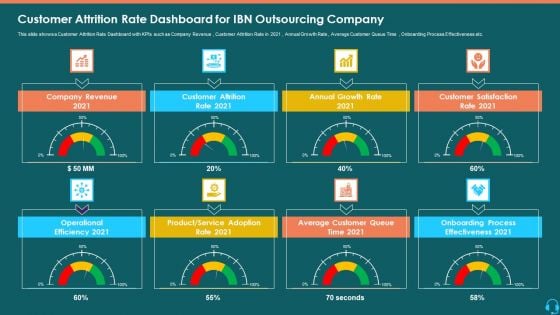
Customer Attrition Rate Dashboard For IBN Outsourcing Company Infographics PDF
This slide shows a Customer Attrition Rate Dashboard with KPIs such as Company Revenue , Customer Attrition Rate in 2021 , Annual Growth Rate , Average Customer Queue Time , Onboarding Process Effectiveness etc. This is a customer attrition rate dashboard for ibn outsourcing company infographics pdf template with various stages. Focus and dispense information on eight stages using this creative set, that comes with editable features. It contains large content boxes to add your information on topics like company revenue, annual growth, customer satisfaction, onboarding process, service adoption. You can also showcase facts, figures, and other relevant content using this PPT layout. Grab it now.
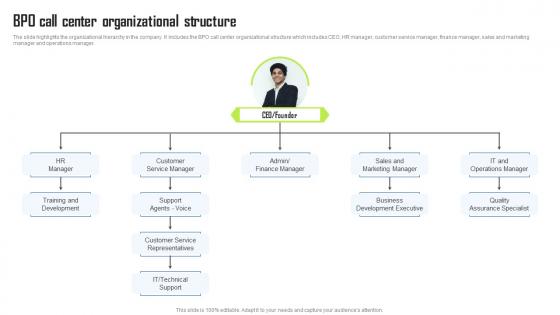
BPO Call Center Organizational Structure BPO Center Business Plan Brochure Pdf
The slide highlights the organizational hierarchy in the company. It includes the BPO call center organizational structure which includes CEO, HR manager, customer service manager, finance manager, sales and marketing manager and operations manager. Create an editable BPO Call Center Organizational Structure BPO Center Business Plan Brochure Pdf that communicates your idea and engages your audience. Whether you are presenting a business or an educational presentation, pre-designed presentation templates help save time. BPO Call Center Organizational Structure BPO Center Business Plan Brochure Pdf is highly customizable and very easy to edit, covering many different styles from creative to business presentations. Slidegeeks has creative team members who have crafted amazing templates. So, go and get them without any delay. The slide highlights the organizational hierarchy in the company. It includes the BPO call center organizational structure which includes CEO, HR manager, customer service manager, finance manager, sales and marketing manager and operations manager.
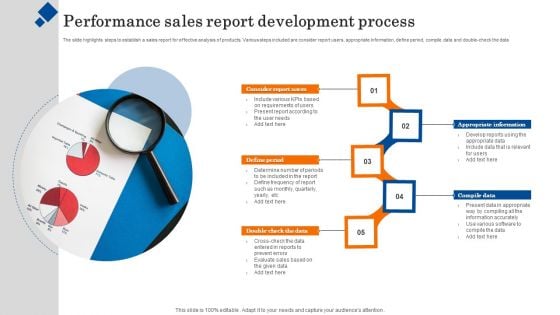
Performance Sales Report Development Process Portrait PDF
The slide highlights steps to establish a sales report for effective analysis of products. Various steps included are consider report users, appropriate information, define period, compile data and double-check the data. Persuade your audience using this Performance Sales Report Development Process Portrait PDF. This PPT design covers five stages, thus making it a great tool to use. It also caters to a variety of topics including Compile Data, Appropriate Information, Consider Report Users. Download this PPT design now to present a convincing pitch that not only emphasizes the topic but also showcases your presentation skills.
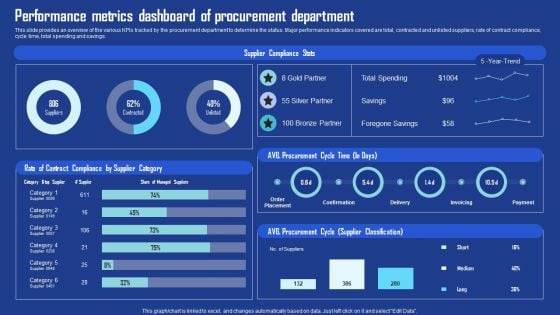
Performance Metrics Dashboard Of Procurement Department Download PDF
This slide provides an overview of the various KPIs tracked by the procurement department to determine the status. Major performance indicators covered are total, contracted and unlisted suppliers, rate of contract compliance, cycle time, total spending and savings. Slidegeeks has constructed Performance Metrics Dashboard Of Procurement Department Download PDF after conducting extensive research and examination. These presentation templates are constantly being generated and modified based on user preferences and critiques from editors. Here, you will find the most attractive templates for a range of purposes while taking into account ratings and remarks from users regarding the content. This is an excellent jumping off point to explore our content and will give new users an insight into our top notch PowerPoint Templates.
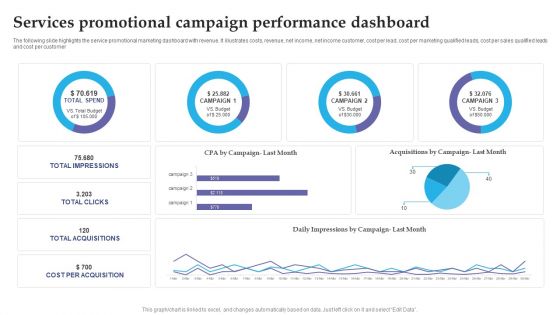
Services Promotional Campaign Performance Dashboard Slides PDF
The following slide highlights the service promotional marketing dashboard with revenue. It illustrates costs, revenue, net income, net income customer, cost per lead, cost per marketing qualified leads, cost per sales qualified leads and cost per customer. Pitch your topic with ease and precision using this Services Promotional Campaign Performance Dashboard Slides PDF. This layout presents information on Services Promotional, Campaign Performance Dashboard. It is also available for immediate download and adjustment. So, changes can be made in the color, design, graphics or any other component to create a unique layout.
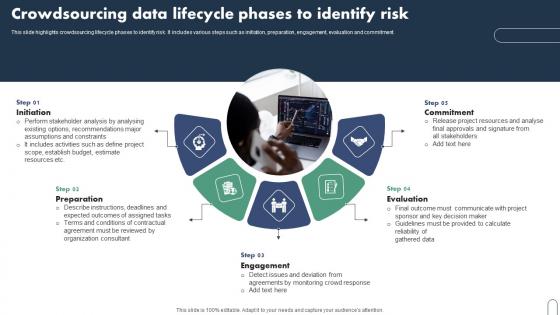
Crowdsourcing Data Lifecycle Phases To Identify Risk Pictures Pdf
This slide highlights crowdsourcing lifecycle phases to identify risk. It includes various steps such as initiation, preparation, engagement, evaluation and commitment. Pitch your topic with ease and precision using this Crowdsourcing Data Lifecycle Phases To Identify Risk Pictures Pdf This layout presents information on Preparation, Engagement, Evaluation, Commitment It is also available for immediate download and adjustment. So, changes can be made in the color, design, graphics or any other component to create a unique layout. This slide highlights crowdsourcing lifecycle phases to identify risk. It includes various steps such as initiation, preparation, engagement, evaluation and commitment.
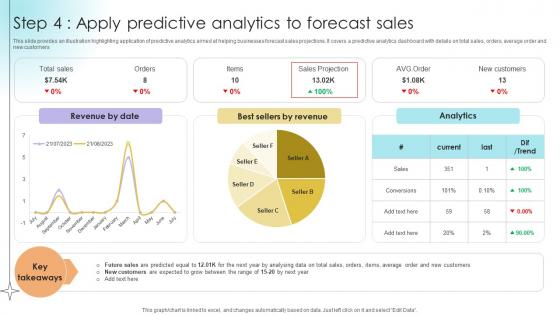
Step 4 Apply Predictive Analytics To Forecast Sales Data Analytics SS V
This slide provides an illustration highlighting application of predictive analytics aimed at helping businesses forecast sales projections. It covers a predictive analytics dashboard with details on total sales, orders, average order and new customers.Coming up with a presentation necessitates that the majority of the effort goes into the content and the message you intend to convey. The visuals of a PowerPoint presentation can only be effective if it supplements and supports the story that is being told. Keeping this in mind our experts created Step 4 Apply Predictive Analytics To Forecast Sales Data Analytics SS V to reduce the time that goes into designing the presentation. This way, you can concentrate on the message while our designers take care of providing you with the right template for the situation. This slide provides an illustration highlighting application of predictive analytics aimed at helping businesses forecast sales projections. It covers a predictive analytics dashboard with details on total sales, orders, average order and new customers.
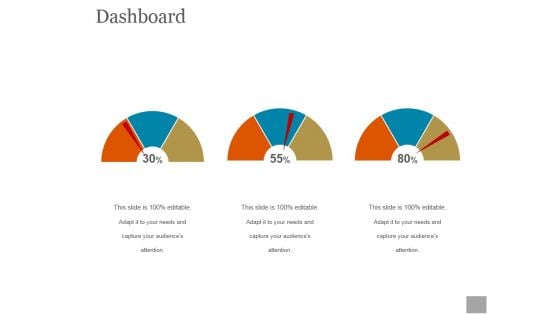
Dashboard Ppt PowerPoint Presentation Styles
This is a dashboard ppt powerpoint presentation styles. This is a three stage process. The stages in this process are dashboard, business, marketing, meter, speed.
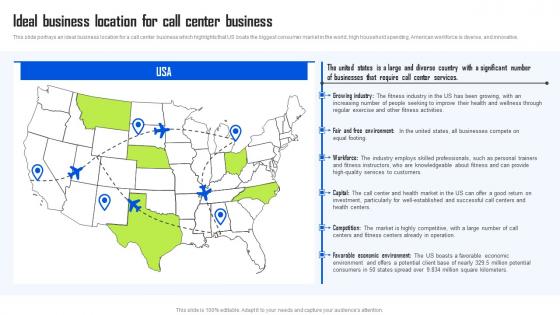
Ideal Business Location For Call Center Business BPO Center Business Plan Mockup Pdf
This slide portrays an ideal business location for a call center business which highlights that US boats the biggest consumer market in the world, high household spending, American workforce is diverse, and innovative. Make sure to capture your audiences attention in your business displays with our gratis customizable Ideal Business Location For Call Center Business BPO Center Business Plan Mockup Pdf These are great for business strategies, office conferences, capital raising or task suggestions. If you desire to acquire more customers for your tech business and ensure they stay satisfied, create your own sales presentation with these plain slides. This slide portrays an ideal business location for a call center business which highlights that US boats the biggest consumer market in the world, high household spending, American workforce is diverse, and innovative.
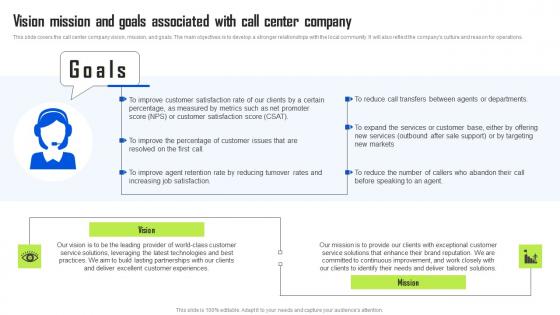
Vision Mission And Goals Associated With Call Center BPO Center Business Plan Mockup Pdf
This slide covers the call center company vision, mission, and goals. The main objectives is to develop a stronger relationships with the local community. It will also reflect the companys culture and reason for operations. Slidegeeks is one of the best resources for PowerPoint templates. You can download easily and regulate Vision Mission And Goals Associated With Call Center BPO Center Business Plan Mockup Pdf for your personal presentations from our wonderful collection. A few clicks is all it takes to discover and get the most relevant and appropriate templates. Use our Templates to add a unique zing and appeal to your presentation and meetings. All the slides are easy to edit and you can use them even for advertisement purposes. This slide covers the call center company vision, mission, and goals. The main objectives is to develop a stronger relationships with the local community. It will also reflect the companys culture and reason for operations.
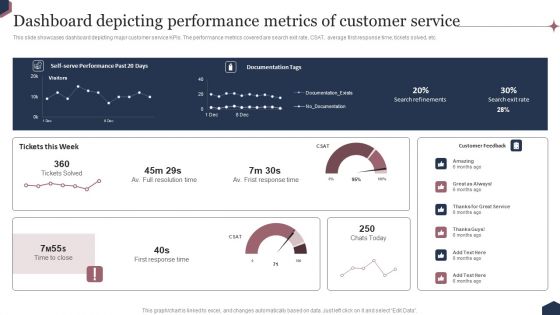
Enhance Customer Engagement Through After Sales Activities Dashboard Depicting Performance Metrics Formats PDF
This slide showcases dashboard depicting major customer service KPIs. The performance metrics covered are search exit rate, CSAT, average first response time, tickets solved, etc. There are so many reasons you need a Enhance Customer Engagement Through After Sales Activities Dashboard Depicting Performance Metrics Formats PDF. The first reason is you can not spend time making everything from scratch, Thus, Slidegeeks has made presentation templates for you too. You can easily download these templates from our website easily.
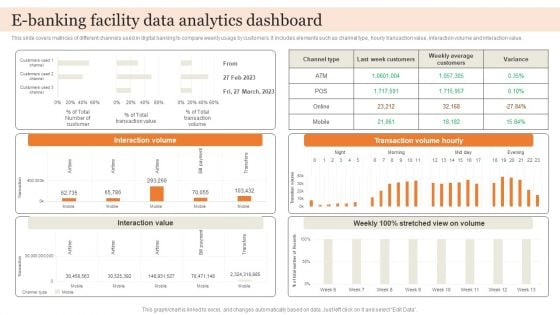
E Banking Facility Data Analytics Dashboard Brochure PDF
This slide covers matrices of different channels used in digital banking to compare weekly usage by customers. It includes elements such as channel type, hourly transaction value, interaction volume and interaction value. Showcasing this set of slides titled E Banking Facility Data Analytics Dashboard Brochure PDF. The topics addressed in these templates are Interaction Value, Transaction Volume Hourly, Interaction Volume. All the content presented in this PPT design is completely editable. Download it and make adjustments in color, background, font etc. as per your unique business setting.
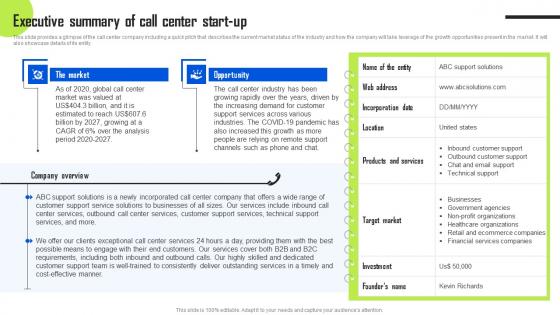
Executive Summary Of Call Center Start Up BPO Center Business Plan Topics Pdf
This slide provides a glimpse of the call center company including a quick pitch that describes the current market status of the industry and how the company will take leverage of the growth opportunities present in the market. It will also showcase details of its entity. Crafting an eye-catching presentation has never been more straightforward. Let your presentation shine with this tasteful yet straightforward Executive Summary Of Call Center Start Up BPO Center Business Plan Topics Pdf template. It offers a minimalistic and classy look that is great for making a statement. The colors have been employed intelligently to add a bit of playfulness while still remaining professional. Construct the ideal Executive Summary Of Call Center Start Up BPO Center Business Plan Topics Pdf that effortlessly grabs the attention of your audience. Begin now and be certain to wow your customers. This slide provides a glimpse of the call center company including a quick pitch that describes the current market status of the industry and how the company will take leverage of the growth opportunities present in the market. It will also showcase details of its entity.
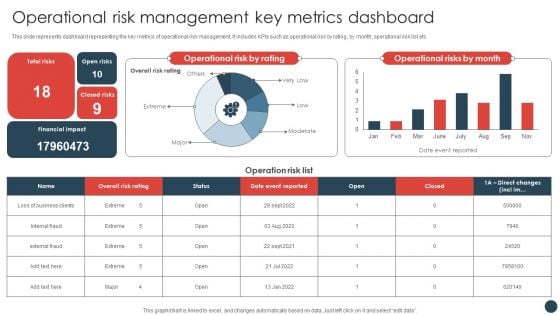
Strategic Risk Management Plan Operational Risk Management Key Metrics Dashboard Structure PDF
This slide represents dashboard representing the key metrics of operational risk management. It includes KPIs such as operational risk by rating, by month, operational risk list etc.Create an editable Strategic Risk Management Plan Operational Risk Management Key Metrics Dashboard Structure PDF that communicates your idea and engages your audience. Whether you are presenting a business or an educational presentation, pre-designed presentation templates help save time. Strategic Risk Management Plan Operational Risk Management Key Metrics Dashboard Structure PDF is highly customizable and very easy to edit, covering many different styles from creative to business presentations. Slidegeeks has creative team members who have crafted amazing templates. So, go and get them without any delay.
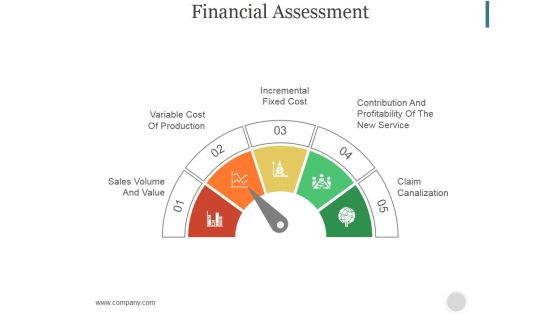
Financial Assessment Ppt PowerPoint Presentation Picture
This is a financial assessment ppt powerpoint presentation picture. This is a five stage process. The stages in this process are sales volume and value, variable cost of production, incremental fixed cost, contribution and profitability of the new service, claim canalization.
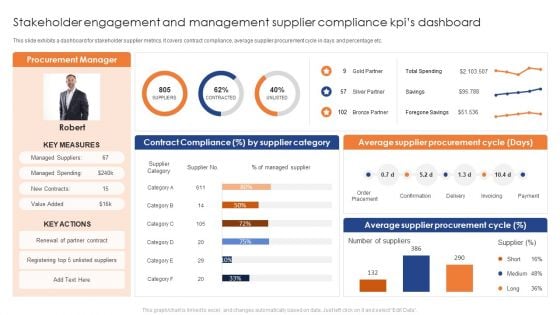
Stakeholder Engagement And Management Supplier Compliance Kpis Dashboard Pictures PDF
This slide exhibits a dashboard for stakeholder supplier metrics. It covers contract compliance, average supplier procurement cycle in days and percentage etc. Showcasing this set of slides titled Stakeholder Engagement And Management Supplier Compliance Kpis Dashboard Pictures PDF. The topics addressed in these templates are Average Supplier Procurement Cycle, Average Supplier Procurement Cycle . All the content presented in this PPT design is completely editable. Download it and make adjustments in color, background, font etc. as per your unique business setting.
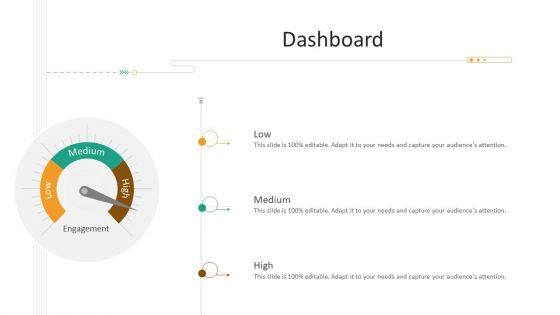
Strategic Planning Needs Evaluation Dashboard Ppt Layouts Graphics Template PDF
Presenting strategic planning needs evaluation dashboard ppt layouts graphics template pdf to provide visual cues and insights. Share and navigate important information on three stages that need your due attention. This template can be used to pitch topics like low, medium, high. In addtion, this PPT design contains high resolution images, graphics, etc, that are easily editable and available for immediate download.
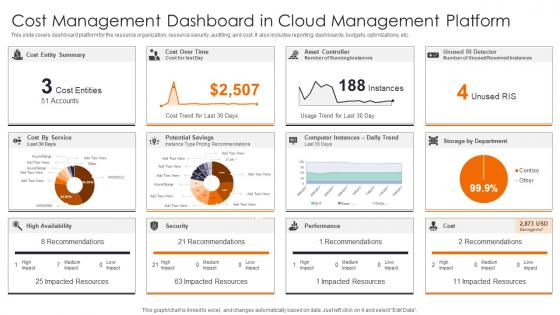
Cost Management Dashboard Enhancing Workload Efficiency Through Cloud Architecture Pictures Pdf
This slide covers dashboard platform for the resource organization, resource security, auditing, and cost. It also includes reporting, dashboards, budgets, optimizations, etc. Explore a selection of the finest Cost Management Dashboard Enhancing Workload Efficiency Through Cloud Architecture Pictures Pdf here. With a plethora of professionally designed and pre made slide templates, you can quickly and easily find the right one for your upcoming presentation. You can use our Cost Management Dashboard Enhancing Workload Efficiency Through Cloud Architecture Pictures Pdf to effectively convey your message to a wider audience. Slidegeeks has done a lot of research before preparing these presentation templates. The content can be personalized and the slides are highly editable. Grab templates today from Slidegeeks. This slide covers dashboard platform for the resource organization, resource security, auditing, and cost. It also includes reporting, dashboards, budgets, optimizations, etc.
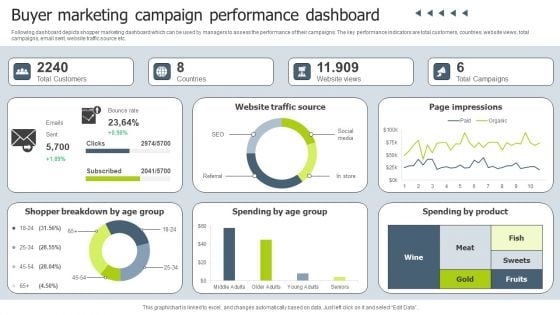
Buyer Marketing Campaign Performance Dashboard Download PDF
Following dashboard depicts shopper marketing dashboard which can be used by managers to assess the performance of their campaigns. The key performance indicators are total customers, countries, website views, total campaigns, email sent, website traffic source etc. Pitch your topic with ease and precision using this Buyer Marketing Campaign Performance Dashboard Download PDF. This layout presents information on Total Customers, Countries, Website Views. It is also available for immediate download and adjustment. So, changes can be made in the color, design, graphics or any other component to create a unique layout.
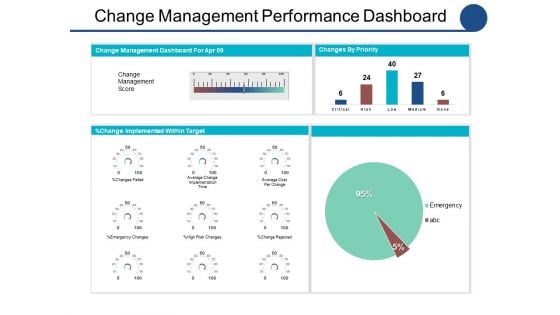
Change Management Performance Dashboard Ppt PowerPoint Presentation Slides Rules
This is a change management performance dashboard ppt powerpoint presentation slides rules. This is a two stage process. The stages in this process are percentage, chart, marketing, management.
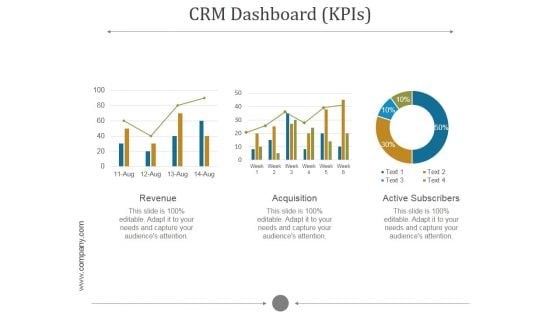
Crm Dashboard Kpis Ppt PowerPoint Presentation Pictures
This is a crm dashboard kpis ppt powerpoint presentation pictures. This is a five stage process. The stages in this process are revenue, acquisition, active subscribers.
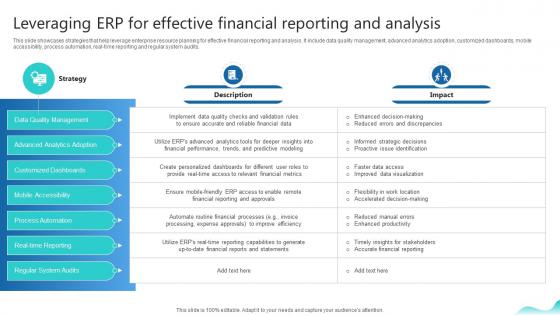
Leveraging Erp For Effective Financial Reporting Erp And Digital Transformation For Maximizing DT SS V
This slide showcases strategies that help leverage enterprise resource planning for effective financial reporting and analysis. It include data quality management, advanced analytics adoption, customized dashboards, mobile accessibility, process automation, real-time reporting and regular system audits.Make sure to capture your audiences attention in your business displays with our gratis customizable Leveraging Erp For Effective Financial Reporting Erp And Digital Transformation For Maximizing DT SS V. These are great for business strategies, office conferences, capital raising or task suggestions. If you desire to acquire more customers for your tech business and ensure they stay satisfied, create your own sales presentation with these plain slides. This slide showcases strategies that help leverage enterprise resource planning for effective financial reporting and analysis. It include data quality management, advanced analytics adoption, customized dashboards, mobile accessibility, process automation, real-time reporting and regular system audits.
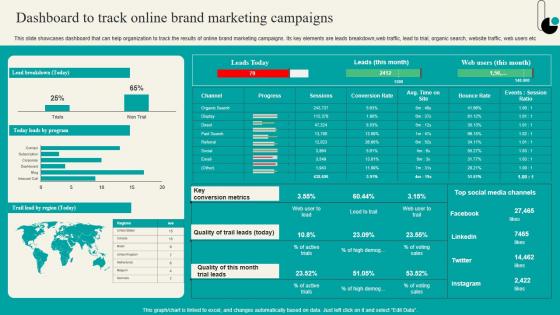
Dashboard To Track Online Brand Marketing Strategic Marketing Plan Themes PDF
This slide showcases dashboard that can help organization to track the results of online brand marketing campaigns. Its key elements are leads breakdown,web traffic, lead to trial, organic search, website traffic, web users etc. If you are looking for a format to display your unique thoughts, then the professionally designed Dashboard To Track Online Brand Marketing Strategic Marketing Plan Themes PDF is the one for you. You can use it as a Google Slides template or a PowerPoint template. Incorporate impressive visuals, symbols, images, and other charts. Modify or reorganize the text boxes as you desire. Experiment with shade schemes and font pairings. Alter, share or cooperate with other people on your work. Download Dashboard To Track Online Brand Marketing Strategic Marketing Plan Themes PDF and find out how to give a successful presentation. Present a perfect display to your team and make your presentation unforgettable. This slide showcases dashboard that can help organization to track the results of online brand marketing campaigns. Its key elements are leads breakdown,web traffic, lead to trial, organic search, website traffic, web users etc.
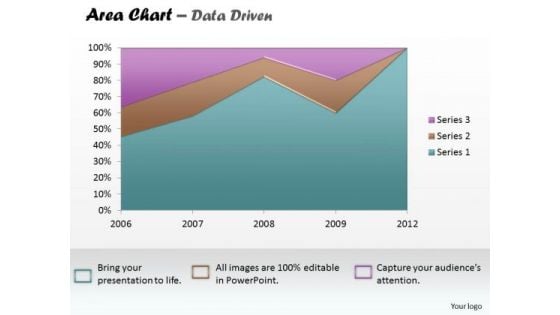
Data Analysis Excel Business Reporting Area Chart PowerPoint Templates
Establish The Dominance Of Your Ideas. Our data analysis excel business reporting area chart Powerpoint Templates Will Put Them On Top.
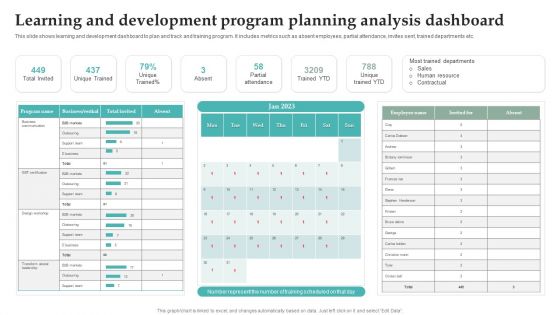
Learning And Development Program Planning Analysis Dashboard Information PDF
This slide shows learning and development dashboard to plan and track and training program. It includes metrics such as absent employees, partial attendance, invites sent, trained departments etc. Showcasing this set of slides titled Learning And Development Program Planning Analysis Dashboard Information PDF. The topics addressed in these templates are Partial Attendance, Trained YTD, Unique Trained YTD. All the content presented in this PPT design is completely editable. Download it and make adjustments in color, background, font etc. as per your unique business setting.
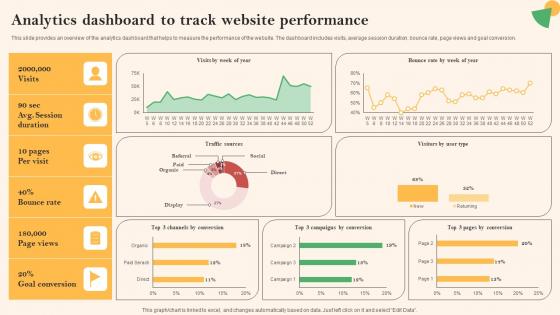
Social Media Marketing To Boost Analytics Dashboard To Track Website Performance Pictures Pdf
This slide provides an overview of the analytics dashboard that helps to measure the performance of the website. The dashboard includes visits, average session duration, bounce rate, page views and goal conversion. Slidegeeks is one of the best resources for PowerPoint templates. You can download easily and regulate Social Media Marketing To Boost Analytics Dashboard To Track Website Performance Pictures Pdf for your personal presentations from our wonderful collection. A few clicks is all it takes to discover and get the most relevant and appropriate templates. Use our Templates to add a unique zing and appeal to your presentation and meetings. All the slides are easy to edit and you can use them even for advertisement purposes. This slide provides an overview of the analytics dashboard that helps to measure the performance of the website. The dashboard includes visits, average session duration, bounce rate, page views and goal conversion.
Outsourced Call Center For Global Reach Icon Ideas Pdf
Pitch your topic with ease and precision using this Outsourced Call Center For Global Reach Icon Ideas Pdf. This layout presents information on Outsourced Call Center, Global Reach Icon. It is also available for immediate download and adjustment. So, changes can be made in the color, design, graphics or any other component to create a unique layout. Our Outsourced Call Center For Global Reach Icon Ideas Pdf are topically designed to provide an attractive backdrop to any subject. Use them to look like a presentation pro.
Outsourced Call Center To Improve Customer Experience Icon Guidelines Pdf
Pitch your topic with ease and precision using this Outsourced Call Center To Improve Customer Experience Icon Guidelines Pdf. This layout presents information on Outsourced Call Center, Customer Experience Icon. It is also available for immediate download and adjustment. So, changes can be made in the color, design, graphics or any other component to create a unique layout. Our Outsourced Call Center To Improve Customer Experience Icon Guidelines Pdf are topically designed to provide an attractive backdrop to any subject. Use them to look like a presentation pro.
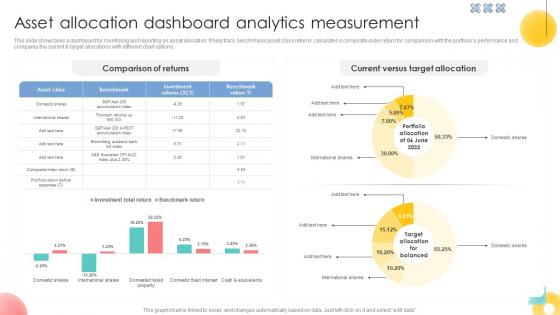
Asset Allocation Dashboard Analytics Measurement Strategic Investment Plan For Optimizing Risk SS V
This slide showcases a dashboard for monitoring and reporting on asset allocation. It help track benchmarks asset class returns, calculates a composite index return for comparison with the portfolios performance and compares the current and target allocations with different chart options.Slidegeeks is one of the best resources for PowerPoint templates. You can download easily and regulate Asset Allocation Dashboard Analytics Measurement Strategic Investment Plan For Optimizing Risk SS V for your personal presentations from our wonderful collection. A few clicks is all it takes to discover and get the most relevant and appropriate templates. Use our Templates to add a unique zing and appeal to your presentation and meetings. All the slides are easy to edit and you can use them even for advertisement purposes. This slide showcases a dashboard for monitoring and reporting on asset allocation. It help track benchmarks asset class returns, calculates a composite index return for comparison with the portfolios performance and compares the current and target allocations with different chart options.
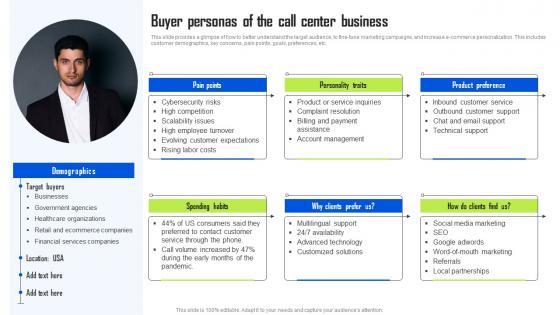
Buyer Personas Of The Call Center Business BPO Center Business Plan Demonstration Pdf
This slide provides a glimpse of how to better understand the target audience, to fine-tune marketing campaigns, and increase e-commerce personalization. This includes customer demographics, key concerns, pain points, goals, preferences, etc. There are so many reasons you need a Buyer Personas Of The Call Center Business BPO Center Business Plan Demonstration Pdf The first reason is you can not spend time making everything from scratch, Thus, Slidegeeks has made presentation templates for you too. You can easily download these templates from our website easily. This slide provides a glimpse of how to better understand the target audience, to fine-tune marketing campaigns, and increase e-commerce personalization. This includes customer demographics, key concerns, pain points, goals, preferences, etc.
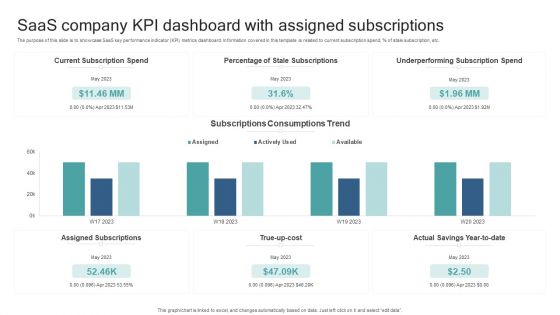
Saas Company KPI Dashboard With Assigned Subscriptions Formats PDF
The purpose of this slide is to showcase SaaS key performance indicator KPI metrics dashboard. Information covered in this template is related to current subscription spend, percent of stale subscription, etc. Pitch your topic with ease and precision using this Saas Company KPI Dashboard With Assigned Subscriptions Formats PDF. This layout presents information on Current Subscription Spend, Percentage Of Stale Subscriptions, True Up Cost, Underperforming Subscription Spend. It is also available for immediate download and adjustment. So, changes can be made in the color, design, graphics or any other component to create a unique layout.
Dashboard For Tracking Viral Posts Across Viral Video Outreach Plan Professional Pdf
This slide showcases dashboard which can help marketers track viral posts across multiple platforms. It provides details about viral views, seed views, direct, searh, referrer, network, Facebook, Twitter, etc. Explore a selection of the finest V here. With a plethora of professionally designed and pre-made slide templates, you can quickly and easily find the right one for your upcoming presentation. You can use our Dashboard For Tracking Viral Posts Across Viral Video Outreach Plan Professional Pdf to effectively convey your message to a wider audience. Slidegeeks has done a lot of research before preparing these presentation templates. The content can be personalized and the slides are highly editable. Grab templates today from Slidegeeks. This slide showcases dashboard which can help marketers track viral posts across multiple platforms. It provides details about viral views, seed views, direct, searh, referrer, network, Facebook, Twitter, etc.
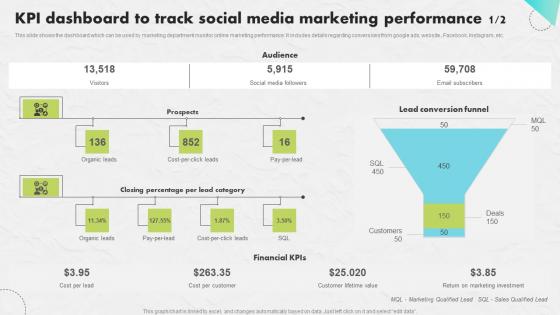
KPI Dashboard Track Social Developing An Impactful SEO Marketing Plan Graphics Pdf
This slide shows the dashboard which can be used by marketing department monitor online marketing performance. It includes details regarding conversions from google ads, website , Facebook, Instagram, etc. If your project calls for a presentation, then Slidegeeks is your go to partner because we have professionally designed, easy to edit templates that are perfect for any presentation. After downloading, you can easily edit KPI Dashboard Track Social Developing An Impactful SEO Marketing Plan Graphics Pdf and make the changes accordingly. You can rearrange slides or fill them with different images. Check out all the handy templates This slide shows the dashboard which can be used by marketing department monitor online marketing performance. It includes details regarding conversions from google ads, website , Facebook, Instagram, etc.
Dashboard Ppt PowerPoint Presentation Icon Example Introduction
This is a dashboard ppt powerpoint presentation icon example introduction. This is a three stage process. The stages in this process are dashboard, business, marketing, strategy, planning.
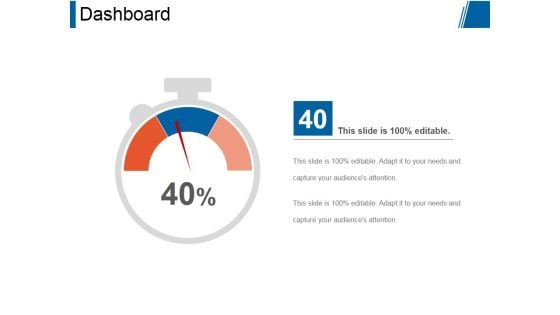
Dashboard Ppt PowerPoint Presentation Infographics Gallery
This is a dashboard ppt powerpoint presentation infographics gallery. This is a three stage process. The stages in this dashboard, planning, business, management, strategy.
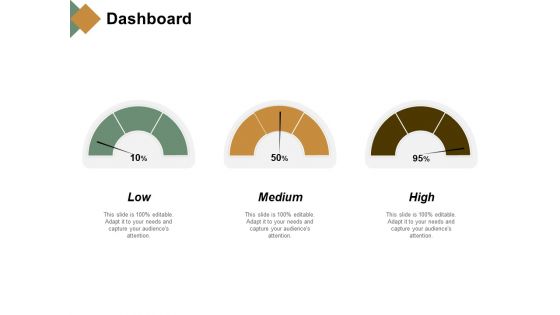
Dashboard Medium Ppt PowerPoint Presentation Gallery Good
This is a dashboard medium ppt powerpoint presentation gallery good. This is a three stage process. The stages in this process are dashboard, business, management, planning, strategy.
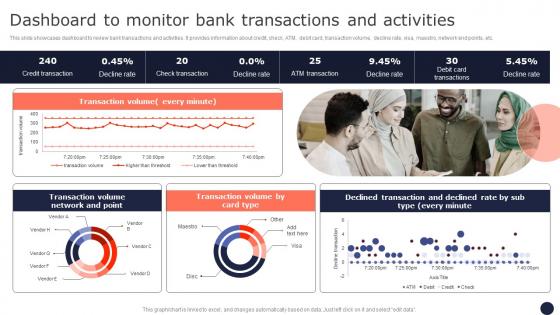
Dashboard To Monitor Bank Transactions Mitigating Corporate Scams And Robberies Pictures Pdf
This slide showcases dashboard to review bank transactions and activities. It provides information about credit, check, ATM, debit card, transaction volume, decline rate, visa, maestro, network end points, etc. Do you have an important presentation coming up Are you looking for something that will make your presentation stand out from the rest Look no further than Dashboard To Monitor Bank Transactions Mitigating Corporate Scams And Robberies Pictures Pdf. With our professional designs, you can trust that your presentation will pop and make delivering it a smooth process. And with Slidegeeks, you can trust that your presentation will be unique and memorable. So why wait Grab Dashboard To Monitor Bank Transactions Mitigating Corporate Scams And Robberies Pictures Pdf today and make your presentation stand out from the rest. This slide showcases dashboard to review bank transactions and activities. It provides information about credit, check, ATM, debit card, transaction volume, decline rate, visa, maestro, network end points, etc.
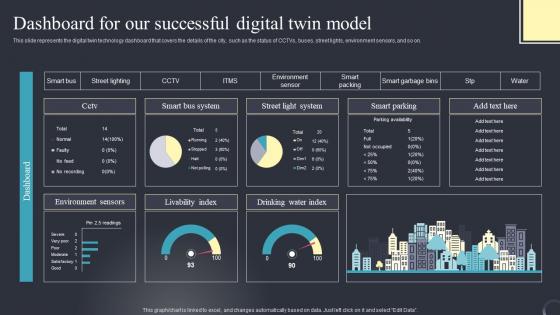
Dashboard For Our Successful Industrial Transformation Using Digital Twin Pictures Pdf
This slide represents the digital twin technology dashboard that covers the details of the city, such as the status of CCTVs, buses, street lights, environment sensors, and so on. Do you have an important presentation coming up Are you looking for something that will make your presentation stand out from the rest Look no further than Dashboard For Our Successful Industrial Transformation Using Digital Twin Pictures Pdf. With our professional designs, you can trust that your presentation will pop and make delivering it a smooth process. And with Slidegeeks, you can trust that your presentation will be unique and memorable. So why wait Grab Dashboard For Our Successful Industrial Transformation Using Digital Twin Pictures Pdf today and make your presentation stand out from the rest This slide represents the digital twin technology dashboard that covers the details of the city, such as the status of CCTVs, buses, street lights, environment sensors, and so on.
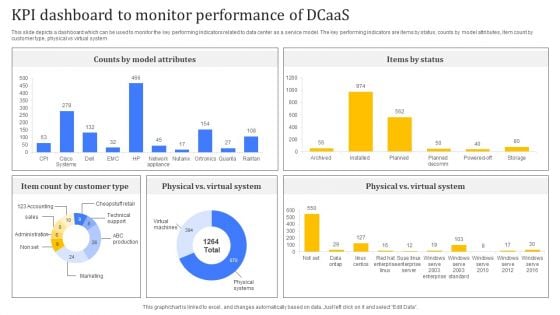
KPI Dashboard To Monitor Performance Of Dcaas Pictures PDF
Following slide highlights major benefits of applying data center as a service to business operations which can be used by businesses looking to modernize their IT infrastructure. Major benefits are in terms of scalability, flexibility, cost effectiveness, and security. Pitch your topic with ease and precision using this KPI Dashboard To Monitor Performance Of Dcaas Pictures PDF. This layout presents information on Customer Type, Counts By Model Attributes, Items By Status. It is also available for immediate download and adjustment. So, changes can be made in the color, design, graphics or any other component to create a unique layout.
Cyber Security Threat Dashboard With KPI Metrics Icons PDF
This slide shows dashboard of cyber threats to organization and metrics and performance indicators for security officer. It covers operational health, audit and compliance, controls health and project status. Showcasing this set of slides titled Cyber Security Threat Dashboard With KPI Metrics Icons PDF. The topics addressed in these templates are Cyber Security Threat Dashboard, Kpi Metrics. All the content presented in this PPT design is completely editable. Download it and make adjustments in color, background, font etc. as per your unique business setting.
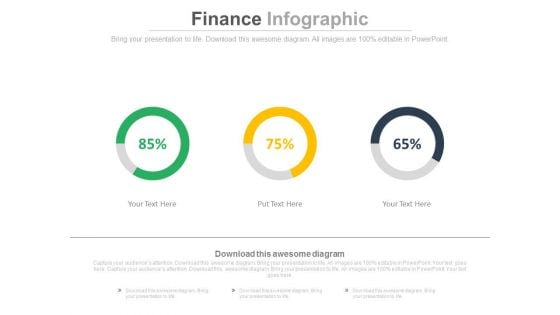
Linear Circles Percentage Analysis Charts Powerpoint Slides
This PowerPoint template has been designed with graphics of three circles and percentage ratios. You may use this dashboard slide design for topics like profit growth and financial planning. This PPT slide is powerful tool to describe your ideas.
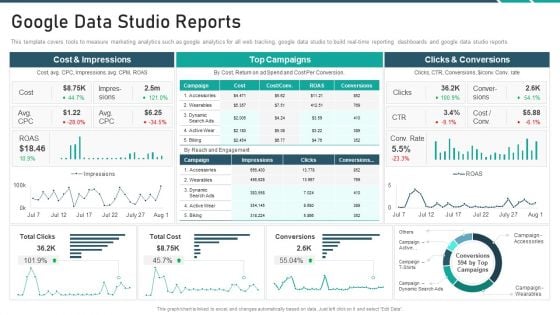
Online Promotion Playbook Google Data Studio Reports Designs PDF
This template covers tools to measure marketing analytics such as google analytics for all web tracking, google data studio to build real-time reporting dashboards and google data studio reports. Deliver an awe inspiring pitch with this creative online promotion playbook google data studio reports designs pdf bundle. Topics like google data studio reports can be discussed with this completely editable template. It is available for immediate download depending on the needs and requirements of the user.


 Continue with Email

 Home
Home


