Daily Snapshot
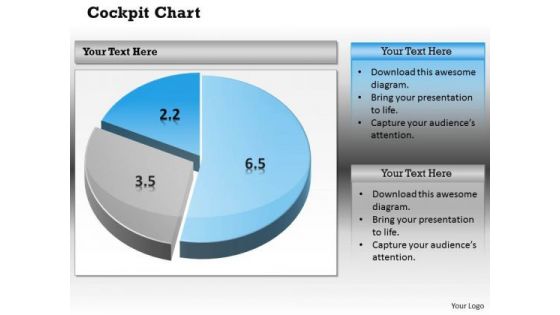
Business Cycle Diagram Pie Chart Dashborad Design Marketing Diagram
Document Your Views On Our Business Cycle Diagram Pie Chart Dashborad Design Marketing Diagram Powerpoint Templates. They Will Create A Strong Impression.
Data Lake Implementation Centralized Repository Data Lake Reporting Dashboard Icons PDF
This slide represents the data lake reporting dashboard by covering the total number of users, total lake size, trusted zone size, conversion rate, and retention. Get a simple yet stunning designed Data Lake Implementation Centralized Repository Data Lake Reporting Dashboard Icons PDF. It is the best one to establish the tone in your meetings. It is an excellent way to make your presentations highly effective. So, download this PPT today from Slidegeeks and see the positive impacts. Our easy-to-edit Data Lake Implementation Centralized Repository Data Lake Reporting Dashboard Icons PDF can be your go-to option for all upcoming conferences and meetings. So, what are you waiting for Grab this template today.
HR Dashboard Indicating Weekly Professional Counselling Kpis Icons PDF
This slide illustrates HR career counselling dashboard. It provides information about hours of consultation, satisfaction rate, per consultant rate, popular counselors, etc. Showcasing this set of slides titled HR Dashboard Indicating Weekly Professional Counselling Kpis Icons PDF. The topics addressed in these templates are Specialization, Hours Of Consultation, Popular Counselors. All the content presented in this PPT design is completely editable. Download it and make adjustments in color, background, font etc. as per your unique business setting.
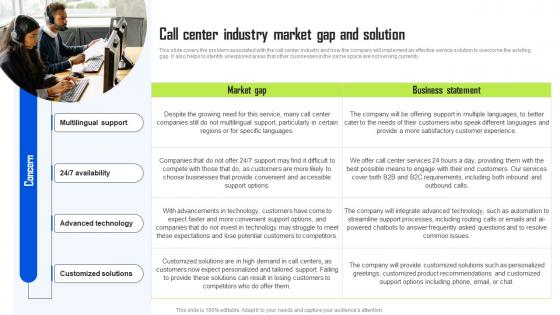
Call Center Industry Market Gap And Solution BPO Center Business Plan Summary Pdf
This slide covers the problem associated with the call center industry and how the company will implement an effective service solution to overcome the existing gap. It also helps to identify unexplored areas that other businesses in the same space are not serving currently. Present like a pro with Call Center Industry Market Gap And Solution BPO Center Business Plan Summary Pdf Create beautiful presentations together with your team, using our easy-to-use presentation slides. Share your ideas in real-time and make changes on the fly by downloading our templates. So whether you are in the office, on the go, or in a remote location, you can stay in sync with your team and present your ideas with confidence. With Slidegeeks presentation got a whole lot easier. Grab these presentations today. This slide covers the problem associated with the call center industry and how the company will implement an effective service solution to overcome the existing gap. It also helps to identify unexplored areas that other businesses in the same space are not serving currently.
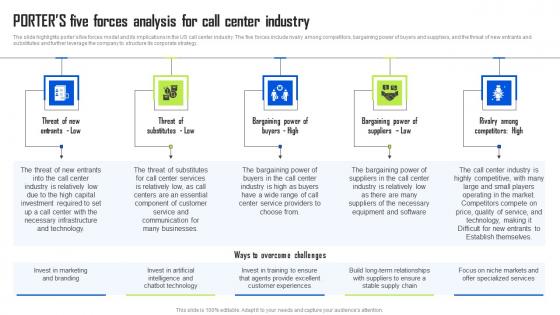
Porters Five Forces Analysis For Call Center Industry BPO Center Business Plan Guidelines Pdf
The slide highlights porters five forces model and its implications in the US call center industry. The five forces include rivalry among competitors, bargaining power of buyers and suppliers, and the threat of new entrants and substitutes and further leverage the company to structure its corporate strategy. The best PPT templates are a great way to save time, energy, and resources. Slidegeeks have 100 percent editable powerpoint slides making them incredibly versatile. With these quality presentation templates, you can create a captivating and memorable presentation by combining visually appealing slides and effectively communicating your message. Download Porters Five Forces Analysis For Call Center Industry BPO Center Business Plan Guidelines Pdf from Slidegeeks and deliver a wonderful presentation. The slide highlights porters five forces model and its implications in the US call center industry. The five forces include rivalry among competitors, bargaining power of buyers and suppliers, and the threat of new entrants and substitutes and further leverage the company to structure its corporate strategy.
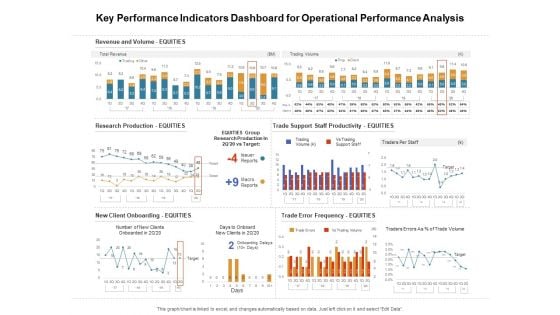
Venture Capitalist Control Board Key Performance Indicators Dashboard For Operational Performance Analysis Formats PDF
Presenting this set of slides with name venture capitalist control board key performance indicators dashboard for operational performance analysis formats pdf. The topics discussed in these slides are revenue and volume, research production, new client onboarding, trade support staff productivity, trade error frequency. This is a completely editable PowerPoint presentation and is available for immediate download. Download now and impress your audience.
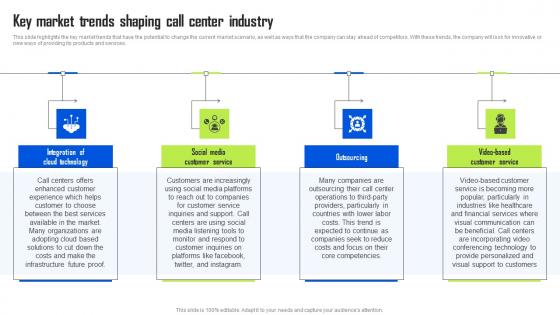
Key Market Trends Shaping Call Center Industry BPO Center Business Plan Clipart Pdf
This slide highlights the key market trends that have the potential to change the current market scenario, as well as ways that the company can stay ahead of competitors. With these trends, the company will look for innovative or new ways of providing its products and services. This Key Market Trends Shaping Call Center Industry BPO Center Business Plan Clipart Pdf is perfect for any presentation, be it in front of clients or colleagues. It is a versatile and stylish solution for organizing your meetings. The Key Market Trends Shaping Call Center Industry BPO Center Business Plan Clipart Pdf features a modern design for your presentation meetings. The adjustable and customizable slides provide unlimited possibilities for acing up your presentation. Slidegeeks has done all the homework before launching the product for you. So, do not wait, grab the presentation templates today This slide highlights the key market trends that have the potential to change the current market scenario, as well as ways that the company can stay ahead of competitors. With these trends, the company will look for innovative or new ways of providing its products and services.
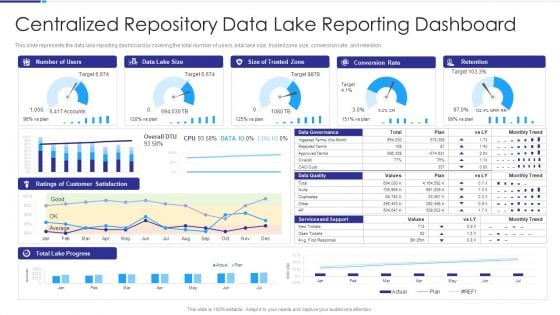
Data Lake Architecture Centralized Repository Data Lake Reporting Dashboard Introduction PDF
This slide represents the data lake reporting dashboard by covering the total number of users, total lake size, trusted zone size, conversion rate, and retention. Deliver an awe inspiring pitch with this creative Data Lake Architecture Centralized Repository Data Lake Reporting Dashboard Introduction PDF bundle. Topics like Data Lake Size, Conversion Rate, Retention, Ratings Customer Satisfaction can be discussed with this completely editable template. It is available for immediate download depending on the needs and requirements of the user.
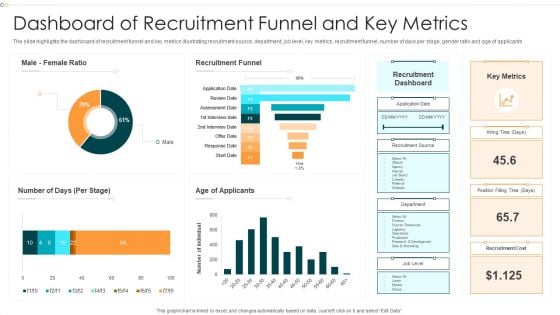
Dashboard Of Recruitment Funnel And Key Metrics Information PDF
The slide highlights the dashboard of recruitment funnel and key metrics illustrating recruitment source, department, job level, key metrics, recruitment funnel, number of days per stage, gender ratio and age of applicants.Pitch your topic with ease and precision using this Dashboard Of Recruitment Funnel And Key Metrics Information PDF This layout presents information on Recruitment Funnel, Recruitment Dashboard, Recruitment Cost It is also available for immediate download and adjustment. So, changes can be made in the color, design, graphics or any other component to create a unique layout.
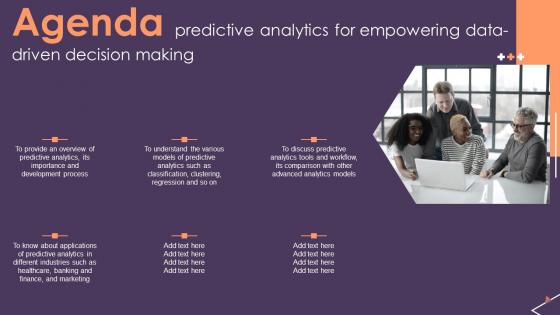
Agenda Predictive Analytics For Empowering Data Driven Decision Making Infographics Pdf
Make sure to capture your audiences attention in your business displays with our gratis customizable Agenda Predictive Analytics For Empowering Data Driven Decision Making Infographics Pdf These are great for business strategies, office conferences, capital raising or task suggestions. If you desire to acquire more customers for your tech business and ensure they stay satisfied, create your own sales presentation with these plain slides. Our Agenda Predictive Analytics For Empowering Data Driven Decision Making Infographics Pdf are topically designed to provide an attractive backdrop to any subject. Use them to look like a presentation pro.
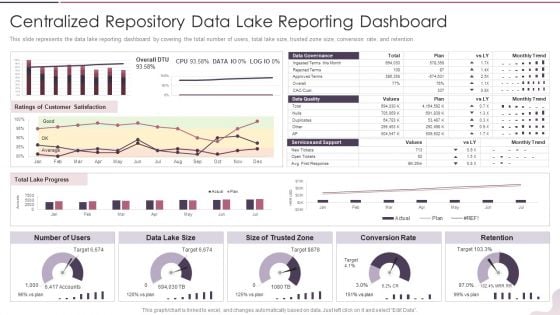
Data Lake Development With Azure Cloud Software Centralized Repository Data Lake Reporting Dashboard Demonstration PDF
This slide represents the data lake reporting dashboard by covering the total number of users, total lake size, trusted zone size, conversion rate, and retention. Deliver an awe inspiring pitch with this creative Data Lake Development With Azure Cloud Software Centralized Repository Data Lake Reporting Dashboard Demonstration PDF bundle. Topics like Conversion Rate, Services And Support can be discussed with this completely editable template. It is available for immediate download depending on the needs and requirements of the user.
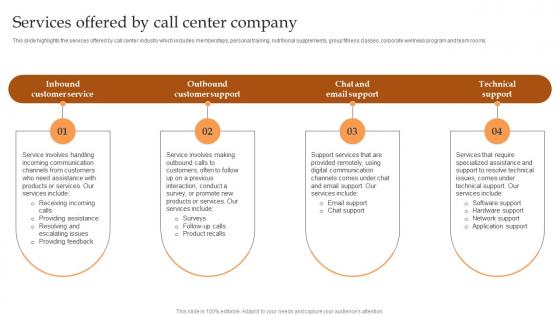
Services Offered By Call Center Company IT And Tech Support Business Introduction Pdf
This slide highlights the services offered by call center industry which includes memberships, personal training, nutritional supplements, group fitness classes, corporate wellness program and team rooms. There are so many reasons you need a Services Offered By Call Center Company IT And Tech Support Business Introduction Pdf The first reason is you can not spend time making everything from scratch, Thus, Slidegeeks has made presentation templates for you too. You can easily download these templates from our website easily. This slide highlights the services offered by call center industry which includes memberships, personal training, nutritional supplements, group fitness classes, corporate wellness program and team rooms.
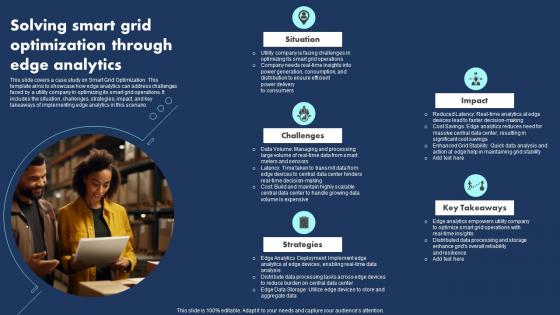
Solving Smart Grid Optimization Through Edge Analytics Pictures Pdf
This slide covers a case study on Smart Grid Optimization. This template aims to showcase how edge analytics can address challenges faced by a utility company in optimizing its smart grid operations. It includes the situation, challenges, strategies, impact, and key takeaways of implementing edge analytics in this scenario.Showcasing this set of slides titled Solving Smart Grid Optimization Through Edge Analytics Pictures Pdf The topics addressed in these templates are Deployment Implement, Distribute Data Processing, Key Takeaways All the content presented in this PPT design is completely editable. Download it and make adjustments in color, background, font etc. as per your unique business setting. This slide covers a case study on Smart Grid Optimization. This template aims to showcase how edge analytics can address challenges faced by a utility company in optimizing its smart grid operations. It includes the situation, challenges, strategies, impact, and key takeaways of implementing edge analytics in this scenario.
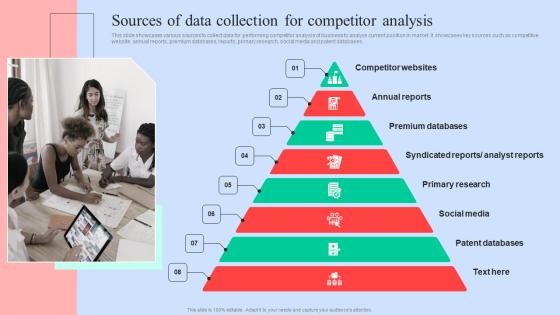
Sources Of Data Collection Executing Competitors Strategies To Assess Organizational Professional Pdf
This slide showcases various sources to collect data for performing competitor analysis of business to analyze current position in market. It showcases key sources such as competitive website, annual reports, premium databases, reports, primary research, social media and patent databases. This Sources Of Data Collection Executing Competitors Strategies To Assess Organizational Professional Pdf from Slidegeeks makes it easy to present information on your topic with precision. It provides customization options, so you can make changes to the colors, design, graphics, or any other component to create a unique layout. It is also available for immediate download, so you can begin using it right away. Slidegeeks has done good research to ensure that you have everything you need to make your presentation stand out. Make a name out there for a brilliant performance. This slide showcases various sources to collect data for performing competitor analysis of business to analyze current position in market. It showcases key sources such as competitive website, annual reports, premium databases, reports, primary research, social media and patent databases.
Banking Operations Performance Tracking Dashboard Incorporating Banking Operational Growth
The purpose of the mentioned slide is to showcase a performance tracking dashboard of banking operations. It includes metrics such as accounts opened and closed, total deposits, referrals by product, etc. Want to ace your presentation in front of a live audience Our Banking Operations Performance Tracking Dashboard Incorporating Banking Operational Growth can help you do that by engaging all the users towards you. Slidegeeks experts have put their efforts and expertise into creating these impeccable powerpoint presentations so that you can communicate your ideas clearly. Moreover, all the templates are customizable, and easy-to-edit and downloadable. Use these for both personal and commercial use. The purpose of the mentioned slide is to showcase a performance tracking dashboard of banking operations. It includes metrics such as accounts opened and closed, total deposits, referrals by product, etc.
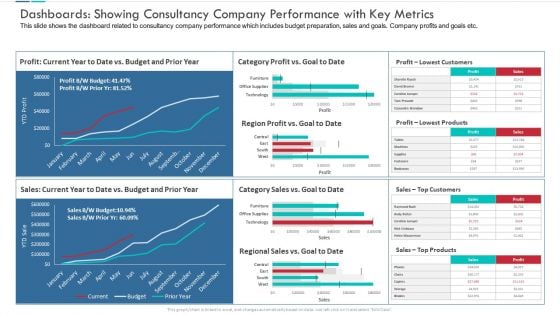
Dashboards Showing Consultancy Company Performance With Key Metrics Microsoft PDF
This slide shows the dashboard related to consultancy company performance which includes budget preparation, sales and goals. Company profits and goals etc.Presenting dashboards showing consultancy company performance with key metrics microsoft pdf to provide visual cues and insights. Share and navigate important information on four stages that need your due attention. This template can be used to pitch topics like dashboards showing consultancy company performance with key metrics. In addtion, this PPT design contains high resolution images, graphics, etc, that are easily editable and available for immediate download.
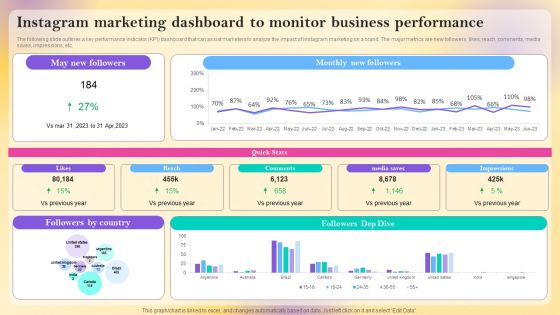
Instagram Marketing Dashboard To Monitor Business Performance Information PDF
The following slide outlines a key performance indicator KPI dashboard that can assist marketers to analyze the impact of Instagram marketing on a brand. The major metrics are new followers, likes, reach, comments, media saves, impressions, etc. This Instagram Marketing Dashboard To Monitor Business Performance Information PDF is perfect for any presentation, be it in front of clients or colleagues. It is a versatile and stylish solution for organizing your meetings. The product features a modern design for your presentation meetings. The adjustable and customizable slides provide unlimited possibilities for acing up your presentation. Slidegeeks has done all the homework before launching the product for you. So, do not wait, grab the presentation templates today

Employee Feedback Dashboard With Key Metrics Elements PDF
The following slide depicts the key insights of the feedback survey to gauge employee engagement at different department levels. It includes metrics such as engagement score, response rate, no. of comments etc.Showcasing this set of slides titled Employee Feedback Dashboard With Key Metrics Elements PDF The topics addressed in these templates are Employee Feedback Dashboard With Key Metrics All the content presented in this PPT design is completely editable. Download it and make adjustments in color, background, font etc. as per your unique business setting.
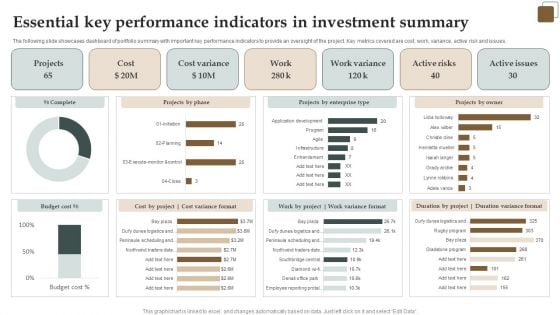
Essential Key Performance Indicators In Investment Summary Demonstration PDF
The following slide showcases dashboard of portfolio summary with important key performance indicators to provide an oversight of the project. Key metrics covered are cost, work, variance, active risk and issues. Showcasing this set of slides titled Essential Key Performance Indicators In Investment Summary Demonstration PDF. The topics addressed in these templates are Cost, Active Risks, Projects. All the content presented in this PPT design is completely editable. Download it and make adjustments in color, background, font etc. as per your unique business setting.

Estimating Business Overall Kpi Metrics Dashboard Highlighting Organization Revenue Clipart PDF
The following slide outlines key performance indicator KPI dashboard showcasing various financial metrics of the organization. The key metrics are gross revenue, product revenue, service revenue, gross profit, net profit etc. Formulating a presentation can take up a lot of effort and time, so the content and message should always be the primary focus. The visuals of the PowerPoint can enhance the presenters message, so our Estimating Business Overall Kpi Metrics Dashboard Highlighting Organization Revenue Clipart PDF was created to help save time. Instead of worrying about the design, the presenter can concentrate on the message while our designers work on creating the ideal templates for whatever situation is needed. Slidegeeks has experts for everything from amazing designs to valuable content, we have put everything into Estimating Business Overall Kpi Metrics Dashboard Highlighting Organization Revenue Clipart PDF.
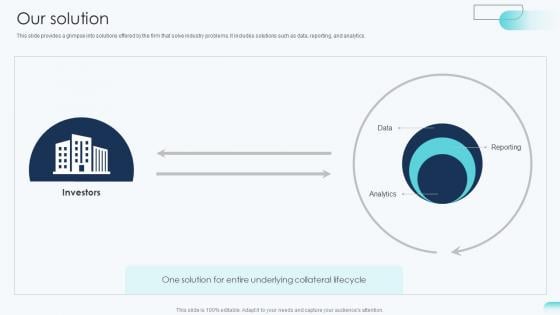
Our Solution Big Data Analytics Investor Funding Elevator Pitch Deck
This slide provides a glimpse into solutions offered by the firm that solve industry problems. It includes solutions such as data, reporting, and analytics. Make sure to capture your audiences attention in your business displays with our gratis customizable Our Solution Big Data Analytics Investor Funding Elevator Pitch Deck. These are great for business strategies, office conferences, capital raising or task suggestions. If you desire to acquire more customers for your tech business and ensure they stay satisfied, create your own sales presentation with these plain slides. This slide provides a glimpse into solutions offered by the firm that solve industry problems. It includes solutions such as data, reporting, and analytics.
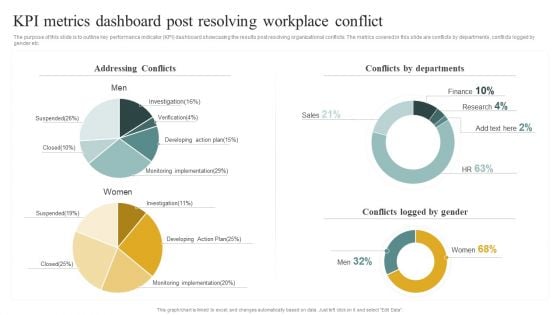
Kpi Metrics Dashboard Post Resolving Workplace Conflict Managing Organizational Conflicts To Boost Pictures PDF
The purpose of this slide is to outline key performance indicator KPI dashboard showcasing the results post resolving organizational conflicts. The metrics covered in this slide are conflicts by departments, conflicts logged by gender etc. Are you in need of a template that can accommodate all of your creative concepts This one is crafted professionally and can be altered to fit any style. Use it with Google Slides or PowerPoint. Include striking photographs, symbols, depictions, and other visuals. Fill, move around, or remove text boxes as desired. Test out color palettes and font mixtures. Edit and save your work, or work with colleagues. Download Kpi Metrics Dashboard Post Resolving Workplace Conflict Managing Organizational Conflicts To Boost Pictures PDF and observe how to make your presentation outstanding. Give an impeccable presentation to your group and make your presentation unforgettable.
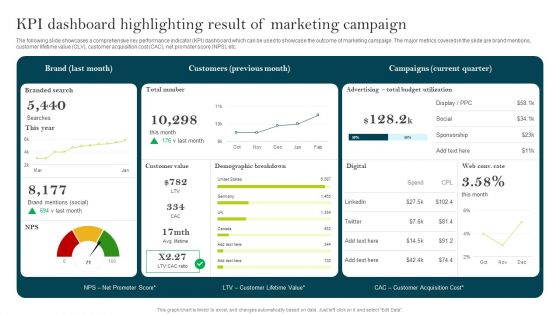
KPI Dashboard Highlighting Result Of Marketing Campaign Ppt PowerPoint Presentation Diagram Lists PDF
The following slide showcases a comprehensive key performance indicator KPI dashboard which can be used to showcase the outcome of marketing campaign. The major metrics covered in the slide are brand mentions, customer lifetime value CLV, customer acquisition cost CAC, net promoter score NPS, etc. Are you in need of a template that can accommodate all of your creative concepts This one is crafted professionally and can be altered to fit any style. Use it with Google Slides or PowerPoint. Include striking photographs, symbols, depictions, and other visuals. Fill, move around, or remove text boxes as desired. Test out color palettes and font mixtures. Edit and save your work, or work with colleagues. Download KPI Dashboard Highlighting Result Of Marketing Campaign Ppt PowerPoint Presentation Diagram Lists PDF and observe how to make your presentation outstanding. Give an impeccable presentation to your group and make your presentation unforgettable.
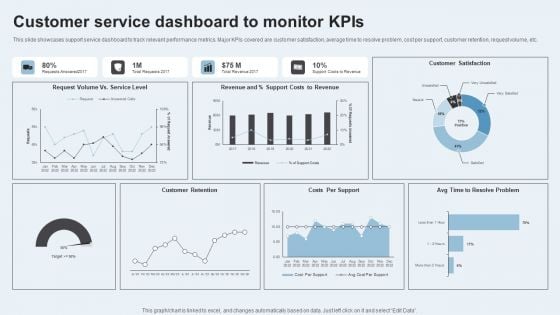
Action Plan To Enhance Client Service Customer Service Dashboard To Monitor Kpis Clipart PDF
This slide showcases support service dashboard to track relevant performance metrics. Major KPIs covered are customer satisfaction, average time to resolve problem, cost per support, customer retention, request volume, etc. Make sure to capture your audiences attention in your business displays with our gratis customizable Action Plan To Enhance Client Service Customer Service Dashboard To Monitor Kpis Clipart PDF. These are great for business strategies, office conferences, capital raising or task suggestions. If you desire to acquire more customers for your tech business and ensure they stay satisfied, create your own sales presentation with these plain slides.
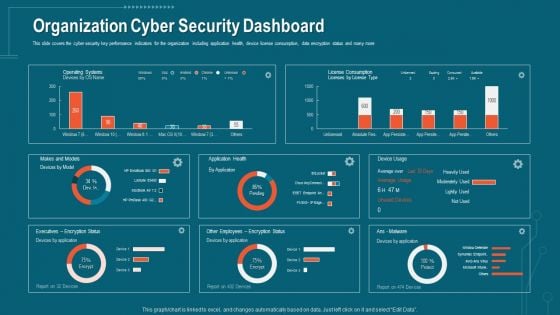
Companys Data Safety Recognition Organization Cyber Security Dashboard Pictures PDF
This slide covers the cyber security key performance indicators for the organization including application health, device license consumption, data encryption status and many more. Deliver an awe-inspiring pitch with this creative companys data safety recognition organization cyber security dashboard pictures pdf bundle. Topics like application health, operating systems, encryption status can be discussed with this completely editable template. It is available for immediate download depending on the needs and requirements of the user.
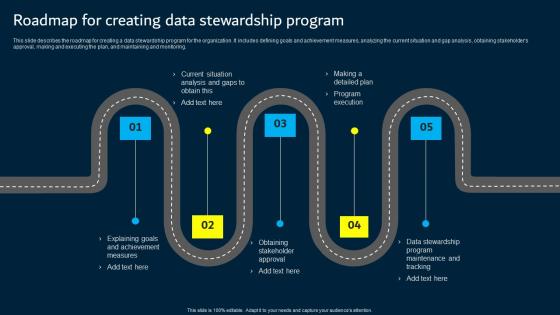
Roadmap For Creating Data Stewardship Program Data Custodianship Introduction Pdf
This slide describes the roadmap for creating a data stewardship program for the organization. It includes defining goals and achievement measures, analyzing the current situation and gap analysis, obtaining stakeholder s approval, making and executing the plan, and maintaining and monitoring. Are you searching for a Roadmap For Creating Data Stewardship Program Data Custodianship Introduction Pdf that is uncluttered, straightforward, and original Its easy to edit, and you can change the colors to suit your personal or business branding. For a presentation that expresses how much effort you have put in, this template is ideal With all of its features, including tables, diagrams, statistics, and lists, its perfect for a business plan presentation. Make your ideas more appealing with these professional slides. Download Roadmap For Creating Data Stewardship Program Data Custodianship Introduction Pdf from Slidegeeks today. This slide describes the roadmap for creating a data stewardship program for the organization. It includes defining goals and achievement measures, analyzing the current situation and gap analysis, obtaining stakeholder s approval, making and executing the plan, and maintaining and monitoring.
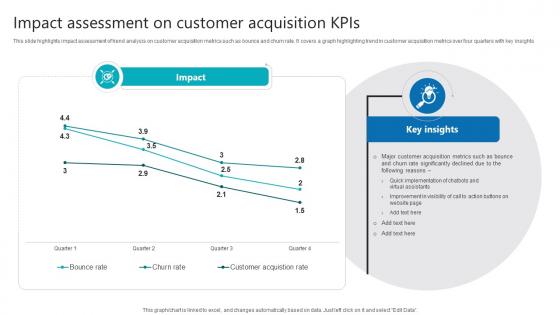
Impact Assessment On Customer Acquisition Kpis Product Analytics Implementation Data Analytics V
This slide highlights impact assessment of trend analysis on customer acquisition metrics such as bounce and churn rate. It covers a graph highlighting trend in customer acquisition metrics over four quarters with key insights The Impact Assessment On Customer Acquisition Kpis Product Analytics Implementation Data Analytics V is a compilation of the most recent design trends as a series of slides. It is suitable for any subject or industry presentation, containing attractive visuals and photo spots for businesses to clearly express their messages. This template contains a variety of slides for the user to input data, such as structures to contrast two elements, bullet points, and slides for written information. Slidegeeks is prepared to create an impression. This slide highlights impact assessment of trend analysis on customer acquisition metrics such as bounce and churn rate. It covers a graph highlighting trend in customer acquisition metrics over four quarters with key insights
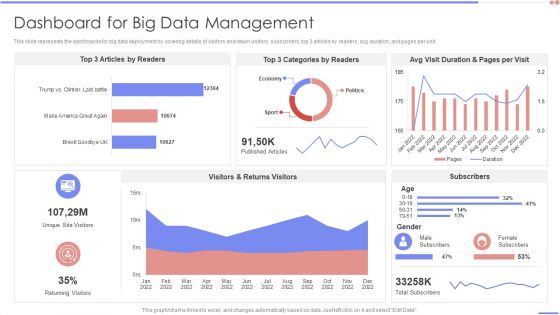
Data Analytics Management Dashboard For Big Data Management Background PDF
This slide represents the dashboards for big data deployment by covering details of visitors and return visitors, subscribers, top 3 articles by readers, avg duration, and pages per visit. Deliver and pitch your topic in the best possible manner with this Data Analytics Management Dashboard For Big Data Management Background PDF. Use them to share invaluable insights on Article Readers, Categories Readers, Duration Pages and impress your audience. This template can be altered and modified as per your expectations. So, grab it now.
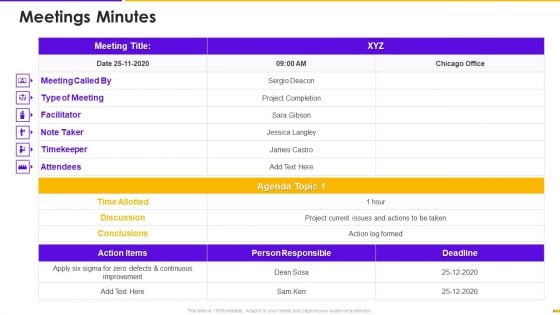
Program Management Timetable Bundle Meetings Minutes Ppt Pictures Format PDF
Deliver an awe inspiring pitch with this creative program management timetable bundle meetings minutes ppt pictures format pdf bundle. Topics like meetings minutes can be discussed with this completely editable template. It is available for immediate download depending on the needs and requirements of the user.
Dashboards Key Metrics Of Performance Assessment Icons PDF
Deliver an awe-inspiring pitch with this creative dashboards key metrics of performance assessment icons pdf bundle. Topics like availability, performance, maintenance, delivery adherence, customer complaints can be discussed with this completely editable template. It is available for immediate download depending on the needs and requirements of the user.
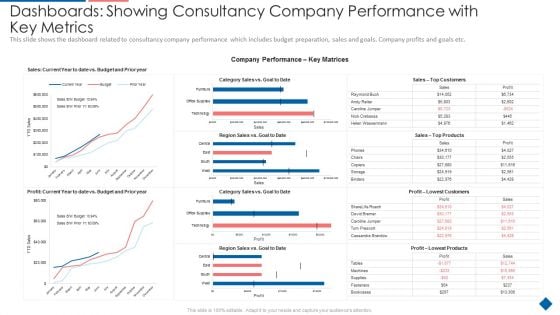
Dashboards Showing Consultancy Company Performance With Key Metrics Mockup PDF
Deliver and pitch your topic in the best possible manner with this dashboards showing consultancy company performance with key metrics mockup pdf. Use them to share invaluable insights on customers, top products, lowest customers, and impress your audience. This template can be altered and modified as per your expectations. So, grab it now.
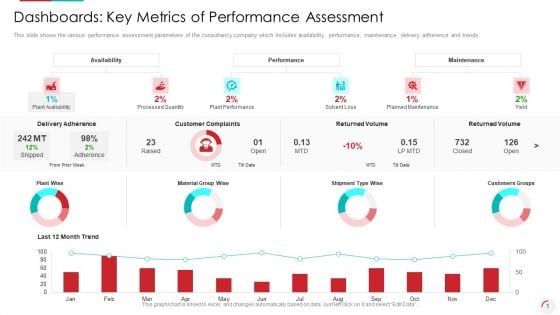
Dashboards Key Metrics Of Performance Assessment Summary PDF
Deliver and pitch your topic in the best possible manner with this dashboards key metrics of performance assessment summary pdf. Use them to share invaluable insights on delivery adherence, customer complaints, returned volume and impress your audience. This template can be altered and modified as per your expectations. So, grab it now.
Transformation KPI Dashboard With Key Metrics And Status Icons PDF
Pitch your topic with ease and precision using this Transformation KPI Dashboard With Key Metrics And Status Icons PDF. This layout presents information on Measure, System Implemented, Innovation. It is also available for immediate download and adjustment. So, changes can be made in the color, design, graphics or any other component to create a unique layout.
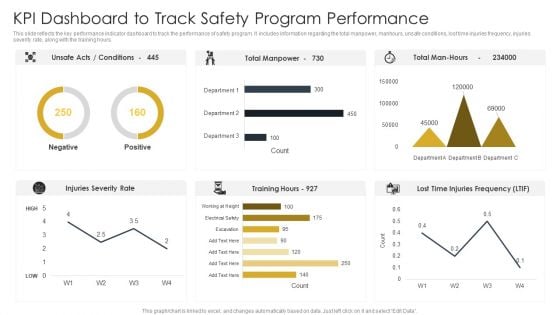
Kpi Dashboard To Track Safety Program Performance Construction Site Safety Plan Summary PDF
This slide reflects the key performance indicator dashboard to track the performance of safety program. It includes information regarding the total manpower, manhours, unsafe conditions, lost time injuries frequency, injuries severity rate, along with the training hours. The Kpi Dashboard To Track Safety Program Performance Construction Site Safety Plan Summary PDF is a compilation of the most recent design trends as a series of slides. It is suitable for any subject or industry presentation, containing attractive visuals and photo spots for businesses to clearly express their messages. This template contains a variety of slides for the user to input data, such as structures to contrast two elements, bullet points, and slides for written information. Slidegeeks is prepared to create an impression.
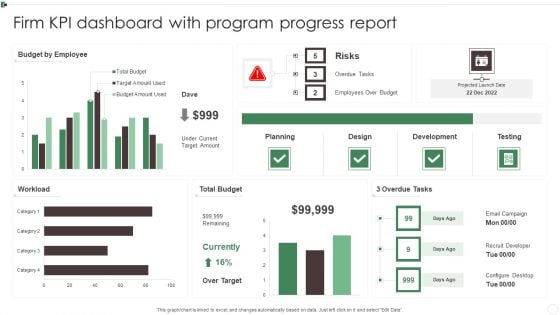
Firm KPI Dashboard With Program Progress Report Ppt Pictures Deck PDF
This graph or chart is linked to excel, and changes automatically based on data. Just left click on it and select Edit Data. Showcasing this set of slides titled Firm KPI Dashboard With Program Progress Report Ppt Pictures Deck PDF. The topics addressed in these templates are Budget By Employee, Total Budget, 3 Overdue Tasks, Workload. All the content presented in this PPT design is completely editable. Download it and make adjustments in color, background, font etc. as per your unique business setting.
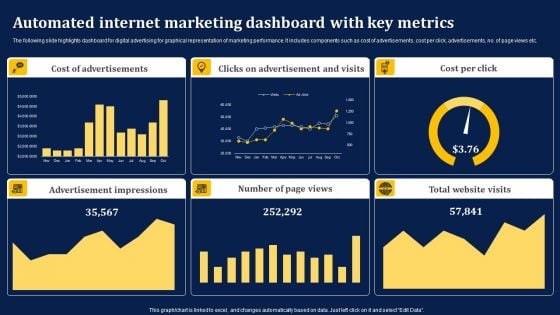
Automated Internet Marketing Dashboard With Key Metrics Information PDF
The following slide highlights dashboard for digital advertising for graphical representation of marketing performance. It includes components such as cost of advertisements, cost per click, advertisements, no. of page views etc. Showcasing this set of slides titled Automated Internet Marketing Dashboard With Key Metrics Information PDF. The topics addressed in these templates are Cost Advertisements, Clicks Advertisement, Cost Per Click. All the content presented in this PPT design is completely editable. Download it and make adjustments in color, background, font etc. as per your unique business setting.
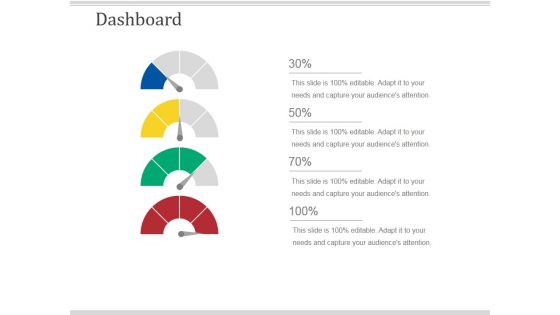
Dashboard Ppt PowerPoint Presentation Pictures Design Ideas
This is a dashboard ppt powerpoint presentation pictures design ideas. This is a four stage process. The stages in this process are dashboard, process, business, marketing, management.
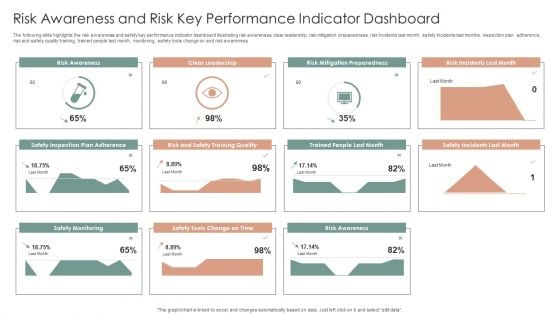
Risk Awareness And Risk Key Performance Indicator Dashboard Ppt Inspiration Ideas PDF
The following slide highlights the risk awareness and safety key performance indicator dashboard illustrating risk awareness, clear leadership, risk mitigation preparedness, risk incidents last month, safety incidents last months, inspection plan adherence, risk and safety quality training, trained people last month, monitoring, safety tools change on and risk awareness. Showcasing this set of slides titled Risk Awareness And Risk Key Performance Indicator Dashboard Ppt Inspiration Ideas PDF. The topics addressed in these templates are Safety Incident Avoided, Safety Incidents, Safety Incident, Accumulated Total. All the content presented in this PPT design is completely editable. Download it and make adjustments in color, background, font etc. as per your unique business setting.
Marketers Guide To Data Analysis Optimization KPI Dashboard For Tracking SEO Analytics Template PDF
This slide covers the KPI dashboard for analyzing SEO metrics such as authority score, organic traffic, organic keywords, paid keywords, ref. Domains, site audit, link-building tool, organic traffic, on-page SEO checker, backlink audit, etc. This Marketers Guide To Data Analysis Optimization KPI Dashboard For Tracking SEO Analytics Template PDF from Slidegeeks makes it easy to present information on your topic with precision. It provides customization options, so you can make changes to the colors, design, graphics, or any other component to create a unique layout. It is also available for immediate download, so you can begin using it right away. Slidegeeks has done good research to ensure that you have everything you need to make your presentation stand out. Make a name out there for a brilliant performance.
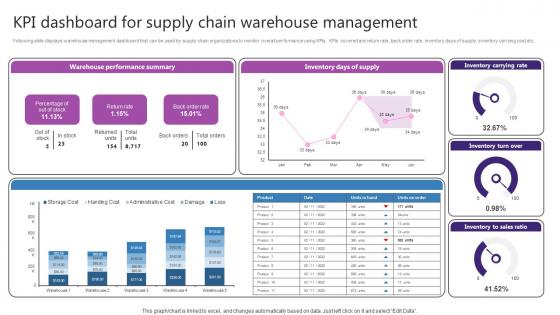
KPI Dashboard For Supply Chain Warehouse Strategic Plan For Enhancing Brochure Pdf
Following slide displays warehouse management dashboard that can be used by supply chain organizations to monitor overall performance using KPIs. KPIs covered are return rate, back order rate, inventory days of supply, inventory carrying cost etc. Slidegeeks has constructed KPI Dashboard For Supply Chain Warehouse Strategic Plan For Enhancing Brochure Pdf after conducting extensive research and examination. These presentation templates are constantly being generated and modified based on user preferences and critiques from editors. Here, you will find the most attractive templates for a range of purposes while taking into account ratings and remarks from users regarding the content. This is an excellent jumping-off point to explore our content and will give new users an insight into our top-notch PowerPoint Templates. Following slide displays warehouse management dashboard that can be used by supply chain organizations to monitor overall performance using KPIs. KPIs covered are return rate, back order rate, inventory days of supply, inventory carrying cost etc.
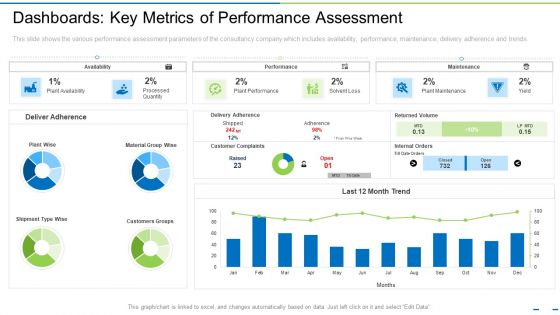
Dashboards Key Metrics Of Performance Assessment Ppt Model Skills PDF
This slide shows the various performance assessment parameters of the consultancy company which includes availability, performance, maintenance, delivery adherence and trends. Deliver and pitch your topic in the best possible manner with this dashboards key metrics of performance assessment ppt model skills pdf. Use them to share invaluable insights on customers groups, performance, customer complaints and impress your audience. This template can be altered and modified as per your expectations. So, grab it now.
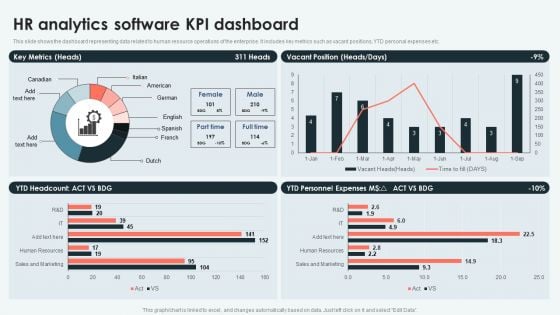
Analyzing And Deploying HR Analytics Software Kpi Dashboard Information PDF
This slide shows the dashboard representing data related to human resource operations of the enterprise. It includes key metrics such as vacant positions, YTD personal expenses etc. There are so many reasons you need a Analyzing And Deploying HR Analytics Software Kpi Dashboard Information PDF. The first reason is you cant spend time making everything from scratch, Thus, Slidegeeks has made presentation templates for you too. You can easily download these templates from our website easily.
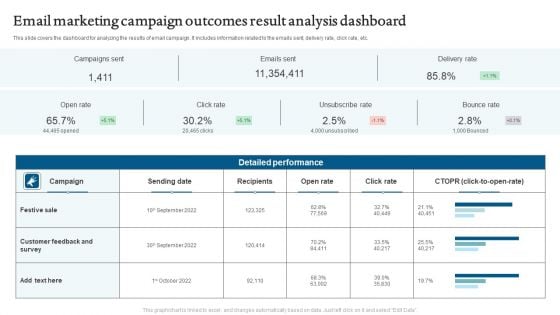
Email Marketing Campaign Outcomes Result Analysis Dashboard Mockup PDF
This slide covers the dashboard for analyzing the email campaign metrics. It includes information related to engagement a key performance indicator KPIs. Pitch your topic with ease and precision using this Email Marketing Campaign Outcomes Result Analysis Dashboard Mockup PDF. This layout presents information on Campaigns Sent, Emails Sent, Delivery Rate. It is also available for immediate download and adjustment. So, changes can be made in the color, design, graphics or any other component to create a unique layout.
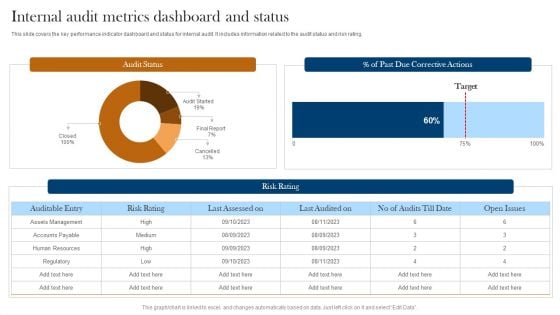
Internal Audit Metrics Dashboard And Status Ppt Layouts Graphic Images PDF
This slide covers the key performance indicator dashboard and status for internal audit. It includes information related to the audit status and risk rating. Pitch your topic with ease and precision using this Internal Audit Metrics Dashboard And Status Ppt Layouts Graphic Images PDF. This layout presents information on Audit Status, Risk Rating, Auditable Entry. It is also available for immediate download and adjustment. So, changes can be made in the color, design, graphics or any other component to create a unique layout.
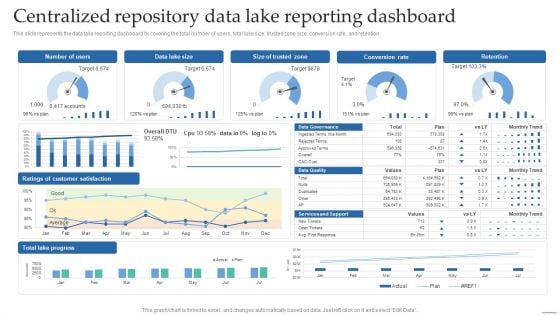
Centralized Repository Data Lake Reporting Dashboard Data Lake Creation With Hadoop Cluster Download PDF
This slide represents the data lake reporting dashboard by covering the total number of users, total lake size, trusted zone size, conversion rate, and retention.This Centralized Repository Data Lake Reporting Dashboard Data Lake Creation With Hadoop Cluster Download PDF from Slidegeeks makes it easy to present information on your topic with precision. It provides customization options, so you can make changes to the colors, design, graphics, or any other component to create a unique layout. It is also available for immediate download, so you can begin using it right away. Slidegeeks has done good research to ensure that you have everything you need to make your presentation stand out. Make a name out there for a brilliant performance.
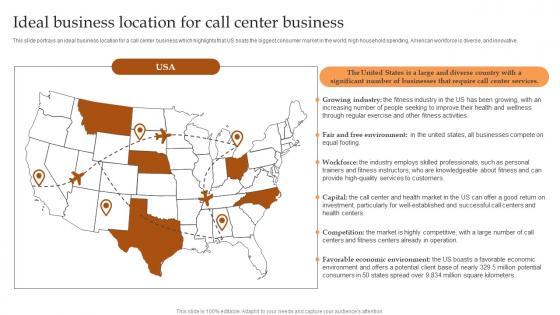
Ideal Business Location For Call Center Business IT And Tech Support Business Slides Pdf
This slide portrays an ideal business location for a call center business which highlights that US boats the biggest consumer market in the world, high household spending, American workforce is diverse, and innovative. The Ideal Business Location For Call Center Business IT And Tech Support Business Slides Pdf is a compilation of the most recent design trends as a series of slides. It is suitable for any subject or industry presentation, containing attractive visuals and photo spots for businesses to clearly express their messages. This template contains a variety of slides for the user to input data, such as structures to contrast two elements, bullet points, and slides for written information. Slidegeeks is prepared to create an impression. This slide portrays an ideal business location for a call center business which highlights that US boats the biggest consumer market in the world, high household spending, American workforce is diverse, and innovative.

Security KPI Dashboard With Various Key Performance Indicators Ppt Portfolio Objects PDF
Showcasing this set of slides titled Security KPI Dashboard With Various Key Performance Indicators Ppt Portfolio Objects PDF. The topics addressed in these templates are Security Kpi Dashboard, Performance Indicators, Analyst Assigned. All the content presented in this PPT design is completely editable. Download it and make adjustments in color, background, font etc. as per your unique business setting.
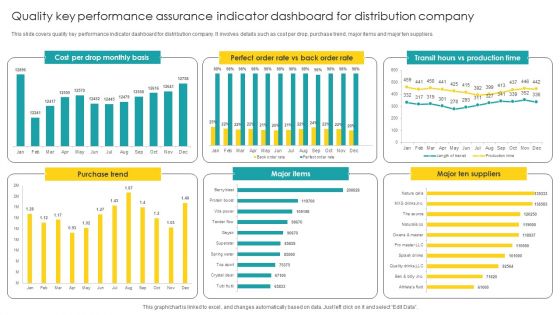
Quality Key Performance Assurance Indicator Dashboard For Distribution Company Mockup PDF
Showcasing this set of slides titled Quality Key Performance Assurance Indicator Dashboard For Distribution Company Mockup PDF. The topics addressed in these templates are Performance Assurance, Indicator Dashboard, Distribution Company. All the content presented in this PPT design is completely editable. Download it and make adjustments in color, background, font etc. as per your unique business setting.
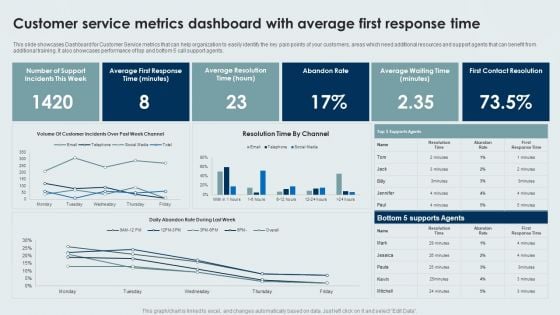
Customer Service Metrics Dashboard With Average First Response Time Background PDF
This slide showcases Dashboard for Customer Service metrics that can help organization to easily identify the key pain points of your customers, areas which need additional resources and support agents that can benefit from additional training. It also showcases performance of top and bottom 5 call support agents. Pitch your topic with ease and precision using this Customer Service Metrics Dashboard With Average First Response Time Background PDF. This layout presents information on Average, Abandon Rate, Contact Resolution. It is also available for immediate download and adjustment. So, changes can be made in the color, design, graphics or any other component to create a unique layout.
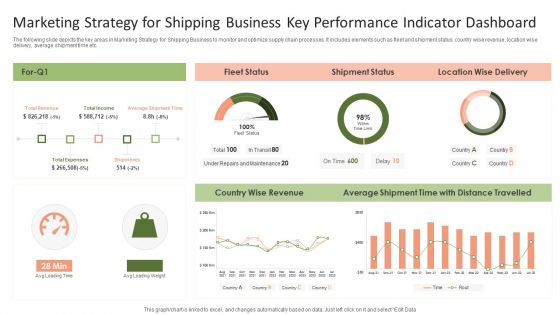
Marketing Strategy For Shipping Business Key Performance Indicator Dashboard Graphics PDF
The following slide depicts the key areas in Marketing Strategy for Shipping Business to monitor and optimize supply chain processes. It includes elements such as fleet and shipment status, country wise revenue, location wise delivery, average shipment time etc.Pitch your topic with ease and precision using this Marketing Strategy For Shipping Business Key Performance Indicator Dashboard Graphics PDF. This layout presents information on Shipment Status, Average Shipment, Wise Revenue. It is also available for immediate download and adjustment. So, changes can be made in the color, design, graphics or any other component to create a unique layout.
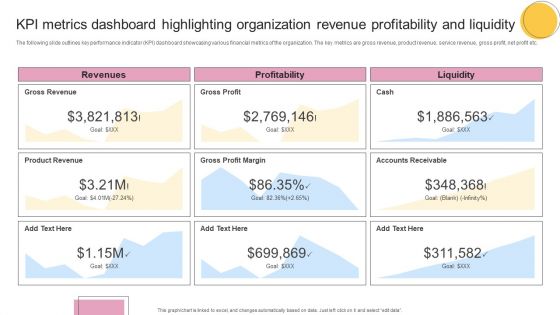
KPI Metrics Dashboard Highlighting Organization Revenue Profitability And Liquidity Formats PDF
The following slide outlines key performance indicator KPI dashboard showcasing various financial metrics of the organization. The key metrics are gross revenue, product revenue, service revenue, gross profit, net profit etc. From laying roadmaps to briefing everything in detail, our templates are perfect for you. You can set the stage with your presentation slides. All you have to do is download these easy to edit and customizable templates. KPI Metrics Dashboard Highlighting Organization Revenue Profitability And Liquidity Formats PDF will help you deliver an outstanding performance that everyone would remember and praise you for. Do download this presentation today.
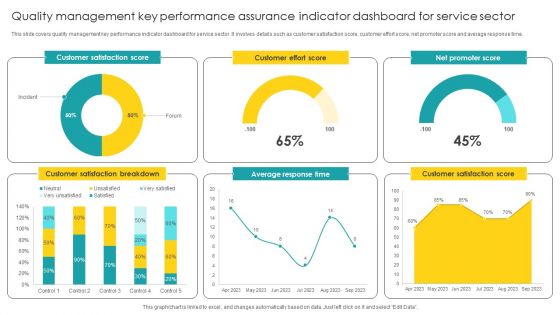
Quality Management Key Performance Assurance Indicator Dashboard For Service Sector Designs PDF
Showcasing this set of slides titled Quality Management Key Performance Assurance Indicator Dashboard For Service Sector Designs PDF. The topics addressed in these templates are Assurance Indicator, Dashboard For Service Sector. All the content presented in this PPT design is completely editable. Download it and make adjustments in color, background, font etc. as per your unique business setting.
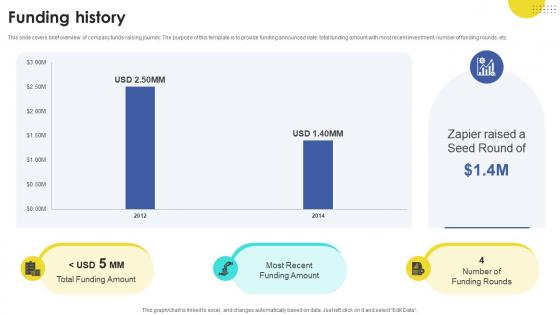
Funding History Task Automation Company Investor Funding Elevator Pitch Deck
This slide covers brief overview of company funds raising journey. The purpose of this template is to provide funding announced date, total funding amount with most recent investment, number of funding rounds, etc. Slidegeeks is here to make your presentations a breeze with Funding History Task Automation Company Investor Funding Elevator Pitch Deck With our easy-to-use and customizable templates, you can focus on delivering your ideas rather than worrying about formatting. With a variety of designs to choose from, you are sure to find one that suits your needs. And with animations and unique photos, illustrations, and fonts, you can make your presentation pop. So whether you are giving a sales pitch or presenting to the board, make sure to check out Slidegeeks first This slide covers brief overview of company funds raising journey. The purpose of this template is to provide funding announced date, total funding amount with most recent investment, number of funding rounds, etc.
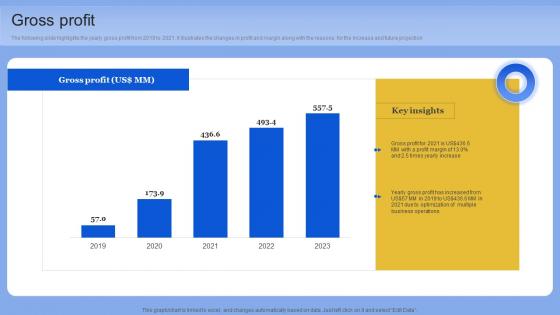
Gross Profit Data Analytics Company Outline Pictures PDF
The following slide highlights the yearly gross profit from 2019 to 2021. it illustrates the changes in profit and margin along with the reasons for the increase and future projection. Formulating a presentation can take up a lot of effort and time, so the content and message should always be the primary focus. The visuals of the PowerPoint can enhance the presenters message, so our Gross Profit Data Analytics Company Outline Pictures PDF was created to help save time. Instead of worrying about the design, the presenter can concentrate on the message while our designers work on creating the ideal templates for whatever situation is needed. Slidegeeks has experts for everything from amazing designs to valuable content, we have put everything into Gross Profit Data Analytics Company Outline Pictures PDF The following slide highlights the yearly gross profit from 2019 to 2021. it illustrates the changes in profit and margin along with the reasons for the increase and future projection
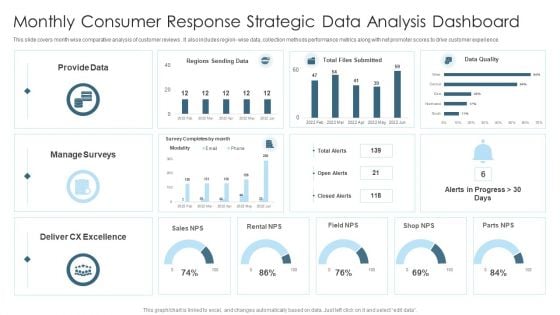
Monthly Consumer Response Strategic Data Analysis Dashboard Graphics PDF
This slide covers month wise comparative analysis of customer reviews . It also includes region wise data, collection methods performance metrics along with net promoter scores to drive customer experience. Showcasing this set of slides titled Monthly Consumer Response Strategic Data Analysis Dashboard Graphics PDF. The topics addressed in these templates are Provide Data, Sales, Manage Surveys. All the content presented in this PPT design is completely editable. Download it and make adjustments in color, background, font etc. as per your unique business setting.
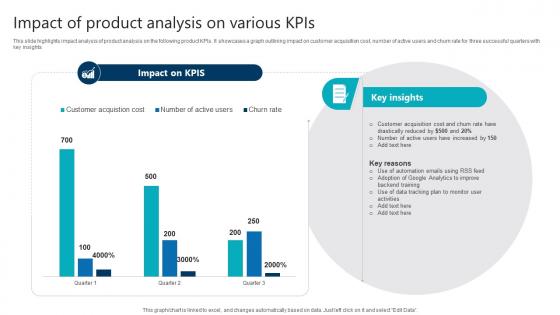
Impact Of Product Analysis On Various Kpis Product Analytics Implementation Data Analytics V
This slide highlights impact analysis of product analysis on the following product KPIs. It showcases a graph outlining impact on customer acquisition cost, number of active users and churn rate for three successful quarters with key insights Are you searching for a Impact Of Product Analysis On Various Kpis Product Analytics Implementation Data Analytics V that is uncluttered, straightforward, and original Its easy to edit, and you can change the colors to suit your personal or business branding. For a presentation that expresses how much effort you have put in, this template is ideal With all of its features, including tables, diagrams, statistics, and lists, its perfect for a business plan presentation. Make your ideas more appealing with these professional slides. Download Impact Of Product Analysis On Various Kpis Product Analytics Implementation Data Analytics V from Slidegeeks today. This slide highlights impact analysis of product analysis on the following product KPIs. It showcases a graph outlining impact on customer acquisition cost, number of active users and churn rate for three successful quarters with key insights
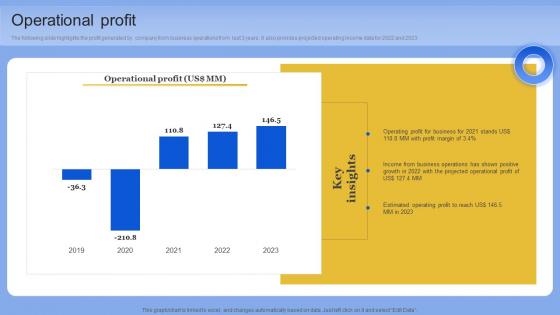
Operational Profit Data Analytics Company Outline Pictures PDF
The following slide highlights the profit generated by company from business operations from last 3 years. It also provides projected operating income data for 2022 and 2023. Slidegeeks has constructed Operational Profit Data Analytics Company Outline Pictures PDF after conducting extensive research and examination. These presentation templates are constantly being generated and modified based on user preferences and critiques from editors. Here, you will find the most attractive templates for a range of purposes while taking into account ratings and remarks from users regarding the content. This is an excellent jumping-off point to explore our content and will give new users an insight into our top-notch PowerPoint Templates. The following slide highlights the profit generated by company from business operations from last 3 years. It also provides projected operating income data for 2022 and 2023
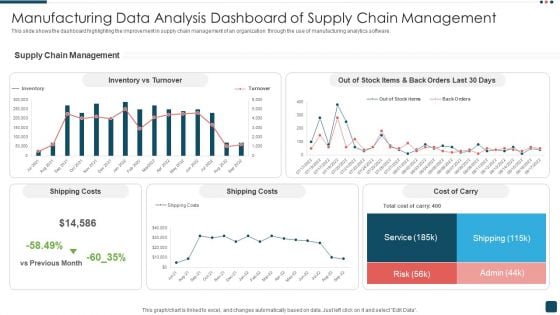
Manufacturing Data Analysis Dashboard Of Supply Chain Management Background PDF
This slide shows the dashboard highlighting the improvement in supply chain management of an organization through the use of manufacturing analytics software. Showcasing this set of slides titled Manufacturing Data Analysis Dashboard Of Supply Chain Management Background PDF. The topics addressed in these templates are Shipping Costs, Service, Risk. All the content presented in this PPT design is completely editable. Download it and make adjustments in color, background, font etc. as per your unique business setting.
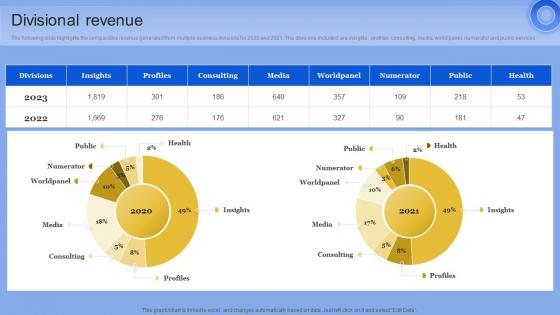
Divisional Revenue Data Analytics Company Outline Pictures PDF
The following slide highlights the comparative revenue generated from multiple business divisions for 2020 and 2021. The divisions included are insights, profiles, consulting, media, world panel, numerator and public services From laying roadmaps to briefing everything in detail, our templates are perfect for you. You can set the stage with your presentation slides. All you have to do is download these easy-to-edit and customizable templates. Divisional Revenue Data Analytics Company Outline Pictures PDF will help you deliver an outstanding performance that everyone would remember and praise you for. Do download this presentation today. The following slide highlights the comparative revenue generated from multiple business divisions for 2020 and 2021. The divisions included are insights, profiles, consulting, media, world panel, numerator and public services
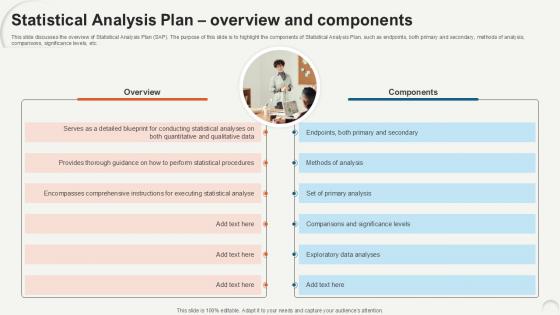
Statistical Analysis Plan Overview Data Analytics For Informed Decision Ppt Template
This slide discusses the overview of Statistical Analysis Plan SAP. The purpose of this slide is to highlight the components of Statistical Analysis Plan, such as endpoints, both primary and secondary, methods of analysis, comparisons, significance levels, etc. Here you can discover an assortment of the finest PowerPoint and Google Slides templates. With these templates, you can create presentations for a variety of purposes while simultaneously providing your audience with an eye-catching visual experience. Download Statistical Analysis Plan Overview Data Analytics For Informed Decision Ppt Template to deliver an impeccable presentation. These templates will make your job of preparing presentations much quicker, yet still, maintain a high level of quality. Slidegeeks has experienced researchers who prepare these templates and write high-quality content for you. Later on, you can personalize the content by editing the Statistical Analysis Plan Overview Data Analytics For Informed Decision Ppt Template. This slide discusses the overview of Statistical Analysis Plan SAP. The purpose of this slide is to highlight the components of Statistical Analysis Plan, such as endpoints, both primary and secondary, methods of analysis, comparisons, significance levels, etc.


 Continue with Email

 Home
Home


