Daily Snapshot
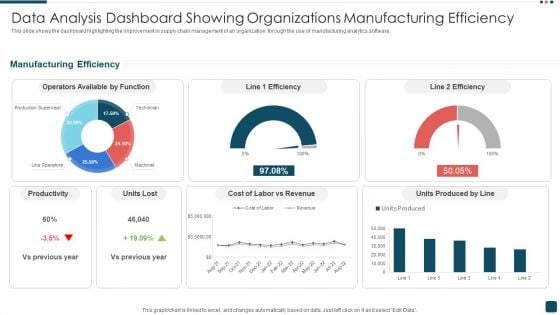
Data Analysis Dashboard Showing Organizations Manufacturing Efficiency Demonstration PDF
This slide shows the dashboard highlighting the improvement in supply chain management of an organization through the use of manufacturing analytics software. Pitch your topic with ease and precision using this Data Analysis Dashboard Showing Organizations Manufacturing Efficiency Demonstration PDF. This layout presents information on Productivity, Revenue, Manufacturing Efficiency. It is also available for immediate download and adjustment. So, changes can be made in the color, design, graphics or any other component to create a unique layout.

Software Application Marketing Data Analytics Report Mockup PDF
This slide shows app marketing analytics dashboard to gauge how well the marketing efforts are performing. It includes parameters like non organic content, organic content attribution,reengegement. Showcasing this set of slides titled Software Application Marketing Data Analytics Report Mockup PDF. The topics addressed in these templates are Software Application, Marketing Data, Analytics Report. All the content presented in this PPT design is completely editable. Download it and make adjustments in color, background, font etc. as per your unique business setting.
Project Management Metrics And Variances Schedule Variance And Test Defect Ppt PowerPoint Presentation Icon Influencers
This is a project management metrics and variances schedule variance and test defect ppt powerpoint presentation icon influencers. This is a five stage process. The stages in this process are project dashboard, project kpis, project metrics.
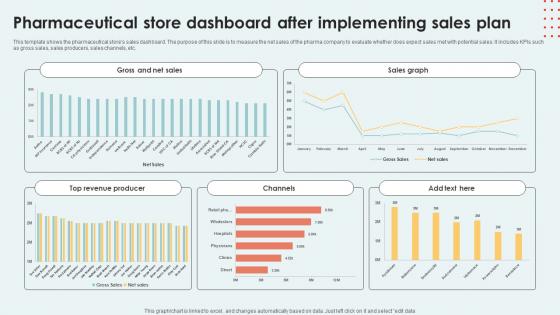
Pharmaceutical Store Dashboard After Implementing Sales Plan Inspiration Pdf
This template shows the pharmaceutical stores sales dashboard. The purpose of this slide is to measure the net sales of the pharma company to evaluate whether does expect sales met with potential sales. It includes KPIs such as gross sales, sales producers, sales channels, etc.Pitch your topic with ease and precision using this Pharmaceutical Store Dashboard After Implementing Sales Plan Inspiration Pdf This layout presents information on Gross Net Sales, Sales Graph, Top Revenue Producer It is also available for immediate download and adjustment. So, changes can be made in the color, design, graphics or any other component to create a unique layout. This template shows the pharmaceutical stores sales dashboard. The purpose of this slide is to measure the net sales of the pharma company to evaluate whether does expect sales met with potential sales. It includes KPIs such as gross sales, sales producers, sales channels, etc.
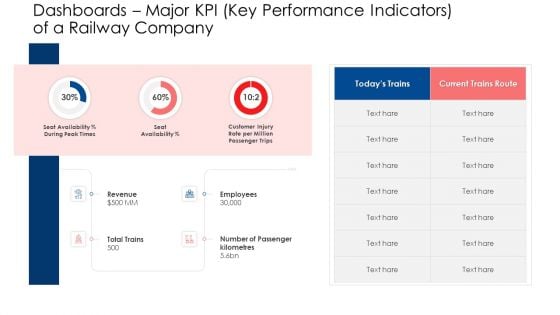
Dashboards Major KPI Key Performance Indicators Of A Railway Company Formats PDF
Deliver an awe inspiring pitch with this creative dashboards major kpi key performance indicators of a railway company formats pdf bundle. Topics like revenue, employees, dashboards can be discussed with this completely editable template. It is available for immediate download depending on the needs and requirements of the user.
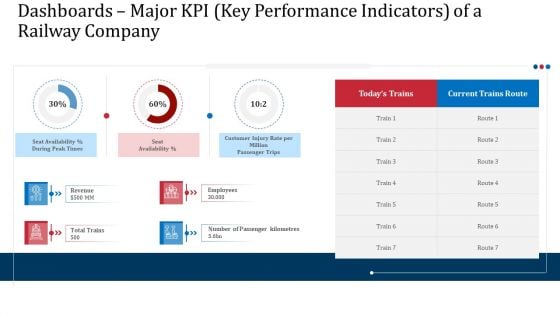
Dashboards Major KPI Key Performance Indicators Of A Railway Company Professional PDF
Deliver an awe inspiring pitch with this creative dashboards major kpi key performance indicators of a railway company professional pdf bundle. Topics like dashboards positive train control ptc implementation by freight and passenger trains can be discussed with this completely editable template. It is available for immediate download depending on the needs and requirements of the user.
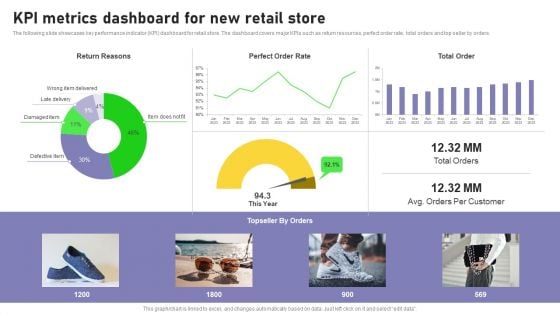
Retail Outlet Opening To Enhance Product Sale Kpi Metrics Dashboard For New Retail Store Mockup PDF
The following slide showcases key performance indicator KPI dashboard for retail store. The dashboard covers major KPIs such as return resources, perfect order rate, total orders and top seller by orders. Do you have to make sure that everyone on your team knows about any specific topic I yes, then you should give Retail Outlet Opening To Enhance Product Sale Kpi Metrics Dashboard For New Retail Store Mockup PDF a try. Our experts have put a lot of knowledge and effort into creating this impeccable Retail Outlet Opening To Enhance Product Sale Kpi Metrics Dashboard For New Retail Store Mockup PDF. You can use this template for your upcoming presentations, as the slides are perfect to represent even the tiniest detail. You can download these templates from the Slidegeeks website and these are easy to edit. So grab these today.

KPI Dashboard To Monitor Facebook Marketing Strategy Performance Demonstration PDF
The following slide outlines key performance indicator KPI dashboard which can be used to evaluate Facebook advertisement performance. The metrics mentioned in slide are total fans, page views, total actions, post likes, audience growth, fans by language, etc. Slidegeeks is here to make your presentations a breeze with KPI Dashboard To Monitor Facebook Marketing Strategy Performance Demonstration PDF With our easy to use and customizable templates, you can focus on delivering your ideas rather than worrying about formatting. With a variety of designs to choose from, you are sure to find one that suits your needs. And with animations and unique photos, illustrations, and fonts, you can make your presentation pop. So whether you are giving a sales pitch or presenting to the board, make sure to check out Slidegeeks first.
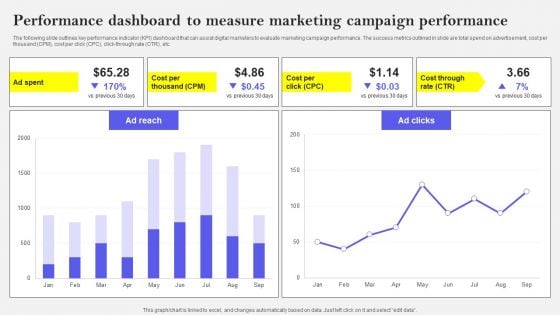
Performance Dashboard To Measure Marketing Campaign Performance Brochure PDF
The following slide outlines key performance indicator KPI dashboard that can assist digital marketers to evaluate marketing campaign performance. The success metrics outlined in slide are total spend on advertisement, cost per thousand CPM, cost per click CPC, click-through rate CTR, etc. Want to ace your presentation in front of a live audience Our Performance Dashboard To Measure Marketing Campaign Performance Brochure PDF can help you do that by engaging all the users towards you.. Slidegeeks experts have put their efforts and expertise into creating these impeccable powerpoint presentations so that you can communicate your ideas clearly. Moreover, all the templates are customizable, and easy-to-edit and downloadable. Use these for both personal and commercial use.
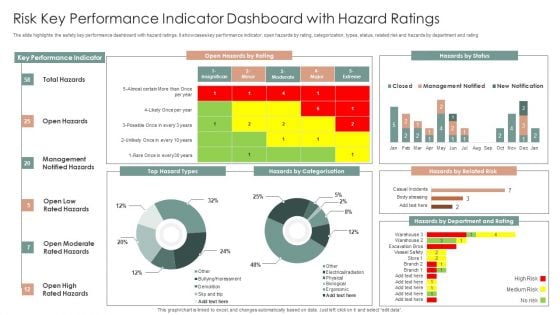
Risk Key Performance Indicator Dashboard With Hazard Ratings Ppt Layouts Slideshow PDF
The slide highlights the safety key performance dashboard with hazard ratings. It showcases key performance indicator, open hazards by rating, categorization, types, status, related risk and hazards by department and rating. Showcasing this set of slides titled Risk Key Performance Indicator Dashboard With Hazard Ratings Ppt Layouts Slideshow PDF. The topics addressed in these templates are Key Performance Indicator, Open Hazards, Hazards By Status. All the content presented in this PPT design is completely editable. Download it and make adjustments in color, background, font etc. as per your unique business setting.
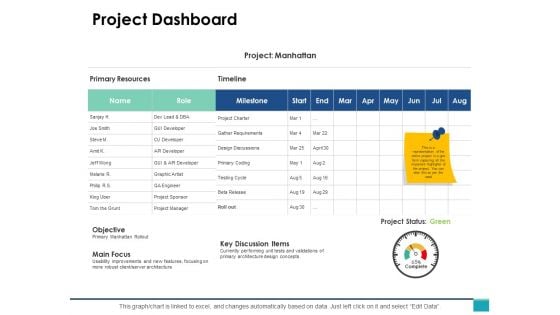
Project Dashboard Ppt PowerPoint Presentation Show Samples
This is a project dashboard ppt powerpoint presentation show samples. The topics discussed in this diagram are business, management, marketing, dashboard. This is a completely editable PowerPoint presentation, and is available for immediate download.
Business Task List On Clip Board Vector Icon Ppt Slides Graphics Pictures PDF
Persuade your audience using this business task list on clip board vector icon ppt slides graphics pictures pdf. This PPT design covers three stages, thus making it a great tool to use. It also caters to a variety of topics including business task list on clip board vector icon. Download this PPT design now to present a convincing pitch that not only emphasizes the topic but also showcases your presentation skills.
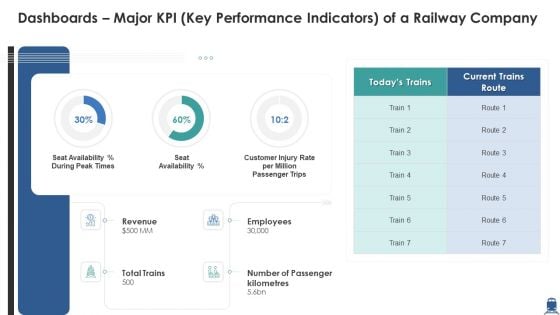
Dashboards Major KPI Key Performance Indicators Of A Railway Company Slides PDF
Deliver and pitch your topic in the best possible manner with this dashboards major kpi key performance indicators of a railway company slides pdf. Use them to share invaluable insights on revenue, employees, key performance indicators and impress your audience. This template can be altered and modified as per your expectations. So, grab it now.
Loyalty Program Performance Tracking Dashboard Topics PDF
This slide covers the KPI dashboard for analyzing customer loyalty campaign results. It includes metrics such as revenue, liability, NQP accrued, transaction count, members, redemption ratio, etc. Deliver an awe inspiring pitch with this creative Loyalty Program Performance Tracking Dashboard Topics PDF bundle. Topics like Loyalty Program Performance, Tracking Dashboard can be discussed with this completely editable template. It is available for immediate download depending on the needs and requirements of the user.
Referral Program Performance Tracking Dashboard Summary PDF
This slide covers the KPI dashboard for analyzing referral campaign results. It includes metrics such as total revenue generated, monthly recurring revenue, new customers, clicks, cancelled customers, paying customers, etc. Deliver and pitch your topic in the best possible manner with this Referral Program Performance Tracking Dashboard Summary PDF. Use them to share invaluable insights on Referral Program Performance, Tracking Dashboard and impress your audience. This template can be altered and modified as per your expectations. So, grab it now.
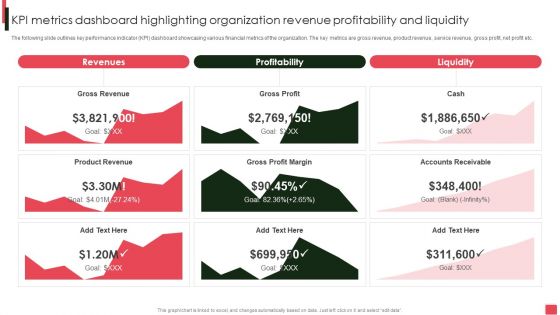
Overview Of Organizational Kpi Metrics Dashboard Highlighting Organization Revenue Brochure PDF
The following slide outlines key performance indicator KPI dashboard showcasing various financial metrics of the organization. The key metrics are gross revenue, product revenue, service revenue, gross profit, net profit etc. If your project calls for a presentation, then Slidegeeks is your go-to partner because we have professionally designed, easy-to-edit templates that are perfect for any presentation. After downloading, you can easily edit Overview Of Organizational Kpi Metrics Dashboard Highlighting Organization Revenue Brochure PDF and make the changes accordingly. You can rearrange slides or fill them with different images. Check out all the handy templates.
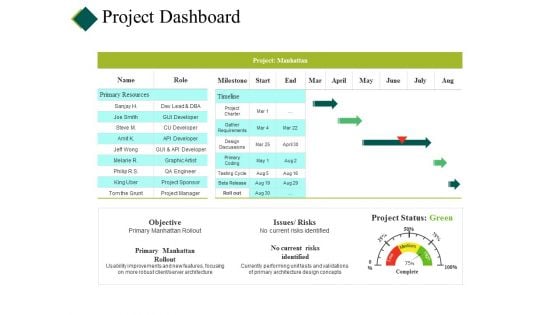
Project Dashboard Ppt PowerPoint Presentation Pictures Backgrounds
This is a project dashboard ppt powerpoint presentation pictures backgrounds. This is a four stage process. The stages in this process are cost, planning, table, project report, data management.

Dashboard Ppt PowerPoint Presentation Styles Pictures
This is a dashboard ppt powerpoint presentation styles pictures. This is a three stage process. The stages in this process are low, medium, high.
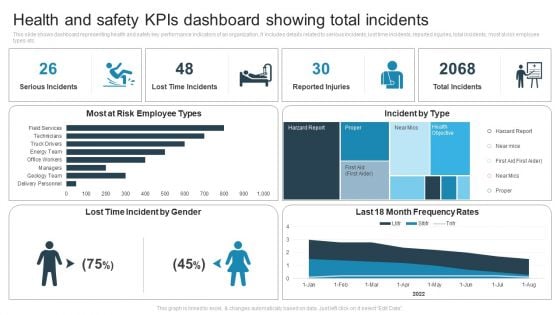
Health And Safety Kpis Dashboard Showing Total Incidents Pictures PDF
This slide shows dashboard representing health and safety key performance indicators of an organization. It includes details related to serious incidents, lost time incidents, reported injuries, total incidents, most at risk employee types etc. Showcasing this set of slides titled Health And Safety Kpis Dashboard Showing Total Incidents Pictures PDF. The topics addressed in these templates are Lost Time Incident, Most At Risk Employee, Incident By Type. All the content presented in this PPT design is completely editable. Download it and make adjustments in color, background, font etc. as per your unique business setting.
Dashboard For Tracking Customer Service Team Performance Clipart PDF
This slide covers the KPI dashboard for analyzing the performance of client support department. It includes metrics such as first call resolution, unresolved calls, average response rate, the best day to call, average time to solve issues, etc. Deliver an awe inspiring pitch with this creative Dashboard For Tracking Customer Service Team Performance Clipart PDF bundle. Topics like Dashboard For Tracking Customer, Service Team Performance can be discussed with this completely editable template. It is available for immediate download depending on the needs and requirements of the user.
Dashboard For Tracking Customer Service Team Performance Information PDF
This slide covers the KPI dashboard for analyzing the performance of client support department. It includes metrics such as first call resolution, unresolved calls, average response rate, the best day to call, average time to solve issues, etc. Deliver an awe inspiring pitch with this creative Dashboard For Tracking Customer Service Team Performance Information PDF bundle. Topics like Dashboard For Tracking Customer, Service Team Performance can be discussed with this completely editable template. It is available for immediate download depending on the needs and requirements of the user.
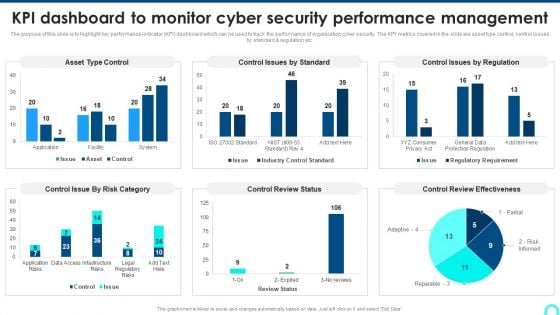
KPI Dashboard To Monitor Cyber Security Performance Management Background PDF
The purpose of this slide is to highlight key performance indicator KPI dashboard which can be used to track the performance of organization cyber security. The KPI metrics covered in the slide are asset type control, control issues by standard and regulation etc.Deliver and pitch your topic in the best possible manner with this KPI Dashboard To Monitor Cyber Security Performance Management Background PDF. Use them to share invaluable insights on Control Issue, Control Review, Review Effectiveness and impress your audience. This template can be altered and modified as per your expectations. So, grab it now.
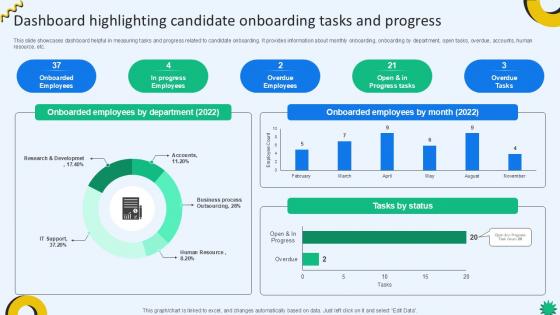
Dashboard Highlighting Candidate Cloud Recruiting Technologies PPT Sample
This slide showcases dashboard helpful in measuring tasks and progress related to candidate onboarding. It provides information about monthly onboarding, onboarding by department, open tasks, overdue, accounts, human resource, etc. Present like a pro with Dashboard Highlighting Candidate Cloud Recruiting Technologies PPT Sample. Create beautiful presentations together with your team, using our easy-to-use presentation slides. Share your ideas in real-time and make changes on the fly by downloading our templates. So whether you are in the office, on the go, or in a remote location, you can stay in sync with your team and present your ideas with confidence. With Slidegeeks presentation got a whole lot easier. Grab these presentations today. This slide showcases dashboard helpful in measuring tasks and progress related to candidate onboarding. It provides information about monthly onboarding, onboarding by department, open tasks, overdue, accounts, human resource, etc.
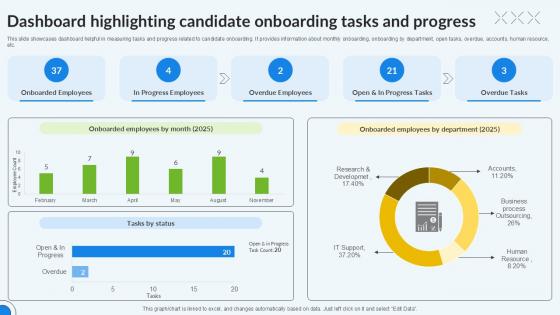
Dashboard Highlighting Candidate Enhancing Recruitment Process PPT Presentation
This slide showcases dashboard helpful in measuring tasks and progress related to candidate onboarding. It provides information about monthly onboarding, onboarding by department, open tasks, overdue, accounts, human resource, etc. Present like a pro with Dashboard Highlighting Candidate Enhancing Recruitment Process PPT Presentation. Create beautiful presentations together with your team, using our easy-to-use presentation slides. Share your ideas in real-time and make changes on the fly by downloading our templates. So whether you are in the office, on the go, or in a remote location, you can stay in sync with your team and present your ideas with confidence. With Slidegeeks presentation got a whole lot easier. Grab these presentations today. This slide showcases dashboard helpful in measuring tasks and progress related to candidate onboarding. It provides information about monthly onboarding, onboarding by department, open tasks, overdue, accounts, human resource, etc.
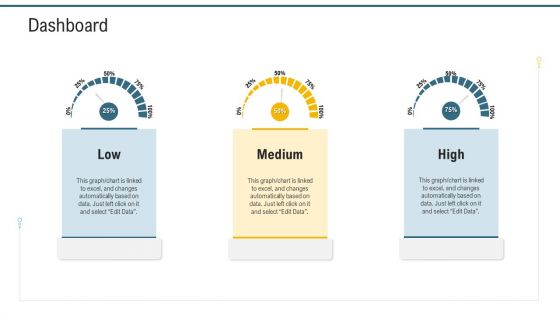
Application Programming Interface Administrative Marketplace Dashboard Ppt Ideas Example Topics PDF
Presenting application programming interface administrative marketplace dashboard ppt ideas example topics pdf to provide visual cues and insights. Share and navigate important information on three stages that need your due attention. This template can be used to pitch topics like low, medium, high. In addition, this PPT design contains high-resolution images, graphics, etc, that are easily editable and available for immediate download.
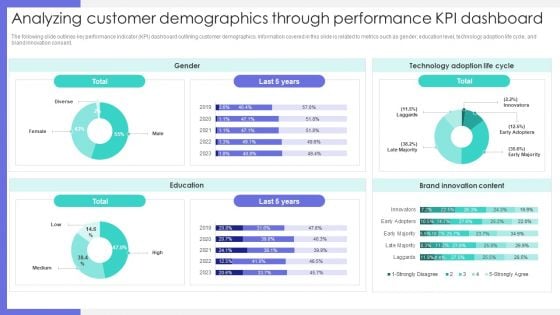
Analyzing Customer Demographics Through Performance KPI Dashboard Graphics PDF
The following slide outlines key performance indicator KPI dashboard outlining customer demographics. Information covered in this slide is related to metrics such as gender, education level, technology adoption life cycle, and brand innovation consent. Find a pre designed and impeccable Analyzing Customer Demographics Through Performance KPI Dashboard Graphics PDF. The templates can ace your presentation without additional effort. You can download these easy to edit presentation templates to make your presentation stand out from others. So, what are you waiting for Download the template from Slidegeeks today and give a unique touch to your presentation.
Referral Program Performance Tracking Dashboard Elements PDF
This slide covers the KPI dashboard for analyzing referral campaign results. It includes metrics such as total revenue generated, monthly recurring revenue, new customers, clicks, cancelled customers, paying customers, etc. Deliver an awe inspiring pitch with this creative Referral Program Performance Tracking Dashboard Elements PDF bundle. Topics like Dashboard, Monthly Recurring Revenue, Paying Customers can be discussed with this completely editable template. It is available for immediate download depending on the needs and requirements of the user.

Global Data Security Industry Report Overview Of Cybersecurity Market Landscape IR SS V
The slide highlights a comprehensive overview of the cyber security industry. The purpose of the slide is to provide insights to stakeholders enabling them to make strategic decisions. The slide covers market sizing, and statistics related to cybersecurity spending, cybercrimes, and venture funding. This modern and well-arranged Global Data Security Industry Report Overview Of Cybersecurity Market Landscape IR SS V provides lots of creative possibilities. It is very simple to customize and edit with the Powerpoint Software. Just drag and drop your pictures into the shapes. All facets of this template can be edited with Powerpoint, no extra software is necessary. Add your own material, put your images in the places assigned for them, adjust the colors, and then you can show your slides to the world, with an animated slide included. The slide highlights a comprehensive overview of the cyber security industry. The purpose of the slide is to provide insights to stakeholders enabling them to make strategic decisions. The slide covers market sizing, and statistics related to cybersecurity spending, cybercrimes, and venture funding.
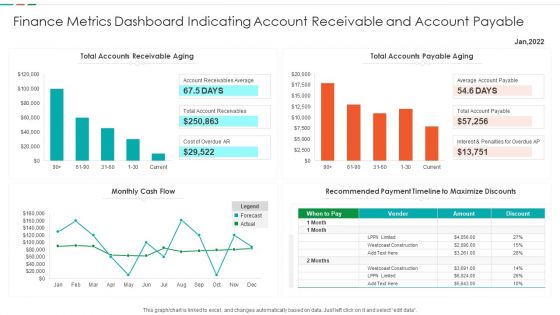
Finance Metrics Dashboard Indicating Account Receivable And Account Payable Demonstration PDF
This graph or chart is linked to excel, and changes automatically based on data. Just left click on it and select edit data. Showcasing this set of slides titled Finance Metrics Dashboard Indicating Account Receivable And Account Payable Demonstration PDF. The topics addressed in these templates are Total Accounts Receivable, Total Accounts Payable, Recommended Payment Timeline, Monthly Cash Flow. All the content presented in this PPT design is completely editable. Download it and make adjustments in color, background, font etc. as per your unique business setting.
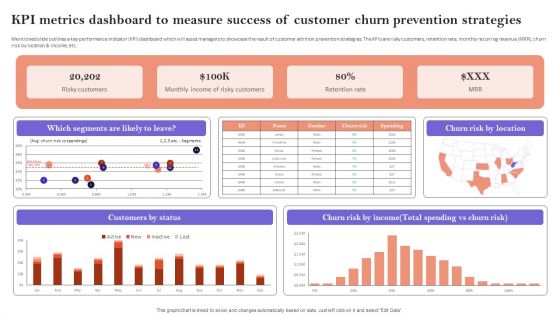
KPI Metrics Dashboard To Measure Success Of Customer Churn Prevention Strategies Diagrams PDF
Mentioned slide outlines a key performance indicator KPI dashboard which will assist managers to showcase the result of customer attrition prevention strategies. The KPIs are risky customers, retention rate, monthly recurring revenue MRR, churn risk by location and income, etc. This KPI Metrics Dashboard To Measure Success Of Customer Churn Prevention Strategies Diagrams PDF is perfect for any presentation, be it in front of clients or colleagues. It is a versatile and stylish solution for organizing your meetings. The KPI Metrics Dashboard To Measure Success Of Customer Churn Prevention Strategies Diagrams PDF features a modern design for your presentation meetings. The adjustable and customizable slides provide unlimited possibilities for acing up your presentation. Slidegeeks has done all the homework before launching the product for you. So, do not wait, grab the presentation templates today
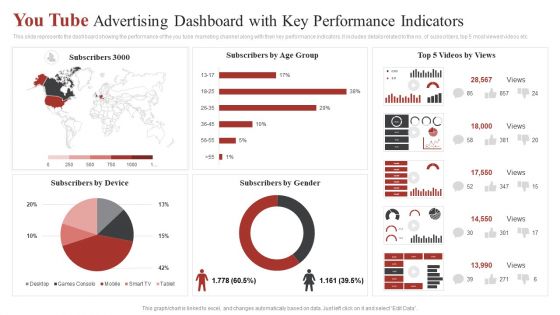
You Tube Advertising Dashboard With Key Performance Indicators Ppt Outline Graphics Example PDF
This slide represents the dashboard showing the performance of the you tube marketing channel along with their key performance indicators. It includes details related to the no. of subscribers, top 5 most viewed videos etc. Showcasing this set of slides titled You Tube Advertising Dashboard With Key Performance Indicators Ppt Outline Graphics Example PDF. The topics addressed in these templates are Subscribers Gender, Subscribers Age Group, Top 5 Videos. All the content presented in this PPT design is completely editable. Download it and make adjustments in color, background, font etc. as per your unique business setting.
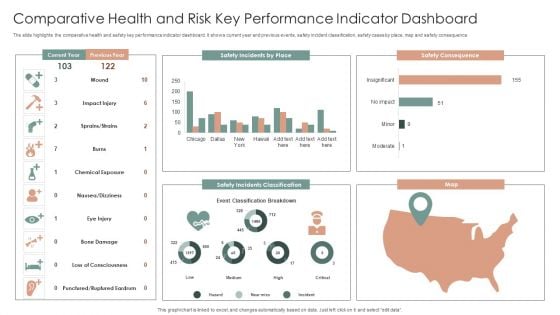
Comparative Health And Risk Key Performance Indicator Dashboard Ppt Portfolio Slide PDF
The slide highlights the comparative health and safety key performance indicator dashboard. It shows current year and previous events, safety incident classification, safety cases by place, map and safety consequence. Showcasing this set of slides titled Comparative Health And Risk Key Performance Indicator Dashboard Ppt Portfolio Slide PDF. The topics addressed in these templates are Safety Consequence, Safety Incidents Classification, Map. All the content presented in this PPT design is completely editable. Download it and make adjustments in color, background, font etc. as per your unique business setting.
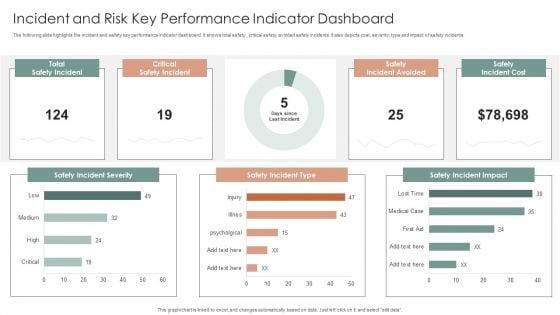
Incident And Risk Key Performance Indicator Dashboard Ppt Gallery Mockup PDF
The following slide highlights the incident and safety key performance indicator dashboard. It shows total safety, critical safety, avoided safety incidents. It also depicts cost, severity, type and impact of safety incidents. Showcasing this set of slides titled Incident And Risk Key Performance Indicator Dashboard Ppt Gallery Mockup PDF. The topics addressed in these templates are Safety Incident Severity, Safety Incident Type, Safety Incident Impact. All the content presented in this PPT design is completely editable. Download it and make adjustments in color, background, font etc. as per your unique business setting.
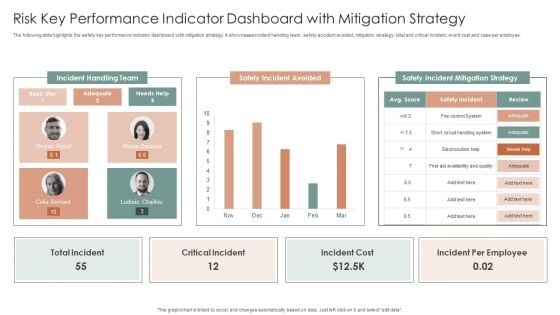
Risk Key Performance Indicator Dashboard With Mitigation Strategy Ppt Inspiration Design Templates PDF
The following slide highlights the safety key performance indicator dashboard with mitigation strategy. It showcases incident handling team, safety accident avoided, mitigation strategy, total and critical incident, event cost and case per employee. Showcasing this set of slides titled Risk Key Performance Indicator Dashboard With Mitigation Strategy Ppt Inspiration Design Templates PDF. The topics addressed in these templates are Incident Handling Team, Safety Incident Avoided, Safety Incident. All the content presented in this PPT design is completely editable. Download it and make adjustments in color, background, font etc. as per your unique business setting.
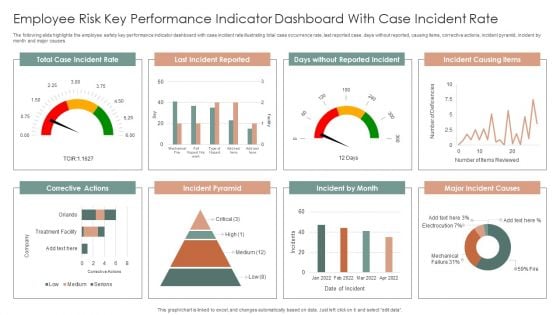
Employee Risk Key Performance Indicator Dashboard With Case Incident Rate Ppt Professional Information PDF
The following slide highlights the employee safety key performance indicator dashboard with case incident rate illustrating total case occurrence rate, last reported case, days without reported, causing items, corrective actions, incident pyramid, incident by month and major causes. Pitch your topic with ease and precision using this Employee Risk Key Performance Indicator Dashboard With Case Incident Rate Ppt Professional Information PDF. This layout presents information on Total Case, Incident Rate, Last Incident Reported, Incident Causing Items. It is also available for immediate download and adjustment. So, changes can be made in the color, design, graphics or any other component to create a unique layout.

Patient Health And Risk Key Performance Indicator Dashboard Ppt Infographic Template Summary PDF
The following slide highlights the patient health and safety key performance indicator dashboard illustrating admission by department, admission by cost, patient satisfaction, total patients, operations cost, patient density, total staff, waiting time, treatment satisfaction and treatment confidence. Pitch your topic with ease and precision using this Patient Health And Risk Key Performance Indicator Dashboard Ppt Infographic Template Summary PDF. This layout presents information on Admission By Department, Admission Vs Cost, Patient Satisfaction. It is also available for immediate download and adjustment. So, changes can be made in the color, design, graphics or any other component to create a unique layout.
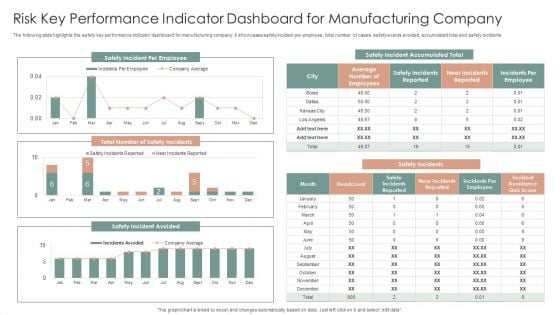
Risk Key Performance Indicator Dashboard For Manufacturing Company Ppt Gallery Graphics Design PDF
The following slide highlights the safety key performance indicator dashboard for manufacturing company. It showcases safety incident per employee, total number of cases, safety events avoided, accumulated total and safety incidents. Pitch your topic with ease and precision using this Risk Key Performance Indicator Dashboard For Manufacturing Company Ppt Gallery Graphics Design PDF. This layout presents information on Safety Incidents, Safety Incident Avoided, Safety Incident Accumulated. It is also available for immediate download and adjustment. So, changes can be made in the color, design, graphics or any other component to create a unique layout.
Learning And Improvement KPI Training Dashboard Icon Graphics Pdf
Pitch your topic with ease and precision using this Learning And Improvement KPI Training Dashboard Icon Graphics Pdf. This layout presents information on Learning And Improvement KPI, Training Dashboard Icon. It is also available for immediate download and adjustment. So, changes can be made in the color, design, graphics or any other component to create a unique layout. Our Learning And Improvement KPI Training Dashboard Icon Graphics Pdf are topically designed to provide an attractive backdrop to any subject. Use them to look like a presentation pro.
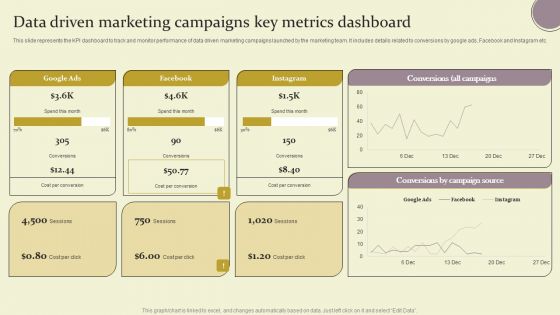
Data Driven Marketing Campaigns Key Metrics Dashboard Ppt Outline Example Introduction PDF
This slide represents the KPI dashboard to track and monitor performance of data driven marketing campaigns launched by the marketing team. It includes details related to conversions by google ads, Facebook and Instagram etc. Explore a selection of the finest Data Driven Marketing Campaigns Key Metrics Dashboard Ppt Outline Example Introduction PDF here. With a plethora of professionally designed and pre made slide templates, you can quickly and easily find the right one for your upcoming presentation. You can use our Data Driven Marketing Campaigns Key Metrics Dashboard Ppt Outline Example Introduction PDF to effectively convey your message to a wider audience. Slidegeeks has done a lot of research before preparing these presentation templates. The content can be personalized and the slides are highly editable. Grab templates today from Slidegeeks.
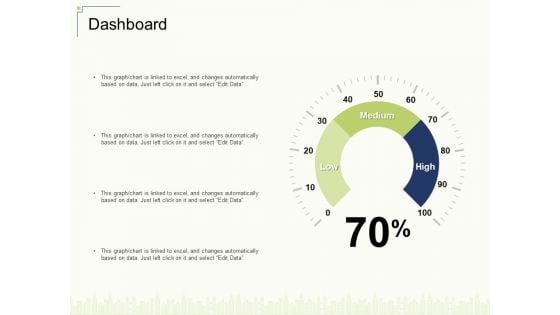
Dashboard Ppt Show Microsoft PDF
Deliver and pitch your topic in the best possible manner with this dashboard ppt show microsoft pdf. Use them to share invaluable insights on low, medium, high and impress your audience. This template can be altered and modified as per your expectations. So, grab it now.
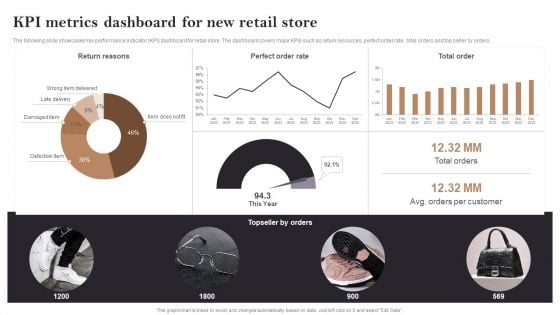
Kpi Metrics Dashboard For New Retail Store Opening Retail Store In Untapped Demonstration PDF
The following slide showcases key performance indicator KPI dashboard for retail store. The dashboard covers major KPIs such as return resources, perfect order rate, total orders and top seller by orders. Slidegeeks is one of the best resources for PowerPoint templates. You can download easily and regulate Kpi Metrics Dashboard For New Retail Store Opening Retail Store In Untapped Demonstration PDF for your personal presentations from our wonderful collection. A few clicks is all it takes to discover and get the most relevant and appropriate templates. Use our Templates to add a unique zing and appeal to your presentation and meetings. All the slides are easy to edit and you can use them even for advertisement purposes.
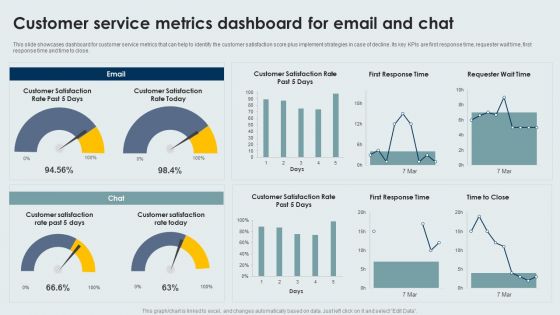
Customer Service Metrics Dashboard For Email And Chat Infographics PDF
This slide showcases dashboard for customer service metrics that can help to identify the customer satisfaction score plus implement strategies in case of decline. Its key KPIs are first response time, requester wait time, first response time and time to close. Pitch your topic with ease and precision using this Customer Service Metrics Dashboard For Email And Chat Infographics PDF. This layout presents information on Customer Service, Metrics Dashboard, Email And Chat. It is also available for immediate download and adjustment. So, changes can be made in the color, design, graphics or any other component to create a unique layout.
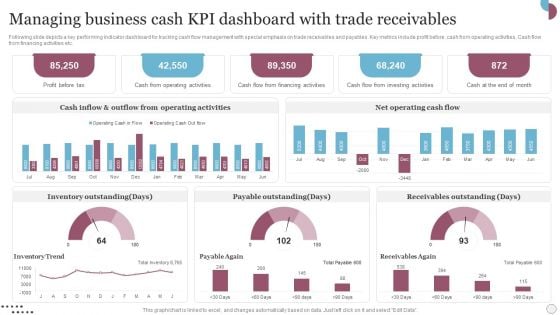
Managing Business Cash Kpi Dashboard With Trade Receivables Slides PDF
Following slide depicts a key performing indicator dashboard for tracking cash flow management with special emphasis on trade receivables and payables. Key metrics include profit before, cash from operating activities, Cash flow from financing activities etc. Showcasing this set of slides titled Managing Business Cash Kpi Dashboard With Trade Receivables Slides PDF. The topics addressed in these templates are Inventory Outstanding, Payable Outstanding, Receivables Outstanding. All the content presented in this PPT design is completely editable. Download it and make adjustments in color, background, font etc. as per your unique business setting.
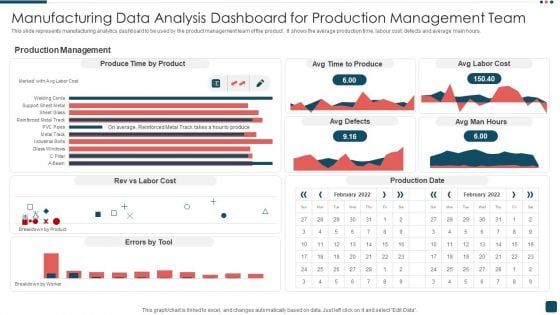
Manufacturing Data Analysis Dashboard For Production Management Team Summary PDF
This slide represents manufacturing analytics dashboard to be used by the product management team of the product . It shows the average production time, labour cost, defects and average main hours. Pitch your topic with ease and precision using this Manufacturing Data Analysis Dashboard For Production Management Team Summary PDF. This layout presents information on Production Management, Product, Cost. It is also available for immediate download and adjustment. So, changes can be made in the color, design, graphics or any other component to create a unique layout.
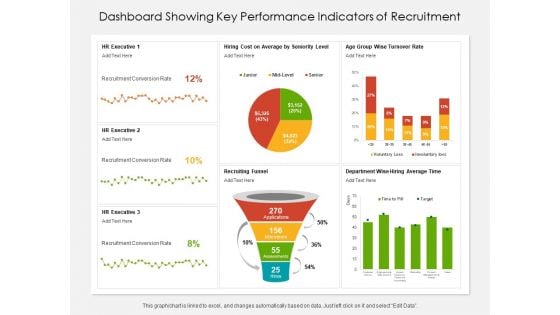
Dashboard Showing Key Performance Indicators Of Recruitment Ppt PowerPoint Presentation File Background Image PDF
Presenting this set of slides with name dashboard showing key performance indicators of recruitment ppt powerpoint presentation file background image pdf. The topics discussed in these slides are executive, funnel, department. This is a completely editable PowerPoint presentation and is available for immediate download. Download now and impress your audience.
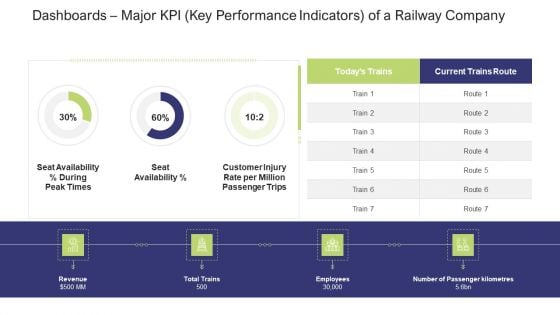
Dashboards Major KPI Key Performance Indicators Of A Railway Company Information PDF
Deliver an awe-inspiring pitch with this creative dashboards major KPI key performance indicators of a railway company information pdf. bundle. Topics like seat availability percent during, peak times, seat availability percent can be discussed with this completely editable template. It is available for immediate download depending on the needs and requirements of the user.
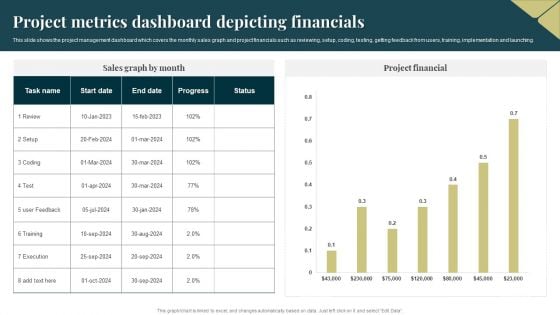
Project Metrics Dashboard Depicting Financials Pictures PDF
This slide shows the project management dashboard which covers the monthly sales graph and project financials such as reviewing, setup, coding, testing, getting feedback from users, training, implementation and launching. Pitch your topic with ease and precision using this Project Metrics Dashboard Depicting Financials Pictures PDF. This layout presents information on Execution, Project Financial. It is also available for immediate download and adjustment. So, changes can be made in the color, design, graphics or any other component to create a unique layout.
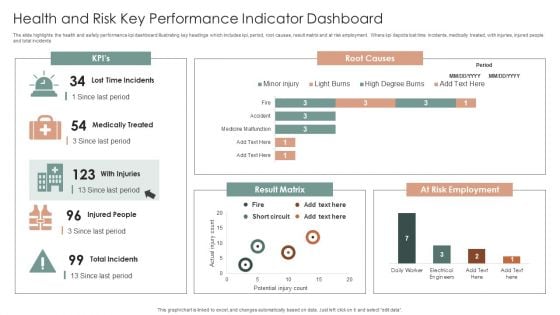
Health And Risk Key Performance Indicator Dashboard Ppt Layouts Graphics Design PDF
The slide highlights the health and safety performance kpi dashboard illustrating key headings which includes kpi, period, root causes, result matrix and at risk employment. Where kpi depicts lost time incidents, medically treated, with injuries, injured people and total incidents. Showcasing this set of slides titled Health And Risk Key Performance Indicator Dashboard Ppt Layouts Graphics Design PDF. The topics addressed in these templates are Root Causes, Result Matrix, At Risk Employment. All the content presented in this PPT design is completely editable. Download it and make adjustments in color, background, font etc. as per your unique business setting.
Dashboard For Tracking Aftersales Customer Services Team Performance Designs PDF
This slide covers the KPI dashboard for ticket tracking. It includes metrics such as tickets by month, service level, and details of customer service department agents. Boost your pitch with our creative Dashboard For Tracking Aftersales Customer Services Team Performance Designs PDF. Deliver an awe inspiring pitch that will mesmerize everyone. Using these presentation templates you will surely catch everyones attention. You can browse the ppts collection on our website. We have researchers who are experts at creating the right content for the templates. So you do not have to invest time in any additional work. Just grab the template now and use them.
Loyalty Program Performance Tracking Dashboard Background PDF
This slide covers the KPI dashboard for analyzing customer loyalty campaign results. It includes metrics such as revenue, liability, NQP accrued, transaction count, members, redemption ratio, etc. Deliver an awe inspiring pitch with this creative Loyalty Program Performance Tracking Dashboard Background PDF bundle. Topics like Liability, Revenue, Redemption Ratio can be discussed with this completely editable template. It is available for immediate download depending on the needs and requirements of the user.
Activity Tracker Dashboard In Powerpoint And Google Slides Cpb
Presenting our innovatively-designed set of slides titled Activity Tracker Dashboard In Powerpoint And Google Slides Cpb This completely editable PowerPoint graphic exhibits Activity Tracker Dashboard that will help you convey the message impactfully. It can be accessed with Google Slides and is available in both standard screen and widescreen aspect ratios. Apart from this, you can download this well-structured PowerPoint template design in different formats like PDF, JPG, and PNG. So, click the download button now to gain full access to this PPT design. Our Activity Tracker Dashboard In Powerpoint And Google Slides Cpb are topically designed to provide an attractive backdrop to any subject. Use them to look like a presentation pro.
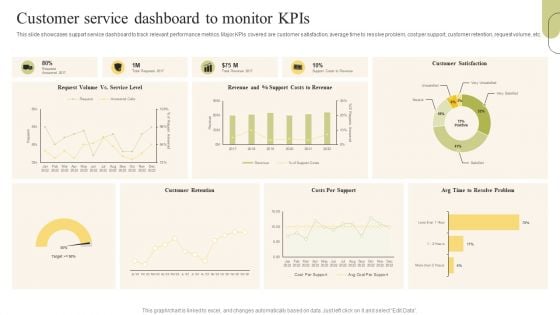
Customer Support Services Customer Service Dashboard To Monitor Kpis Microsoft PDF
This slide showcases support service dashboard to track relevant performance metrics. Major KPIs covered are customer satisfaction, average time to resolve problem, cost per support, customer retention, request volume, etc. Slidegeeks is here to make your presentations a breeze with Customer Support Services Customer Service Dashboard To Monitor Kpis Microsoft PDF With our easy-to-use and customizable templates, you can focus on delivering your ideas rather than worrying about formatting. With a variety of designs to choose from, youre sure to find one that suits your needs. And with animations and unique photos, illustrations, and fonts, you can make your presentation pop. So whether youre giving a sales pitch or presenting to the board, make sure to check out Slidegeeks first.
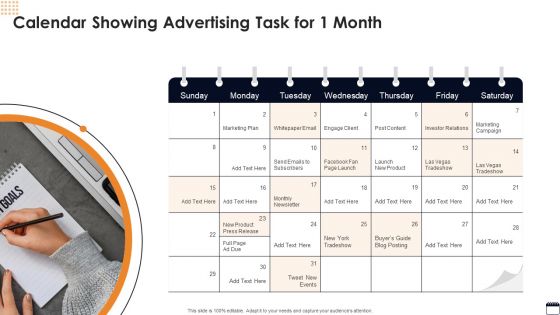
Calendar Showing Advertising Task For 1 Month Pictures PDF
Presenting Calendar Showing Advertising Task For 1 Month Pictures PDF to dispense important information. This template comprises seven stages. It also presents valuable insights into the topics including Marketing Plan, Marketing Campaign, Product. This is a completely customizable PowerPoint theme that can be put to use immediately. So, download it and address the topic impactfully.

Store Performance Dashboard In Powerpoint And Google Slides Cpb
Introducing our well designed Store Performance Dashboard In Powerpoint And Google Slides Cpb. This PowerPoint design presents information on topics like Store Performance Dashboard. As it is predesigned it helps boost your confidence level. It also makes you a better presenter because of its high quality content and graphics. This PPT layout can be downloaded and used in different formats like PDF, PNG, and JPG. Not only this, it is available in both Standard Screen and Widescreen aspect ratios for your convenience. Therefore, click on the download button now to persuade and impress your audience. Our Store Performance Dashboard In Powerpoint And Google Slides Cpb are topically designed to provide an attractive backdrop to any subject. Use them to look like a presentation pro.
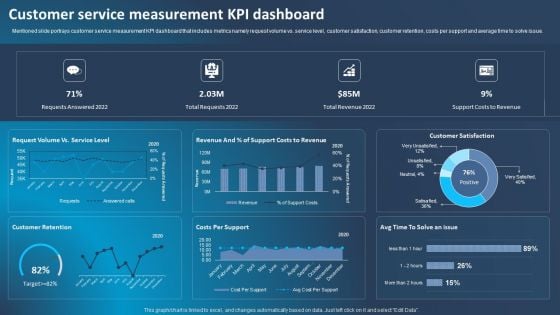
Improving Corporate Performance Customer Service Measurement Kpi Dashboard Microsoft PDF
Mentioned slide portrays customer service measurement KPI dashboard that includes metrics namely request volume vs. service level, customer satisfaction, customer retention, costs per support and average time to solve issue. Do you have to make sure that everyone on your team knows about any specific topic I yes, then you should give Improving Corporate Performance Customer Service Measurement Kpi Dashboard Microsoft PDF a try. Our experts have put a lot of knowledge and effort into creating this impeccable Improving Corporate Performance Customer Service Measurement Kpi Dashboard Microsoft PDF. You can use this template for your upcoming presentations, as the slides are perfect to represent even the tiniest detail. You can download these templates from the Slidegeeks website and these are easy to edit. So grab these today.
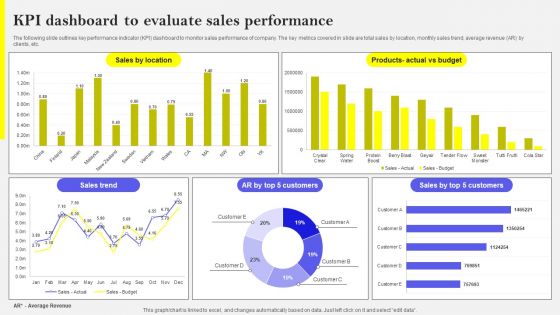
KPI Dashboard To Evaluate Sales Performance Template PDF
The following slide outlines key performance indicator KPI dashboard to monitor sales performance of company. The key metrics covered in slide are total sales by location, monthly sales trend, average revenue AR by clients, etc. Welcome to our selection of the KPI Dashboard To Evaluate Sales Performance Template PDF. These are designed to help you showcase your creativity and bring your sphere to life. Planning and Innovation are essential for any business that is just starting out. This collection contains the designs that you need for your everyday presentations. All of our PowerPoints are 100 percent editable, so you can customize them to suit your needs. This multi-purpose template can be used in various situations. Grab these presentation templates today
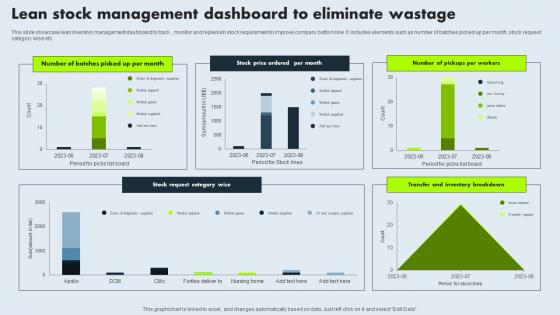
Lean Stock Management Dashboard To Eliminate Wastage Mockup Pdf
This slide showcase lean inventory management dashboard to track , monitor and replenish stock requirement to improve company bottom line. It includes elements such as number of batches picked up per month, stock request category wise etc. Pitch your topic with ease and precision using this Lean Stock Management Dashboard To Eliminate Wastage Mockup Pdf. This layout presents information on Lean Stock, Management Dashboard, Eliminate Wastage, Stock Request Category. It is also available for immediate download and adjustment. So, changes can be made in the color, design, graphics or any other component to create a unique layout. This slide showcase lean inventory management dashboard to track , monitor and replenish stock requirement to improve company bottom line. It includes elements such as number of batches picked up per month, stock request category wise etc.
Customer Service Metrics Dashboard With Customer Retention Rate Icons PDF
This slide showcases KPIs dashboard for customer service that can help organization to track the consumer satisfaction score and improve product or service by improving customer loyalty. Its key components are net promoter score, customer retention and support costs. Showcasing this set of slides titled Customer Service Metrics Dashboard With Customer Retention Rate Icons PDF. The topics addressed in these templates are Customer Retention, Net Promoter Score, Service Level. All the content presented in this PPT design is completely editable. Download it and make adjustments in color, background, font etc. as per your unique business setting.
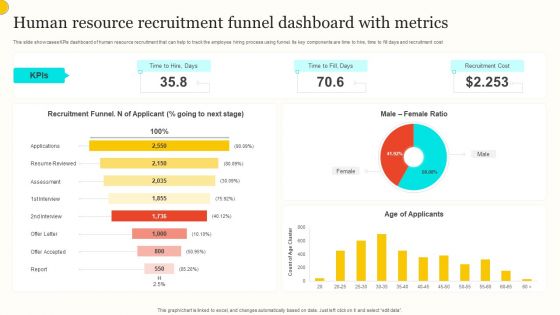
Human Resource Recruitment Funnel Dashboard With Metrics Summary PDF
This slide showcases KPIs dashboard of human resource recruitment that can help to track the employee hiring process using funnel. Its key components are time to hire, time to fill days and recruitment cost. Showcasing this set of slides titled Human Resource Recruitment Funnel Dashboard With Metrics Summary PDF. The topics addressed in these templates are Recruitment Funnel, Male Female Ratio, Age Applicants. All the content presented in this PPT design is completely editable. Download it and make adjustments in color, background, font etc. as per your unique business setting.
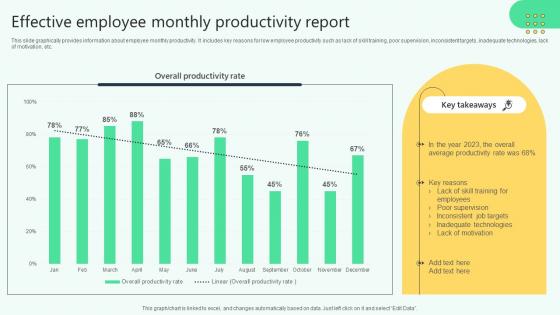
Effective Employee Monthly Productivity Report Analysing Hr Data For Effective Decision Making
This slide graphically provides information about employee monthly productivity. It includes key reasons for low employee productivity such as lack of skill training, poor supervision, inconsistent targets, inadequate technologies, lack of motivation, etc. If your project calls for a presentation, then Slidegeeks is your go-to partner because we have professionally designed, easy-to-edit templates that are perfect for any presentation. After downloading, you can easily edit Effective Employee Monthly Productivity Report Analysing Hr Data For Effective Decision Making and make the changes accordingly. You can rearrange slides or fill them with different images. Check out all the handy templates This slide graphically provides information about employee monthly productivity. It includes key reasons for low employee productivity such as lack of skill training, poor supervision, inconsistent targets, inadequate technologies, lack of motivation, etc.


 Continue with Email

 Home
Home


