Dashboard Icon
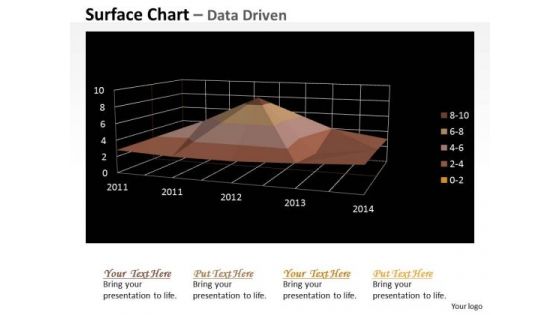
Multivariate Data Analysis Numeric Values Surface Chart PowerPoint Templates
Your Grasp Of Economics Is Well Known. Help Your Audience Comprehend Issues With Our multivariate data analysis numeric values surface chart Powerpoint Templates .
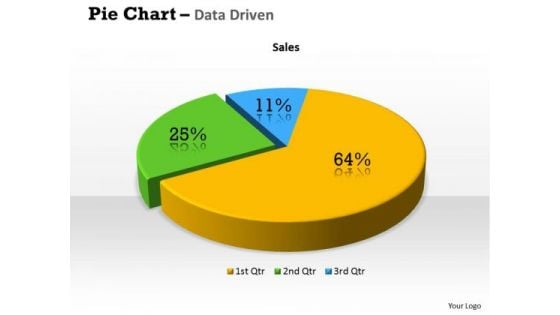
Quantitative Data Analysis 3d Percentage Ratio Pie Chart PowerPoint Templates
Plan Your Storyboard With Our quantitative data analysis 3d percentage ratio pie chart Powerpoint Templates . Give An Outline To The Solutions You Have.
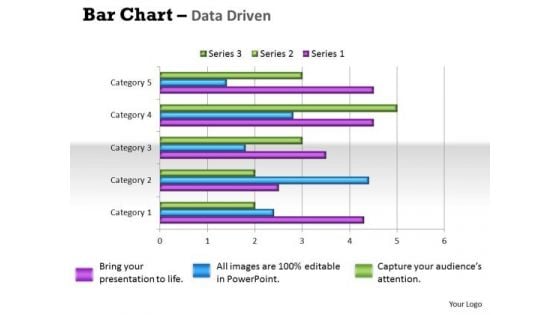
Quantitative Data Analysis Bar Chart For Different Categories PowerPoint Templates
Make Some Dough With Our quantitative data analysis bar chart for different categories Powerpoint Templates . Your Assets Will Rise Significantly.
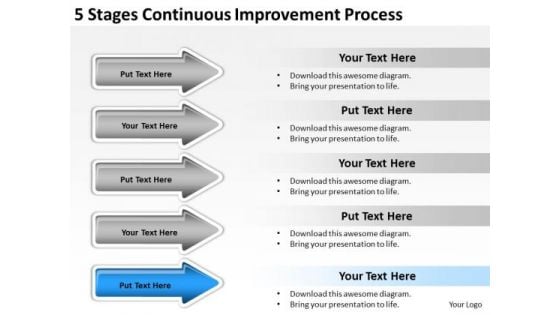
Arrows For Stages Continuous Improvement Process PowerPoint Templates
We present our arrows for stages continuous improvement process PowerPoint templates.Download our Business PowerPoint Templates because You aspire to touch the sky with glory. Let our PowerPoint Templates and Slides provide the fuel for your ascent. Present our Arrows PowerPoint Templates because Our PowerPoint Templates and Slides will generate and maintain the level of interest you desire. They will create the impression you want to imprint on your audience. Present our Process and Flows PowerPoint Templates because Our PowerPoint Templates and Slides will let your words and thoughts hit bullseye everytime. Download and present our Shapes PowerPoint Templates because You can Zap them with our PowerPoint Templates and Slides. See them reel under the impact. Download and present our Flow Charts PowerPoint Templates because Our PowerPoint Templates and Slides provide you with a vast range of viable options. Select the appropriate ones and just fill in your text. Use these PowerPoint slides for presentations relating to Accounting, arrow, bar, blue, business, chart, collection, company, diagram, directive, finance, forecast, future, growth, icon, illustration, market, measure, profit, progress, statistic, stock, success. The prominent colors used in the PowerPoint template are Blue, Gray, White. People tell us our arrows for stages continuous improvement process PowerPoint templates are aesthetically designed to attract attention. We guarantee that they will grab all the eyeballs you need. Presenters tell us our diagram PowerPoint templates and PPT Slides will get their audience's attention. Customers tell us our arrows for stages continuous improvement process PowerPoint templates are designed by professionals Customers tell us our blue PowerPoint templates and PPT Slides will make you look like a winner. Professionals tell us our arrows for stages continuous improvement process PowerPoint templates are effectively colour coded to prioritise your plans They automatically highlight the sequence of events you desire. Use our chart PowerPoint templates and PPT Slides are incredible easy to use. With our Arrows For Stages Continuous Improvement Process PowerPoint Templates you will feel up to it. Derive the confidence to go for it.
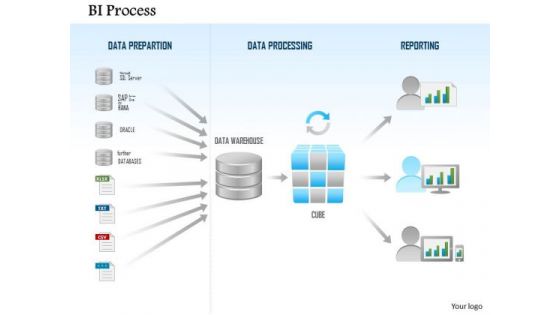
Business Diagram Business Intelligence Process Data Preparation Processing Reporting Ppt Slide
This technology diagram has been designed with graphic of computer server and databases with connectivity. This slide depicts the concept of business intelligence for data preparation. Download this diagram to build professional presentations.
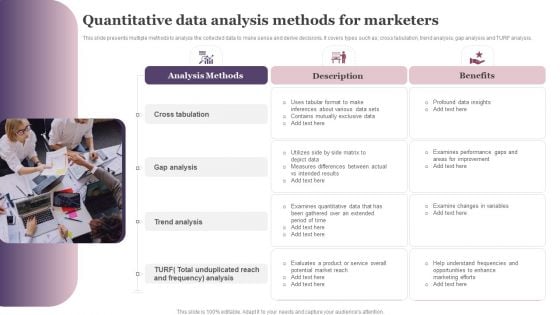
Quantitative Data Analysis Methods For Marketers Ppt Pictures Aids PDF
This slide presents multiple methods to analyze the collected data to make sense and derive decisions. It covers types such as, cross tabulation, trend analysis, gap analysis and TURF analysis. Presenting Quantitative Data Analysis Methods For Marketers Ppt Pictures Aids PDF to dispense important information. This template comprises three stages. It also presents valuable insights into the topics including Cross Tabulation, Gap Analysis, Trend Analysis. This is a completely customizable PowerPoint theme that can be put to use immediately. So, download it and address the topic impactfully.

Marketers Guide To Data Analysis Optimization Introduction To Website Landing Page Analytics To Increase Portrait PDF
This slide covers an overview of web landing page analysis. It also includes steps for analyzing landing page performance, such as creating a tempting offer or launching a new website page, creating a campaign, analyzing data, and making changes to enhance performance. Retrieve professionally designed Marketers Guide To Data Analysis Optimization Introduction To Website Landing Page Analytics To Increase Portrait PDF to effectively convey your message and captivate your listeners. Save time by selecting pre made slideshows that are appropriate for various topics, from business to educational purposes. These themes come in many different styles, from creative to corporate, and all of them are easily adjustable and can be edited quickly. Access them as PowerPoint templates or as Google Slides themes. You do not have to go on a hunt for the perfect presentation because Slidegeeks got you covered from everywhere.
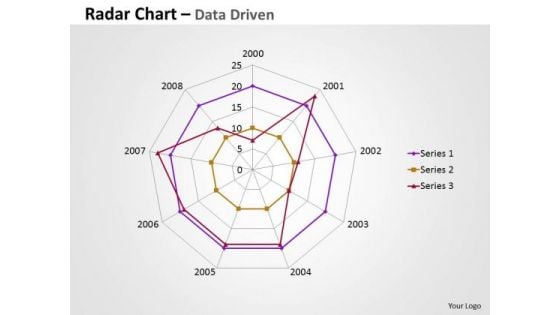
Business Data Analysis Chart Comparing Multiple Entities PowerPoint Templates
Analyze Ailments On Our business data analysis chart comparing multiple entities Powerpoint Templates. Bring Out The Thinking Doctor In You. Dock Your Thoughts With Our Financial Analysis . They Will Launch Them Into Orbit.
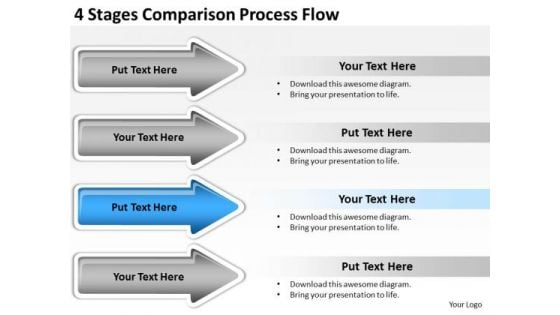
Arrows PowerPoint 4 Stages Comparison Process Flow Slides
We present our arrows powerpoint 4 stages comparison process flow Slides.Use our Business PowerPoint Templates because Our PowerPoint Templates and Slides are created with admirable insight. Use them and give your group a sense of your logical mind. Present our Process and Flows PowerPoint Templates because Our PowerPoint Templates and Slides are created by a hardworking bunch of busybees. Always flitting around with solutions gauranteed to please. Download our Shapes PowerPoint Templates because They will bring a lot to the table. Their alluring flavours will make your audience salivate. Download our Steps PowerPoint Templates because You have a driving passion to excel in your field. Our PowerPoint Templates and Slides will prove ideal vehicles for your ideas. Present our Flow Charts PowerPoint Templates because Our PowerPoint Templates and Slides are effectively colour coded to prioritise your plans They automatically highlight the sequence of events you desire.Use these PowerPoint slides for presentations relating to Accounting, arrow, bar, blue, business, chart, collection, company, diagram, directive, finance, forecast, future, growth, icon, illustration, market, measure, profit, progress, statistic, stock, success. The prominent colors used in the PowerPoint template are Blue, Gray, White. People tell us our arrows powerpoint 4 stages comparison process flow Slides are designed to make your presentations professional. Presenters tell us our company PowerPoint templates and PPT Slides are effectively colour coded to prioritise your plans They automatically highlight the sequence of events you desire. Customers tell us our arrows powerpoint 4 stages comparison process flow Slides are visually appealing. Customers tell us our blue PowerPoint templates and PPT Slides will get their audience's attention. Professionals tell us our arrows powerpoint 4 stages comparison process flow Slides effectively help you save your valuable time. Use our chart PowerPoint templates and PPT Slides are aesthetically designed to attract attention. We guarantee that they will grab all the eyeballs you need. Audiences demand excitement. Give them a full dose and more with our Arrows PowerPoint 4 Stages Comparison Process Flow Slides.
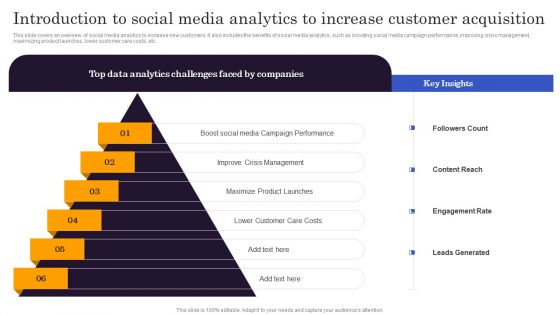
Marketers Guide To Data Analysis Optimization Introduction To Social Media Analytics To Increase Customer Topics PDF
This slide covers an overview of social media analytics to increase new customers. It also includes the benefits of social media analytics, such as boosting social media campaign performance, improving crisis management, maximizing product launches, lower customer care costs, etc. Are you searching for a Marketers Guide To Data Analysis Optimization Introduction To Social Media Analytics To Increase Customer Topics PDF that is uncluttered, straightforward, and original Its easy to edit, and you can change the colors to suit your personal or business branding. For a presentation that expresses how much effort you have put in, this template is ideal. With all of its features, including tables, diagrams, statistics, and lists, its perfect for a business plan presentation. Make your ideas more appealing with these professional slides. Download Marketers Guide To Data Analysis Optimization Introduction To Social Media Analytics To Increase Customer Topics PDF from Slidegeeks today.
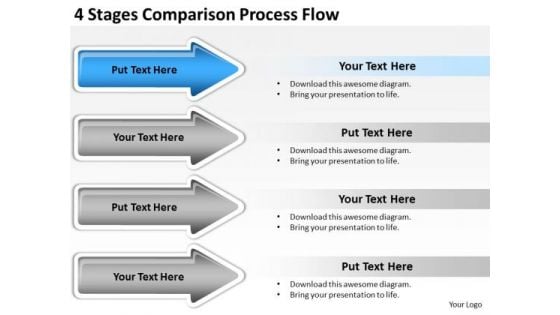
Arrows Stages Comparison Process Flow PowerPoint Templates Backgrounds For Slides
We present our arrows stages comparison process flow PowerPoint templates backgrounds for slides.Use our Flow Charts PowerPoint Templates because You can Inspire your team with our PowerPoint Templates and Slides. Let the force of your ideas flow into their minds. Download our Process and Flows PowerPoint Templates because You are working at that stage with an air of royalty. Let our PowerPoint Templates and Slides be the jewels in your crown. Use our Marketing PowerPoint Templates because You can Zap them with our PowerPoint Templates and Slides. See them reel under the impact. Use our Business PowerPoint Templates because You can Be the puppeteer with our PowerPoint Templates and Slides as your strings. Lead your team through the steps of your script. Present our Shapes PowerPoint Templates because Our PowerPoint Templates and Slides will Activate the energies of your audience. Get their creative juices flowing with your words.Use these PowerPoint slides for presentations relating to Accounting, arrow, bar, blue, business, chart, collection, company, diagram, directive, finance, forecast, future, growth, icon, illustration, market, measure, profit, progress, statistic, stock, success. The prominent colors used in the PowerPoint template are Blue, Gray, White. People tell us our arrows stages comparison process flow PowerPoint templates backgrounds for slides will make you look like a winner. Presenters tell us our company PowerPoint templates and PPT Slides have awesome images to get your point across. Customers tell us our arrows stages comparison process flow PowerPoint templates backgrounds for slides will help them to explain complicated concepts. Customers tell us our bar PowerPoint templates and PPT Slides will save the presenter time. Professionals tell us our arrows stages comparison process flow PowerPoint templates backgrounds for slides will make the presenter look like a pro even if they are not computer savvy. Use our company PowerPoint templates and PPT Slides will save the presenter time. Suggest ideas with our Arrows Stages Comparison Process Flow PowerPoint Templates Backgrounds For Slides. Download without worries with our money back guaranteee.
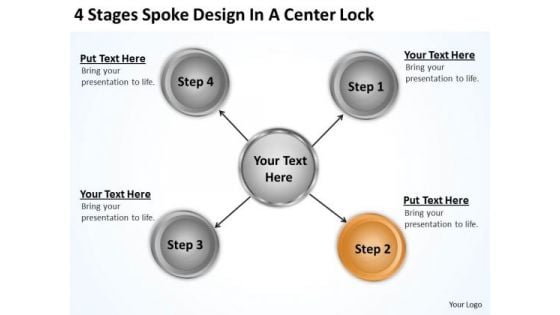
Business Process Flowchart Examples 4 Stages Spoke Design Center Lock PowerPoint Slides
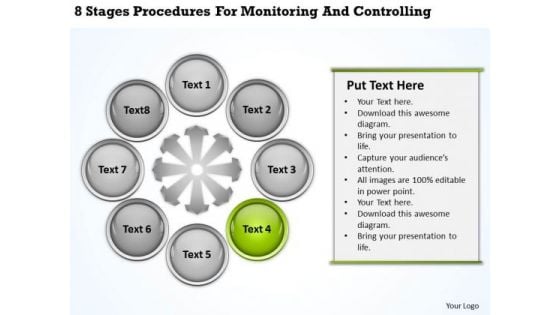
Business Process Flowchart Procedures For Monitoring And Controlling PowerPoint Template
We present our business process flowchart procedures for monitoring and controlling PowerPoint template.Download our Industrial PowerPoint Templates because You can Raise a toast with our PowerPoint Templates and Slides. Spread good cheer amongst your audience. Download and present our Arrows PowerPoint Templates because Our PowerPoint Templates and Slides are created with admirable insight. Use them and give your group a sense of your logical mind. Download our Signs PowerPoint Templates because our PowerPoint Templates and Slides are the string of your bow. Fire of your ideas and conquer the podium. Download and present our Shapes PowerPoint Templates because you should Experience excellence with our PowerPoint Templates and Slides. They will take your breath away. Download our Process and Flows PowerPoint Templates because Our PowerPoint Templates and Slides are designed to help you succeed. They have all the ingredients you need.Use these PowerPoint slides for presentations relating to 3d, abstract, arrow, art, background, blank, business, chart, circle, concept, connection, cycle, development, diagram, direction, element, environment, exchange, finance, financial, flow, graph, graphic, graphic presentation, group, icon, illustration, investment, isolated, isometric, market, motion, movement, organization, passive income, perspective, presentation, process, process chart, recycle, report, ring, sign, step, stock, success, symbol, teamwork, text. The prominent colors used in the PowerPoint template are Green, Gray, White. Enhance growth with our Business Process Flowchart Procedures For Monitoring And Controlling PowerPoint Template. Download without worries with our money back guaranteee.
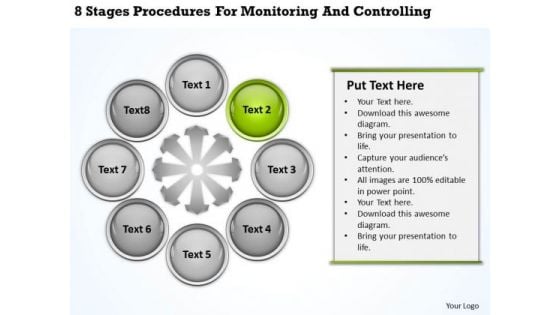
Business Process Flowchart Procedures For Monitoring And Controlling PowerPoint Templates
We present our business process flowchart procedures for monitoring and controlling PowerPoint templates.Download our Industrial PowerPoint Templates because Our PowerPoint Templates and Slides will bullet point your ideas. See them fall into place one by one. Download our Arrows PowerPoint Templates because You are an avid believer in ethical practices. Highlight the benefits that accrue with our PowerPoint Templates and Slides. Download our Signs PowerPoint Templates because It can Leverage your style with our PowerPoint Templates and Slides. Charm your audience with your ability. Use our Shapes PowerPoint Templates because Our PowerPoint Templates and Slides will let your team Walk through your plans. See their energy levels rise as you show them the way. Download our Process and Flows PowerPoint Templates because Our PowerPoint Templates and Slides will give good value for money. They also have respect for the value of your time.Use these PowerPoint slides for presentations relating to 3d, abstract, arrow, art, background, blank, business, chart, circle, concept, connection, cycle, development, diagram, direction, element, environment, exchange, finance, financial, flow, graph, graphic, graphic presentation, group, icon, illustration, investment, isolated, isometric, market, motion, movement, organization, passive income, perspective, presentation, process, process chart, recycle, report, ring, sign, step, stock, success, symbol, teamwork, text. The prominent colors used in the PowerPoint template are Green, Gray, White. Live life in the fast lane. OurBusiness Process Flowchart Procedures For Monitoring And Controlling PowerPoint Templates will accelerate your thought process.
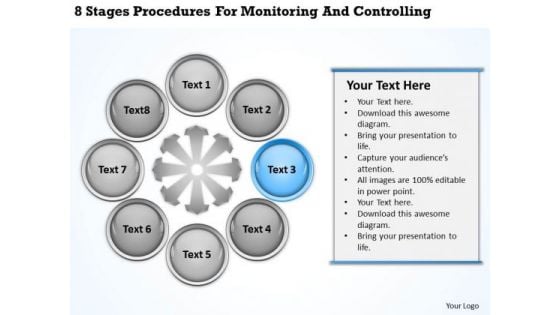
Business Process Flowchart Procedures For Monitoring And Controlling Ppt PowerPoint Templates
We present our business process flowchart procedures for monitoring and controlling ppt PowerPoint templates.Download and present our Industrial PowerPoint Templates because You can Connect the dots. Fan expectations as the whole picture emerges. Download our Arrows PowerPoint Templates because Timeline crunches are a fact of life. Meet all deadlines using our PowerPoint Templates and Slides. Download and present our Signs PowerPoint Templates because You have gained great respect for your brilliant ideas. Use our PowerPoint Templates and Slides to strengthen and enhance your reputation. Download and present our Shapes PowerPoint Templates because Our PowerPoint Templates and Slides are effectively colour coded to prioritise your plans They automatically highlight the sequence of events you desire. Download and present our Process and Flows PowerPoint Templates because You have gained great respect for your brilliant ideas. Use our PowerPoint Templates and Slides to strengthen and enhance your reputation.Use these PowerPoint slides for presentations relating to 3d, abstract, arrow, art, background, blank, business, chart, circle, concept, connection, cycle, development, diagram, direction, element, environment, exchange, finance, financial, flow, graph, graphic, graphic presentation, group, icon, illustration, investment, isolated, isometric, market, motion, movement, organization, passive income, perspective, presentation, process, process chart, recycle, report, ring, sign, step, stock, success, symbol, teamwork, text. The prominent colors used in the PowerPoint template are Blue, Gray, White. Design goals with our Business Process Flowchart Procedures For Monitoring And Controlling Ppt PowerPoint Templates. Download without worries with our money back guaranteee.
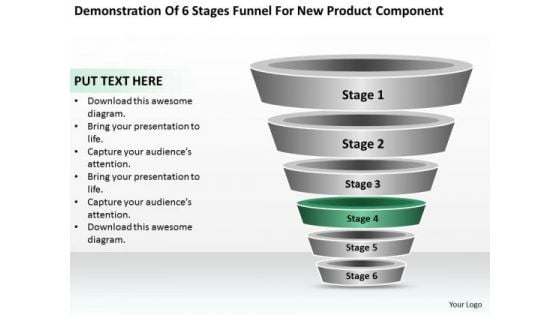
Business Architecture Diagrams PowerPoint Templates Backgrounds For Slides
We present our business architecture diagrams PowerPoint templates backgrounds for slides.Use our Architecture PowerPoint Templates because Our PowerPoint Templates and Slides are conceived by a dedicated team. Use them and give form to your wondrous ideas. Download and present our Layers PowerPoint Templates because You can Channelise the thoughts of your team with our PowerPoint Templates and Slides. Urge them to focus on the goals you have set. Present our Business PowerPoint Templates because Our PowerPoint Templates and Slides have the Brilliant backdrops. Guaranteed to illuminate the minds of your audience. Download our Shapes PowerPoint Templates because They will Put the wind in your sails. Skim smoothly over the choppy waters of the market. Download and present our Leadership PowerPoint Templates because Our PowerPoint Templates and Slides are topically designed to provide an attractive backdrop to any subject.Use these PowerPoint slides for presentations relating to content, data, icon, information, schema, import, model, base, organization, business, diagram, chart, select, entry, column, symbol, relational, management, connection, collection, dataflow, architecture, maintenance, edition, access, background, database, modification, storage. The prominent colors used in the PowerPoint template are Green , Gray, White. Find favour with the audience for your ideas. Our Business Architecture Diagrams PowerPoint Templates Backgrounds For Slides will extract approval.
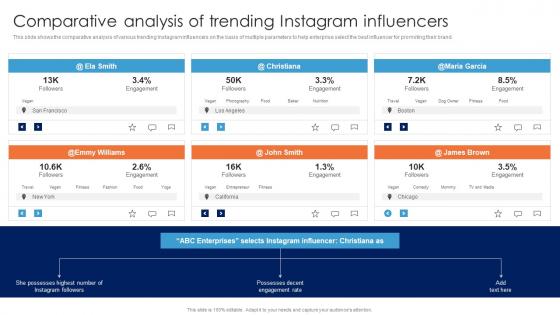
Comparative Analysis Of Trending Instagram Guide For Data Driven Advertising Themes Pdf
This slide shows the comparative analysis of various trending Instagram influencers on the basis of multiple parameters to help enterprise select the best influencer for promoting their brand.This modern and well-arranged Comparative Analysis Of Trending Instagram Guide For Data Driven Advertising Themes Pdf provides lots of creative possibilities. It is very simple to customize and edit with the Powerpoint Software. Just drag and drop your pictures into the shapes. All facets of this template can be edited with Powerpoint no extra software is necessary. Add your own material, put your images in the places assigned for them, adjust the colors, and then you can show your slides to the world, with an animated slide included. This slide shows the comparative analysis of various trending Instagram influencers on the basis of multiple parameters to help enterprise select the best influencer for promoting their brand.

Business People Vector 3d Man Standing Beside Info PowerPoint Slides
We present our business people vector 3d man standing beside info PowerPoint Slides.Use our Technology PowerPoint Templates because Our PowerPoint Templates and Slides will generate and maintain the level of interest you desire. They will create the impression you want to imprint on your audience. Download our Business PowerPoint Templates because Our PowerPoint Templates and Slides will let you Illuminate the road ahead to Pinpoint the important landmarks along the way. Use our Shapes PowerPoint Templates because Our PowerPoint Templates and Slides will bullet point your ideas. See them fall into place one by one. Download our Success PowerPoint Templates because Our PowerPoint Templates and Slides are created with admirable insight. Use them and give your group a sense of your logical mind. Present our Curves and Lines PowerPoint Templates because Our PowerPoint Templates and Slides will provide weight to your words. They will bring out the depth of your thought process.Use these PowerPoint slides for presentations relating to 3d, Advice, Agent, Answer, Ask, Assistance, Attention, Blue, Business, Communicate, Communication, Concept, Consultant, Consultation, Contact, Data, Help, Helpdesk, Human, Icon, Illustration, Info, Information, Inquiry, Internet, Isolated, Knowledge, Letter, Man, Media, Medium, Message, Notice, Person, Question, Request, Service, Sign, Solution, Support, Symbol, Technology, Text, Web, White, Word, Www. The prominent colors used in the PowerPoint template are Red, Yellow, Green. Create the aroma with our Business People Vector 3d Man Standing Beside Info PowerPoint Slides. Draw the crowds to your views.
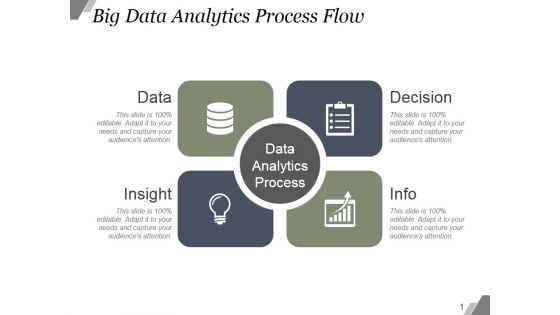
Big Data Analytics Process Flow Ppt PowerPoint Presentation Diagrams
This is a big data analytics process flow ppt powerpoint presentation diagrams. This is a four stage process. The stages in this process are data, decision, insight, info.
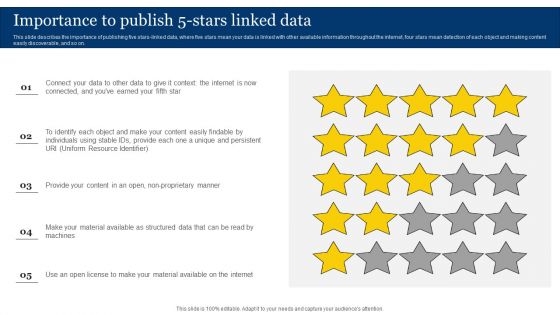
Importance To Publish 5 Stars Linked Data Integrating Linked Data To Enhance Operational Effectiveness Summary PDF
This slide describes the importance of publishing five stars-linked data, where five stars mean your data is linked with other available information throughout the internet, four stars mean detection of each object and making content easily discoverable, and so on.Boost your pitch with our creative Importance To Publish 5 Stars Linked Data Integrating Linked Data To Enhance Operational Effectiveness Summary PDF. Deliver an awe-inspiring pitch that will mesmerize everyone. Using these presentation templates you will surely catch everyones attention. You can browse the ppts collection on our website. We have researchers who are experts at creating the right content for the templates. So you do not have to invest time in any additional work. Just grab the template now and use them.
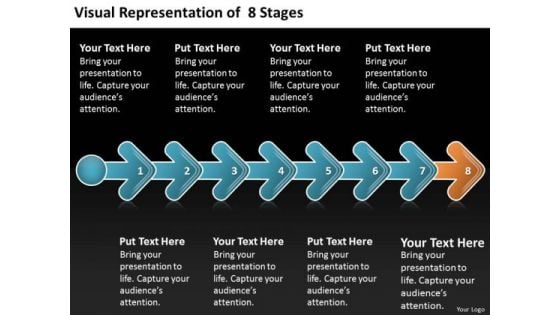
Visual Representation Of 8 Stages Business Plan Outlines Free PowerPoint Templates
We present our visual representation of 8 stages business plan outlines free PowerPoint templates.Use our Process and flow PowerPoint Templates because the plans are in your head, stage by stage, year by year. Present our Business PowerPoint Templates because it illustrates the city with a lasting tryst with resilience. You epitomise the qualities that give your city its fame. Download and present our Marketing PowerPoint Templates because The marketplace is the merger of your dreams and your ability. Present our Arrows PowerPoint Templates because it Saves your time as a prized possession, an ideal aid to give an ideal presentation. Use our Flow chart PowerPoint Templates because they are the tools that helped most of us evolve.Use these PowerPoint slides for presentations relating to Element, eps, finance, financial, graph,graphic, group, icon, illustration,income, increase, investment, isolated,isometric, market, motion, movement,passive, perspective, presentation,process, sales, sign, statistics, step,stock, success, symbol. The prominent colors used in the PowerPoint template are Blue, Orange, White. PowerPoint presentation experts tell us our visual representation of 8 stages business plan outlines free PowerPoint templates are Ritzy. PowerPoint presentation experts tell us our finance PowerPoint templates and PPT Slides are Great. You can be sure our visual representation of 8 stages business plan outlines free PowerPoint templates are Glamorous. You can be sure our group PowerPoint templates and PPT Slides will save the presenter time. PowerPoint presentation experts tell us our visual representation of 8 stages business plan outlines free PowerPoint templates are Sparkling. People tell us our finance PowerPoint templates and PPT Slides are Elevated. Draw up the contours of your plan. Outline your ideas with our Visual Representation Of 8 Stages Business Plan Outlines Free PowerPoint Templates.
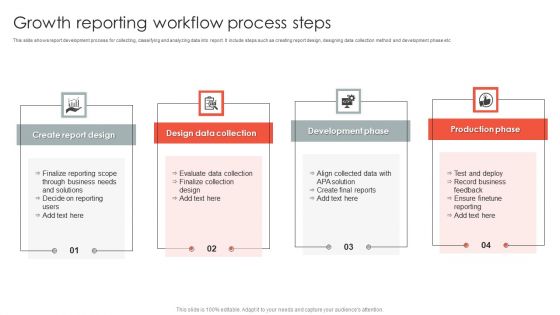
Growth Reporting Workflow Process Steps Guidelines PDF
This slide shows report development process for collecting, classifying and analyzing data into report. It include steps such as creating report design, designing data collection method and development phase etc. Presenting Growth Reporting Workflow Process Steps Guidelines PDF to dispense important information. This template comprises four stages. It also presents valuable insights into the topics including Design Data Collection, Development Phase, Production Phase. This is a completely customizable PowerPoint theme that can be put to use immediately. So, download it and address the topic impactfully.
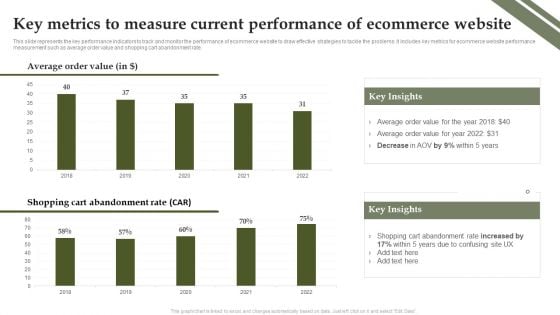
Analyzing And Deploying Effective CMS Key Metrics To Measure Current Performance Of Ecommerce Website Infographics PDF
This slide represents the key performance indicators to track and monitor the performance of ecommerce website to draw effective strategies to tackle the problems. It includes key metrics for ecommerce website performance measurement such as average order value and shopping cart abandonment rate. Do you know about Slidesgeeks Analyzing And Deploying Effective CMS Key Metrics To Measure Current Performance Of Ecommerce Website Infographics PDF These are perfect for delivering any kind od presentation. Using it, create PowerPoint presentations that communicate your ideas and engage audiences. Save time and effort by using our pre designed presentation templates that are perfect for a wide range of topic. Our vast selection of designs covers a range of styles, from creative to business, and are all highly customizable and easy to edit. Download as a PowerPoint template or use them as Google Slides themes.

Magnify Glass Ppt PowerPoint Presentation Show Themes
This is a magnify glass ppt powerpoint presentation show themes. This is a four stage process. The stages in this process are magnifier glass, research, business, marketing, focus.
Magnifying Glass Ppt PowerPoint Presentation Summary Themes
This is a magnifying glass ppt powerpoint presentation summary themes. This is a four stage process. The stages in this process are magnifier glass, research, business, marketing, focus.
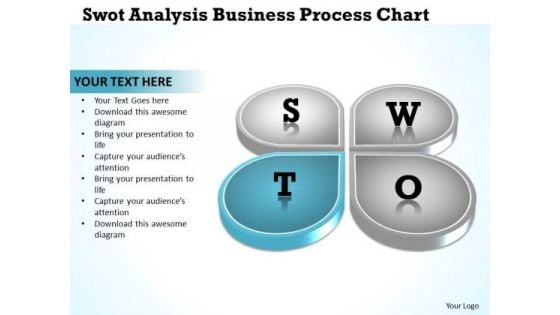
Business Diagram Examples PowerPoint Presentations Process Chart Templates
We present our business diagram examples powerpoint presentations process chart templates.Download our Advertising PowerPoint Templates because you can Adorn them with your ideas and thoughts. Download our Business PowerPoint Templates because maximising sales of your product is the intended destination. Use our Marketing PowerPoint Templates because The marketplace is the merger of your dreams and your ability. Download our Finance PowerPoint Templates because you have a handle on all the targets, a master of the game, the experienced and consummate juggler. Present our Shapes PowerPoint Templates because this is Aesthetically designed to make a great first impression this template highlights .Use these PowerPoint slides for presentations relating to Analysis, Business, Concept, Design, Diagram, Direction, Goals, Guide, Icon, Idea, Management, Model, Opportunity, Organization, Performance, Plan, Process, Project, Representation, Resource, Strategy, Swot. The prominent colors used in the PowerPoint template are Blue, Black, Gray. PowerPoint presentation experts tell us our business diagram examples powerpoint presentations process chart templates are Efficacious. Professionals tell us our Diagram PowerPoint templates and PPT Slides are Endearing. People tell us our business diagram examples powerpoint presentations process chart templates provide great value for your money. Be assured of finding the best projection to highlight your words. We assure you our Diagram PowerPoint templates and PPT Slides are Attractive. PowerPoint presentation experts tell us our business diagram examples powerpoint presentations process chart templates are Graceful. Professionals tell us our Direction PowerPoint templates and PPT Slides are Splendid. Make our Business Diagram Examples PowerPoint Presentations Process Chart Templates your calling card. Your thoughts will find open doors.
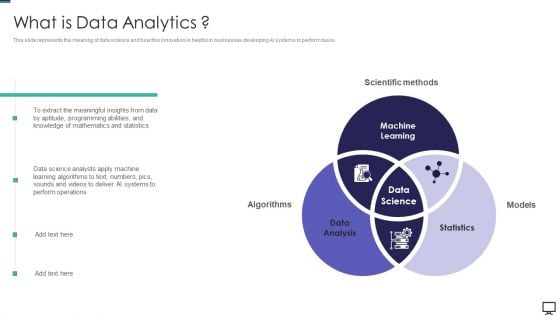
What Is Data Analytics Ppt Professional Slide PDF
This slide represents the meaning of data science and how this innovation is helpful in businesses developing AI systems to perform tasks. Presenting what is data analytics ppt professional slide pdf to provide visual cues and insights. Share and navigate important information on three stages that need your due attention. This template can be used to pitch topics like data analysis, statistics, machine learning. In addtion, this PPT design contains high resolution images, graphics, etc, that are easily editable and available for immediate download.

3d Timeline Flow Diagram Of 10 Stages Ppt Arrows Chart Software PowerPoint Templates
We present our 3d timeline flow diagram of 10 stages ppt Arrows Chart Software PowerPoint templates.Use our Circle Charts PowerPoint Templates because you can Master them all and you have it made. Download and present our Arrows PowerPoint Templates because you can Explain the contribution of each of the elements and how they provide impetus to the next phase. Download and present our Business PowerPoint Templates because watch the excitement levels rise as they realise their worth. Present our Shapes PowerPoint Templates because it gives a core idea about various enveloping layers. Download our Flow Charts PowerPoint Templates because spreading the light of knowledge around you will clear the doubts and enlighten the questioning minds with your brilliance and ability.Use these PowerPoint slides for presentations relating to abstract, action, attention, business, chart, clipart, commerce, concept, conceptual, corporate, customer, design, desire, diagram, flow, goals, guide, guidelines, hierarchy, icon, idea, illustration, interest, manage, management, map, marketing, mba, mind, mindmap, mission, model, organization, performance, plans, process, project, representation, resource, sales, steps, strategy, success, tactics, theoretical, timeline, tool, vision. The prominent colors used in the PowerPoint template are Orange, Yellow, Gray. Customers tell us our 3d timeline flow diagram of 10 stages ppt Arrows Chart Software PowerPoint templates are second to none. PowerPoint presentation experts tell us our clipart PowerPoint templates and PPT Slides are Great. People tell us our 3d timeline flow diagram of 10 stages ppt Arrows Chart Software PowerPoint templates are Bright. People tell us our chart PowerPoint templates and PPT Slides are Detailed. Customers tell us our 3d timeline flow diagram of 10 stages ppt Arrows Chart Software PowerPoint templates are Precious. People tell us our business PowerPoint templates and PPT Slides are topically designed to provide an attractive backdrop to any subject. Operate efficiently with our 3d Timeline Flow Diagram Of 10 Stages Ppt Arrows Chart Software PowerPoint Templates. Download without worries with our money back guaranteee.

Table Of Prescriptive Model Deployment Timeline Data Analytics SS V
This slide provides a deployment table of prescriptive model aimed at highlighting movement of models through various phases. The basis of deployment are stage, start and end date, manager name with resources utilized.The Table Of Prescriptive Model Deployment Timeline Data Analytics SS V is a compilation of the most recent design trends as a series of slides. It is suitable for any subject or industry presentation, containing attractive visuals and photo spots for businesses to clearly express their messages. This template contains a variety of slides for the user to input data, such as structures to contrast two elements, bullet points, and slides for written information. Slidegeeks is prepared to create an impression. This slide provides a deployment table of prescriptive model aimed at highlighting movement of models through various phases. The basis of deployment are stage, start and end date, manager name with resources utilized.
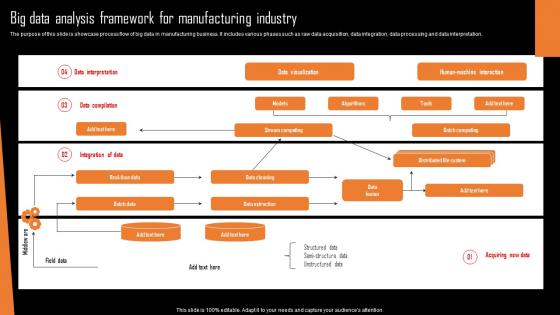
Big Data Analysis Framework For Manufacturing Industry Background Pdf
The purpose of this slide is showcase process flow of big data in manufacturing business. It includes various phases such as raw data acquisition, data integration, data processing and data interpretation.Showcasing this set of slides titled Big Data Analysis Framework For Manufacturing Industry Background Pdf The topics addressed in these templates are Data Visualization, Data Extraction, Data Cleaning All the content presented in this PPT design is completely editable. Download it and make adjustments in color, background, font etc. as per your unique business setting. The purpose of this slide is showcase process flow of big data in manufacturing business. It includes various phases such as raw data acquisition, data integration, data processing and data interpretation.
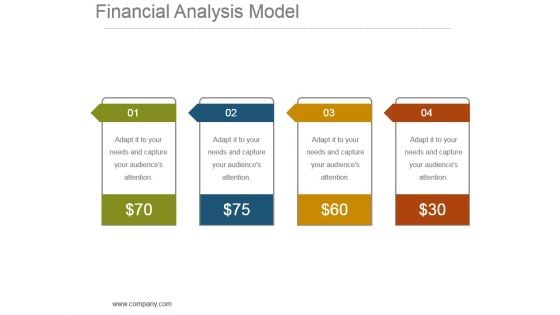
Financial Analysis Model Powerpoint Slide Show
This is a financial analysis model powerpoint slide show. This is a four stage process. The stages in this process are dollar, symbol, business, marketing, finance.
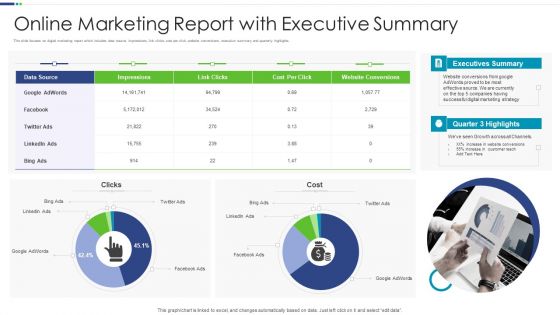
Online Marketing Report With Executive Summary Designs PDF
This slide focuses on digital marketing report which includes data source, impressions, link clicks, cost per click, website conversions, executive summary and quarterly highlights.Pitch your topic with ease and precision using this Online Marketing Report With Executive Summary Designs PDF This layout presents information on Executives Summary, Digital Marketing, Conversions It is also available for immediate download and adjustment. So, changes can be made in the color, design, graphics or any other component to create a unique layout.
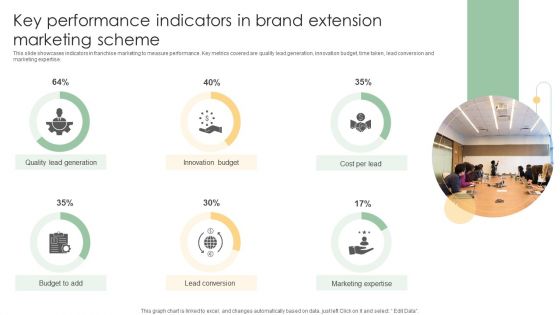
Key Performance Indicators In Brand Extension Marketing Scheme Ideas PDF
This slide showcases indicators in franchise marketing to measure performance. Key metrics covered are quality lead generation, innovation budget, time taken, lead conversion and marketing expertise.Pitch your topic with ease and precision using this Key Performance Indicators In Brand Extension Marketing Scheme Ideas PDF. This layout presents information on Quality Lead Generation, Innovation Budget, Lead Conversion. It is also available for immediate download and adjustment. So, changes can be made in the color, design, graphics or any other component to create a unique layout.
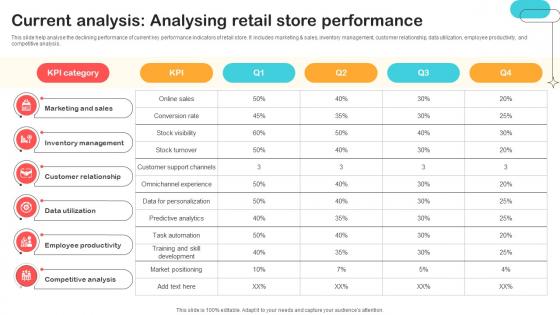
Current Analysis Analysing Retail Store Performance Optimizing Retail Operations With Digital DT SS V
This slide help analyse the declining performance of current key performance indicators of retail store. It includes marketing and sales, inventory management, customer relationship, data utilization, employee productivity, and competitive analysis.Whether you have daily or monthly meetings, a brilliant presentation is necessary. Current Analysis Analysing Retail Store Performance Optimizing Retail Operations With Digital DT SS V can be your best option for delivering a presentation. Represent everything in detail using Current Analysis Analysing Retail Store Performance Optimizing Retail Operations With Digital DT SS V and make yourself stand out in meetings. The template is versatile and follows a structure that will cater to your requirements. All the templates prepared by Slidegeeks are easy to download and edit. Our research experts have taken care of the corporate themes as well. So, give it a try and see the results. This slide help analyse the declining performance of current key performance indicators of retail store. It includes marketing and sales, inventory management, customer relationship, data utilization, employee productivity, and competitive analysis.
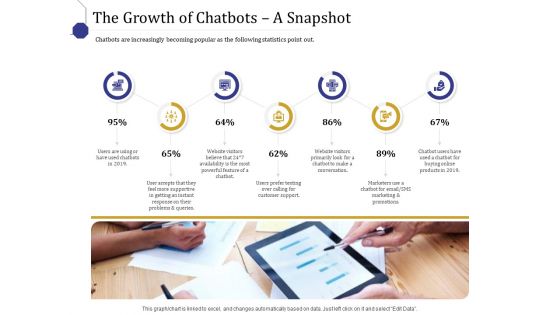
Boost Marketing And Sales Through Live Chat The Growth Of Chatbots A Snapshot Ppt File Slide Download PDF
Deliver and pitch your topic in the best possible manner with this boost marketing and sales through live chat the growth of chatbots a snapshot ppt file slide download pdf. Use them to share invaluable insights on the growth of chatbots a snapshot and impress your audience. This template can be altered and modified as per your expectations. So, grab it now.
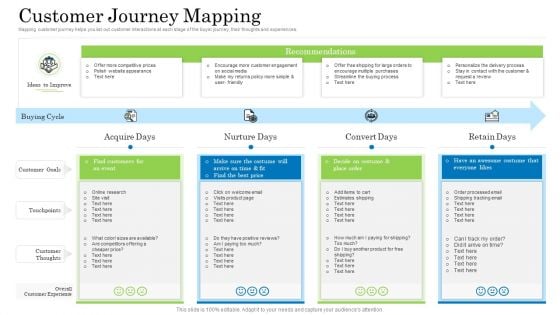
Customer Behavioral Data And Analytics Customer Journey Mapping Themes PDF
Mapping customer journey helps you list out customer interactions at each stage of the buyer journey, their thoughts and experiences. This is a customer behavioral data and analytics customer journey mapping themes pdf template with various stages. Focus and dispense information on four stages using this creative set, that comes with editable features. It contains large content boxes to add your information on topics like customer journey mapping. You can also showcase facts, figures, and other relevant content using this PPT layout. Grab it now.
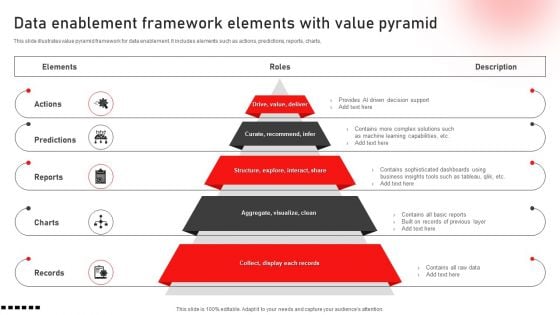
Data Enablement Framework Elements With Value Pyramid Portrait PDF
This slide illustrates value pyramid framework for data enablement. It includes elements such as actions, predictions, reports, charts. Presenting Data Enablement Framework Elements With Value Pyramid Portrait PDF to dispense important information. This template comprises five stages. It also presents valuable insights into the topics including Actions, Predictions, Reports. This is a completely customizable PowerPoint theme that can be put to use immediately. So, download it and address the topic impactfully.
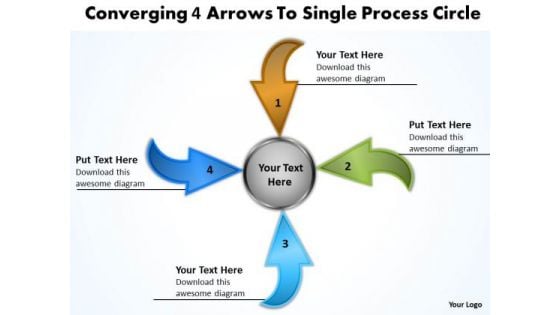
Converging 4 Arrows To Single Process Circle Pie Diagram PowerPoint Templates
We present our converging 4 arrows to single process circle Pie Diagram PowerPoint templates.Download and present our Arrows PowerPoint Templates because you will be able to Highlight your ideas broad-based on strong fundamentals and illustrate how they step by step acheive the set growth factor. Use our Circle Charts PowerPoint Templates because you can present your opinions in this field using our impressive templates. Download our Shapes PowerPoint Templates because displaying your ideas and highlighting your ability will accelerate the growth of your company and yours. Download and present our Business PowerPoint Templates because your ideas too are pinpointedly focused on you goals. Present our Flow Charts PowerPoint Templates because you can Unravel the desired and essential elements of your overall strategy.Use these PowerPoint slides for presentations relating to arrow, arrowheads, badge, banner, blue, button, cerulean, cobalt, colored, colorful, connection, cursor, cyan, design element, designator, directional, download, emblem, gray shadow, green, icon, indicator, interface, internet, link, load, magenta, marker, matted, menu tool, navigation panel, next, orientation, page site, pictogram, pink, pointer, red, right, satined, sign, signpost, smooth, symbol, upload, vector illustration, web, web 2.0, white background. The prominent colors used in the PowerPoint template are Blue, Brown, Green. Presenters tell us our converging 4 arrows to single process circle Pie Diagram PowerPoint templates are Nostalgic. You can be sure our banner PowerPoint templates and PPT Slides are Radiant. Professionals tell us our converging 4 arrows to single process circle Pie Diagram PowerPoint templates are Stylish. People tell us our colored PowerPoint templates and PPT Slides will generate and maintain the level of interest you desire. They will create the impression you want to imprint on your audience. People tell us our converging 4 arrows to single process circle Pie Diagram PowerPoint templates are Handsome. Professionals tell us our banner PowerPoint templates and PPT Slides are Efficient. Carry your thoughts on our Converging 4 Arrows To Single Process Circle Pie Diagram PowerPoint Templates. They will take them that much further.

Telecom Technology Industry Report With Growth Drivers Pictures PDF
The following slide highlights telecommunication technology industry report with growth drivers such as application services, BPO, digital operations, cybersecurity, data analytics, automation, robotics, business technology and consulting etc. Showcasing this set of slides titled Telecom Technology Industry Report With Growth Drivers Pictures PDF. The topics addressed in these templates are Application Services, Cybersecurity Data, Other Market Drivers. All the content presented in this PPT design is completely editable. Download it and make adjustments in color, background, font etc. as per your unique business setting.
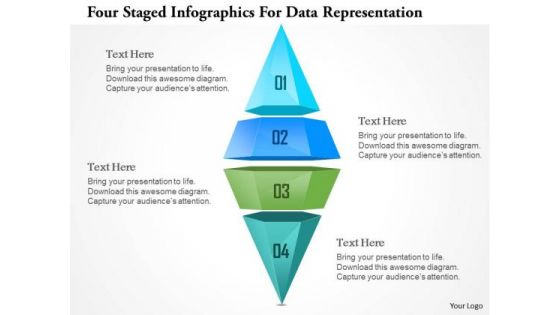
Busines Diagram Four Staged Ingographics For Data Representation Ppt Template
This business diagram has been designed with graphic of four staged info graphics. This info graphic can be used for data representation. Deliver amazing presentations to mesmerize your audience.
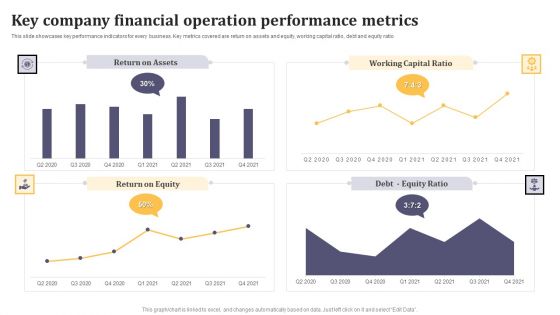
Key Company Financial Operation Performance Metrics Ppt Infographic Template Example Introduction PDF
This slide showcases key performance indicators for every business. Key metrics covered are return on assets and equity, working capital ratio, debt and equity ratio. Showcasing this set of slides titled Key Company Financial Operation Performance Metrics Ppt Infographic Template Example Introduction PDF. The topics addressed in these templates are Return on Assets, Working Capital Ratio, Return on Equity. All the content presented in this PPT design is completely editable. Download it and make adjustments in color, background, font etc. as per your unique business setting.
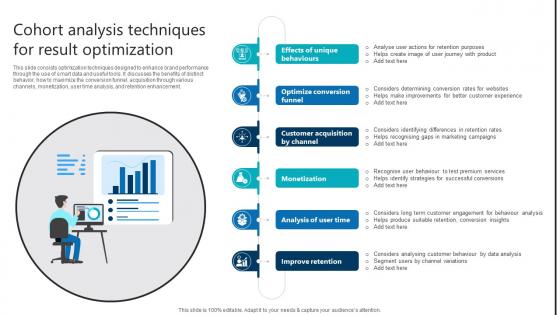
Cohort Analysis Techniques For Result Optimization Product Analytics Implementation Data Analytics V
This slide consists optimization techniques designed to enhance brand performance through the use of smart data and useful tools. It discusses the benefits of distinct behavior, how to maximize the conversion funnel, acquisition through various channels, monetization, user time analysis, and retention enhancement. Whether you have daily or monthly meetings, a brilliant presentation is necessary. Cohort Analysis Techniques For Result Optimization Product Analytics Implementation Data Analytics V can be your best option for delivering a presentation. Represent everything in detail using Cohort Analysis Techniques For Result Optimization Product Analytics Implementation Data Analytics V and make yourself stand out in meetings. The template is versatile and follows a structure that will cater to your requirements. All the templates prepared by Slidegeeks are easy to download and edit. Our research experts have taken care of the corporate themes as well. So, give it a try and see the results. This slide consists optimization techniques designed to enhance brand performance through the use of smart data and useful tools. It discusses the benefits of distinct behavior, how to maximize the conversion funnel, acquisition through various channels, monetization, user time analysis, and retention enhancement.
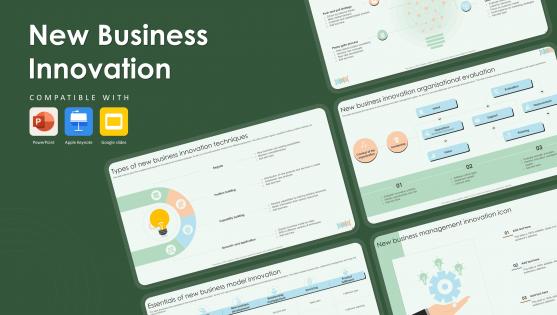
New Bussiness Innovation Powerpoint Ppt Template Bundles
Deliver a credible and compelling presentation by deploying this New Bussiness Innovation Powerpoint Ppt Template Bundles. Intensify your message with the right graphics, images, icons, etc. presented in this complete deck. This PPT template is a great starting point to convey your messages and build a good collaboration. The twenty one slides added to this PowerPoint slideshow helps you present a thorough explanation of the topic. You can use it to study and present various kinds of information in the form of stats, figures, data charts, and many more. This New Bussiness Innovation Powerpoint Ppt Template Bundles PPT slideshow is available for use in standard and widescreen aspects ratios. So, you can use it as per your convenience. Apart from this, it can be downloaded in PNG, JPG, and PDF formats, all completely editable and modifiable. The most profound feature of this PPT design is that it is fully compatible with Google Slides making it suitable for every industry and business domain. Introducing our ground-breaking New corporate Innovation PowerPoint PPT presentation,your indispensable instrument for promoting innovation and driving success in todays changing corporate world. Dive into the most recent approaches that drive fresh business innovation,allowing organisations to stay ahead of the competition. Discover the fundamental building blocks of successful new company innovation,from ideation and prototyping to market launch and scaling.
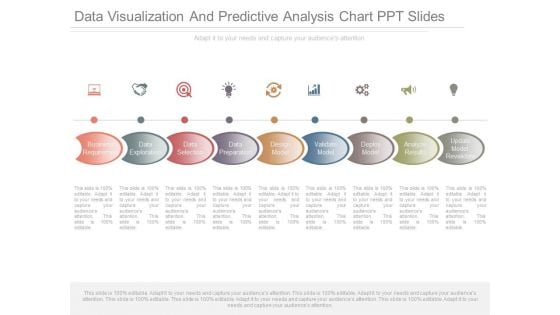
Data Visualization And Predictive Analysis Chart Ppt Slides
This is a data visualization and predictive analysis chart ppt slides. This is a nine stage process. The stages in this process are business requirement, data exploration, data selection, data preparation, design model, validate model, deploy model, analyze results, update model, revalidate.
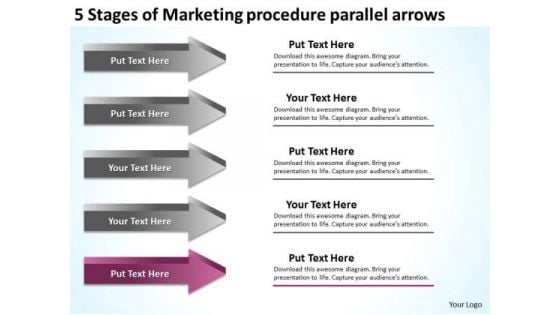
Stages Of Marketing Procedure Parallel Arrows Ppt Business Action Plan Template PowerPoint Slides
We present our stages of marketing procedure parallel arrows ppt business action plan template PowerPoint Slides.Download and present our Marketing PowerPoint Templates because customer satisfaction is a mantra of the marketplace. Building a loyal client base is an essential element of your business. Download and present our Success PowerPoint Templates because it demonstrates to your audience how the best and most refined ideas pass through. Download and present our Business PowerPoint Templates because it helps you to project your enthusiasm and single mindedness to your colleagues. Download and present our Finance PowerPoint Templates because you have the plans ready for them to absorb and understand. Download our Arrows PowerPoint Templates because colours generate instant reactions in our brains.Use these PowerPoint slides for presentations relating to 3d, Accounting, Arrow, Art, Bar, Blue, Business, Calculation, Chart, Collection, Company, Design Elements, Diagram, Directive, Expense, Finance, Firm, Forecast, Future, Gain, Graph, Grow, Growth, Icon, Illustration, Income, Line, Market, Measure, Objects, Office, Profit, Progress, Rate, Set, Statistic, Stock, Success, Two, Up, Vector. The prominent colors used in the PowerPoint template are Magenta, Gray, Black. Customers tell us our stages of marketing procedure parallel arrows ppt business action plan template PowerPoint Slides will make you look like a winner. Use our Art PowerPoint templates and PPT Slides are Beautiful. PowerPoint presentation experts tell us our stages of marketing procedure parallel arrows ppt business action plan template PowerPoint Slides are Majestic. People tell us our Arrow PowerPoint templates and PPT Slides are Tranquil. We assure you our stages of marketing procedure parallel arrows ppt business action plan template PowerPoint Slides are Energetic. People tell us our Business PowerPoint templates and PPT Slides are Festive. Extract assent with our Stages Of Marketing Procedure Parallel Arrows Ppt Business Action Plan Template PowerPoint Slides. The audience will become agreeable.
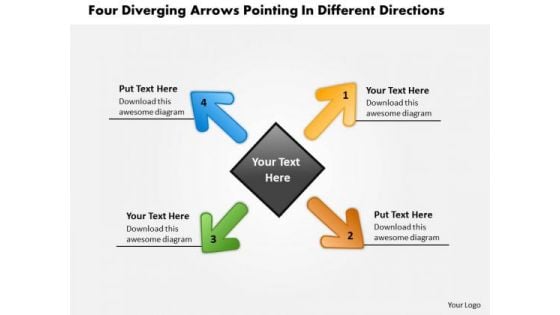
Arrows Pointing Different Directions Circular Flow Chart PowerPoint Templates
We present our arrows pointing different directions Circular Flow Chart PowerPoint templates.Download our Arrows PowerPoint Templates because you can Amplify your views, ideas and thoughts from very basic aspects to the highly technical and complicated issus using this template as a tool. Download our Business PowerPoint Templates because you can Flutter your wings and enchant the world. Impress them with the innate attractiveness of your thoughts and words. Download our Shapes PowerPoint Templates because this slide depicts the occasion for gifting and giving. Download our Metaphors-Visual Concepts PowerPoint Templates because you can Present your views on the methods using our self-explanatory templates. Use our Flow Charts PowerPoint Templates because it Saves your time as a prized possession, an ideal aid to give an ideal presentation.Use these PowerPoint slides for presentations relating to arrow, arrowheads, badge, banner, blue, button, cerulean, cobalt, colored, colorful, connection, cursor, cyan, design element, designator, directional, download, emblem, gray shadow, green, icon, indicator, interface, internet, link, load, magenta, marker, matted, menu tool, navigation panel, next, orientation, page site, pictogram, pink, pointer, red, right, satined, sign, signpost, smooth, symbol, upload, vector illustration, web, web 2.0, white background. The prominent colors used in the PowerPoint template are Green, Blue, Orange. Presenters tell us our arrows pointing different directions Circular Flow Chart PowerPoint templates have awesome images to get your point across. You can be sure our colored PowerPoint templates and PPT Slides are Functional. Professionals tell us our arrows pointing different directions Circular Flow Chart PowerPoint templates are visually appealing. People tell us our banner PowerPoint templates and PPT Slides are Nice. People tell us our arrows pointing different directions Circular Flow Chart PowerPoint templates are Efficacious. Professionals tell us our blue PowerPoint templates and PPT Slides are Royal. Burst through the ceiling with our Arrows Pointing Different Directions Circular Flow Chart PowerPoint Templates. Rise strongly above created barriers.
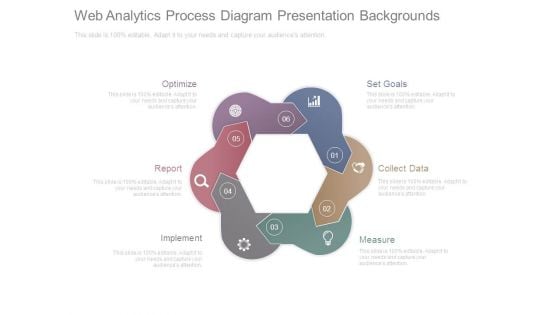
Web Analytics Process Diagram Presentation Backgrounds
This is a web analytics process diagram presentation backgrounds. This is a six stage process. The stages in this process are optimize, report, implement, measure, collect data, set goals.
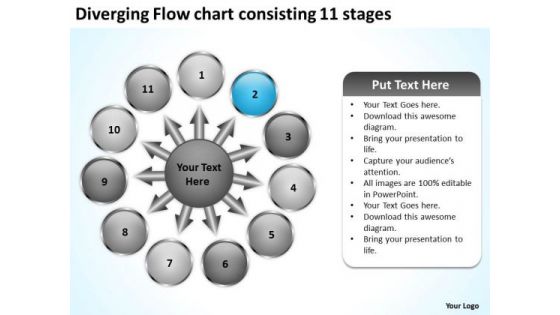
Diverging Flow Chart Consisting 11 Stages Business Circular Process Diagram PowerPoint Slides
We present our diverging flow chart consisting 11 stages business Circular Process Diagram PowerPoint Slides.Download our Business PowerPoint Templates because spell out your advertising plans to increase market share. The feedback has been positive and productive. Download our Circle Charts PowerPoint Templates because this amazing layout demonstrates how they all combine to form the final product. Use our Arrows PowerPoint Templates because this diagram helps you to harness the opportunities, celebrate your performance till date and focus on greater growth and expansion in coming years. Download and present our Shapes PowerPoint Templates because there is a crucial aspect that requires extra attention. Present our Flow charts PowerPoint Templates because knowledge is power goes the popular saying.Use these PowerPoint slides for presentations relating to Arrows, blank, business, central, centralized, chart, circle, circular, circulation concept, conceptual, converging, design, diagram, empty, executive, icon, idea illustration, management, map, mapping, moa, model, numbers, organization outwards, pointing, procedure, process, radial, radiating, relationship, resource sequence, sequential, seven, square, strategy, template. The prominent colors used in the PowerPoint template are Blue, Gray, White. Presenters tell us our diverging flow chart consisting 11 stages business Circular Process Diagram PowerPoint Slides are Detailed. Presenters tell us our business PowerPoint templates and PPT Slides are Luxuriant. PowerPoint presentation experts tell us our diverging flow chart consisting 11 stages business Circular Process Diagram PowerPoint Slides are Whimsical. We assure you our central PowerPoint templates and PPT Slides are Fun. Customers tell us our diverging flow chart consisting 11 stages business Circular Process Diagram PowerPoint Slides are Elegant. People tell us our central PowerPoint templates and PPT Slides are designed by professionals Convince the audience of the feasibility of your ideas. Ensure comprehension with our Diverging Flow Chart Consisting 11 Stages Business Circular Process Diagram PowerPoint Slides.
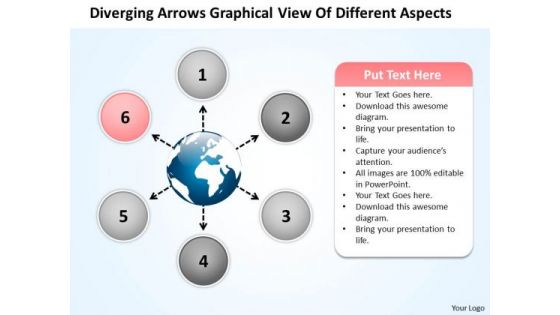
Arrows Graphical View Of Different Aspects Circlar Charts And Diagrams PowerPoint Templates
We present our arrows graphical view of different aspects circlar Charts and Diagrams PowerPoint templates.Use our Business PowerPoint Templates because like the famed William Tell, they put aside all emotions and concentrate on the target. Download our Flow Charts PowerPoint Templates because you can Amplify your views, ideas and thoughts from very basic aspects to the highly technical and complicated issus using this template as a tool. Present our Ring Charts PowerPoint Templates because this slide shows each path to the smallest detail. Present our Shapes PowerPoint Templates because it describes the benefits of healthy food habits and lifestyles in respect of vital organs of the human anatomy. Use our Process and Flows PowerPoint Templates because this diagram helps you to harness the opportunities, celebrate your performance till date and focus on greater growth and expansion in coming years.Use these PowerPoint slides for presentations relating to Arrows, Blank, Business, Chart, Circle, Circular, Circulation, Concept, Conceptual, Converging, Design, Diagram, Empty, Executive, Five, Icon, Illustration, Management, Pointing, Procedure, Process, Relationship, Resource, Sequence, Sequential, Strategy, Template. The prominent colors used in the PowerPoint template are Pink, Gray, White. Presenters tell us our arrows graphical view of different aspects circlar Charts and Diagrams PowerPoint templates help you meet deadlines which are an element of today's workplace. Just browse and pick the slides that appeal to your intuitive senses. We assure you our Circulation PowerPoint templates and PPT Slides are Perfect. Presenters tell us our arrows graphical view of different aspects circlar Charts and Diagrams PowerPoint templates are Nifty. Use our Circulation PowerPoint templates and PPT Slides are Perfect. We assure you our arrows graphical view of different aspects circlar Charts and Diagrams PowerPoint templates are Detailed. You can be sure our Business PowerPoint templates and PPT Slides are Perfect. They say appropriate facial expressions aid communication. Our Arrows Graphical View Of Different Aspects Circlar Charts And Diagrams PowerPoint Templates can be effective too.
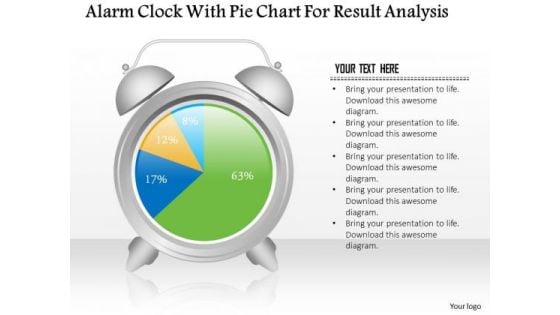
Business Diagram Alarm Clock With Pie Chart For Result Analysis PowerPoint Slide
This business slide displays alarm clock with pie chart. This diagram is a data visualization tool that gives you a simple way to present statistical information. This slide helps your audience examine and interpret the data you present.
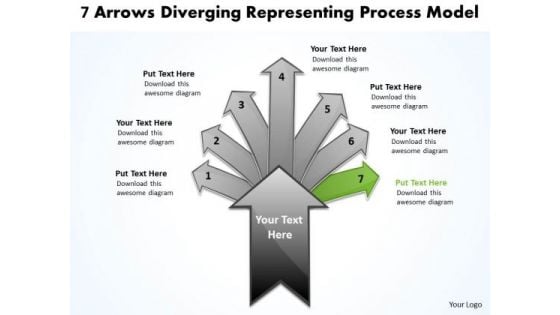
7 Arrows Diverging Representing Process Model Cycle Flow PowerPoint Templates
We present our 7 arrows diverging representing process model Cycle Flow PowerPoint templates.Use our Sale PowerPoint Templates because they will Amplify your thoughts via our appropriate templates. Download and present our Arrows PowerPoint Templates because you can put it up there for all to see. Present our Process and Flows PowerPoint Templates because our presentation designs are for those on the go. Present our Business PowerPoint Templates because this template can project the path to sucess that you have charted. Use our Shapes PowerPoint Templates because it Educates your team with your thoughts and logic.Use these PowerPoint slides for presentations relating to Abstract, Arrow, Art, Artistic, Background, Banner, Boost, Box, Business, Clip Art, Color, Colorful, Concept, Cover, Creative, Decide, Decision, Design, Direction, Finance, Futuristic, Graphic, Icon, Idea, Illustration, Increase, Info, Information, Journey, Label, Modern, Path, Pattern, Pop, Print, Process, Sale, Solution, Statistic, Sticker, Stylish, Template. The prominent colors used in the PowerPoint template are Green, Gray, Black. PowerPoint presentation experts tell us our 7 arrows diverging representing process model Cycle Flow PowerPoint templates are Graceful. People tell us our Artistic PowerPoint templates and PPT Slides are Magical. People tell us our 7 arrows diverging representing process model Cycle Flow PowerPoint templates are Appealing. Presenters tell us our Box PowerPoint templates and PPT Slides are Romantic. Customers tell us our 7 arrows diverging representing process model Cycle Flow PowerPoint templates are Playful. The feedback we get is that our Boost PowerPoint templates and PPT Slides have awesome images to get your point across. The earth is facing an energy crisis. Contribute to the answers with our 7 Arrows Diverging Representing Process Model Cycle Flow PowerPoint Templates.
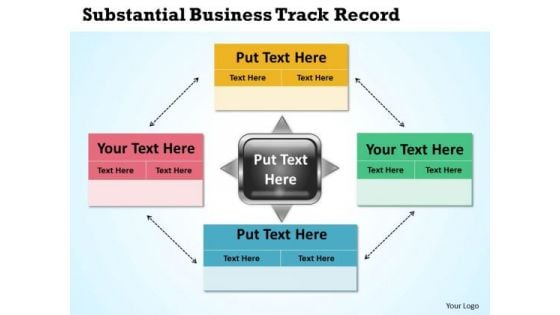
Business Charts Examples PowerPoint Templates Track Record
We present our business charts examples powerpoint templates track record.Present our Arrows PowerPoint Templates because a lot of hard work has gone in and you are almost there. Download and present our Boxes PowerPoint Templates because it will demonstrate the strength of character under severe stress. Shine the torch ahead and bring the light to shine on all. Use our Business PowerPoint Templates because this layout helps you to bring some important aspects of your business process to the notice of all concerned. Streamline the flow of information across the board. Download and present our Shapes PowerPoint Templates because we all know that alphabetical order is a time honoured concept. Use our Finance PowerPoint Templates because it shows to your group how they mesh together to drive the whole.Use these PowerPoint slides for presentations relating to Abstract, Background, Blocks, Business, Chart, Color, Concept, Construction, Diagram, Financial, Graph, Green, Group, Growth, Hierarchy, Icon, Illustration, Increase, Innovation, Isolated, Level, Management, Object, Orange, Part, Performance, Progress, Pyramid, Red, Reflection, Results, Shape, Sliced, Stage, Status, Step, Strategy, Structure, Success, Support, Symbol, System, Team, Teamwork. The prominent colors used in the PowerPoint template are Yellow, Red, Green. PowerPoint presentation experts tell us our business charts examples powerpoint templates track record are Spiffy. Professionals tell us our Blocks PowerPoint templates and PPT Slides are the best it can get when it comes to presenting. People tell us our business charts examples powerpoint templates track record are Bright. We assure you our Diagram PowerPoint templates and PPT Slides are Spiffy. PowerPoint presentation experts tell us our business charts examples powerpoint templates track record will impress their bosses and teams. Professionals tell us our Chart PowerPoint templates and PPT Slides are Endearing. Test out the effect of your thoughts. Our Business Charts Examples PowerPoint Templates Track Record will assist in the experiment.
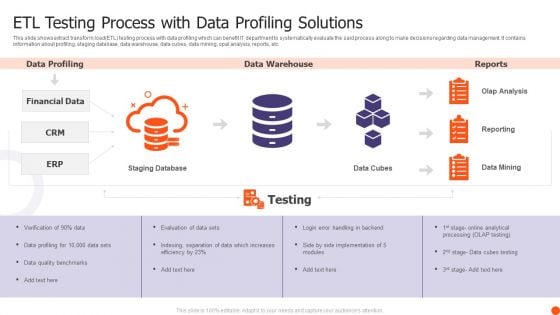
ETL Testing Process With Data Profiling Solutions Ppt Inspiration Backgrounds PDF
This slide shows extract transform load ETL testing process with data profiling which can benefit IT department to systematically evaluate the said process along to make decisions regarding data management. It contains information about profiling, staging database, data warehouse, data cubes, data mining, opal analysis, reports, etc. Presenting ETL Testing Process With Data Profiling Solutions Ppt Inspiration Backgrounds PDF to dispense important information. This template comprises one stages. It also presents valuable insights into the topics including Financial Data, Data Profiling, Data Warehouse. This is a completely customizable PowerPoint theme that can be put to use immediately. So, download it and address the topic impactfully.
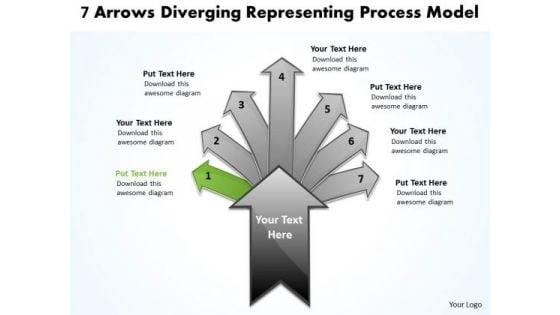
7 Arrows Diverging Representing Process Model Relative Cycle Network PowerPoint Slides
We present our 7 arrows diverging representing process model Relative Cycle Network PowerPoint Slides.Download and present our Sale PowerPoint Templates because you can Ring them out loud with your brilliant ideas. Download our Arrows PowerPoint Templates because this diagram is designed to help your audience to develop their thoughts along the way. Download our Process and Flows PowerPoint Templates because you are the Champion of your team shall anoint. Download our Business PowerPoint Templates because it illustrates the city with a lasting tryst with resilience. You epitomise the qualities that give your city its fame. Download and present our Shapes PowerPoint Templates because you have the ability to judge Which out of late have been proving to be a hassle.Use these PowerPoint slides for presentations relating to Abstract, Arrow, Art, Artistic, Background, Banner, Boost, Box, Business, Clip Art, Color, Colorful, Concept, Cover, Creative, Decide, Decision, Design, Direction, Finance, Futuristic, Graphic, Icon, Idea, Illustration, Increase, Info, Information, Journey, Label, Modern, Path, Pattern, Pop, Print, Process, Sale, Solution, Statistic, Sticker, Stylish, Template. The prominent colors used in the PowerPoint template are Green, Gray, Black. PowerPoint presentation experts tell us our 7 arrows diverging representing process model Relative Cycle Network PowerPoint Slides effectively help you save your valuable time. People tell us our Art PowerPoint templates and PPT Slides are Fashionable. People tell us our 7 arrows diverging representing process model Relative Cycle Network PowerPoint Slides are Exuberant. Presenters tell us our Banner PowerPoint templates and PPT Slides will help you be quick off the draw. Just enter your specific text and see your points hit home. Customers tell us our 7 arrows diverging representing process model Relative Cycle Network PowerPoint Slides are designed by professionals The feedback we get is that our Banner PowerPoint templates and PPT Slides will save the presenter time. Expose the facts and figures with our 7 Arrows Diverging Representing Process Model Relative Cycle Network PowerPoint Slides. Remove the fig leaf with your thoughts.
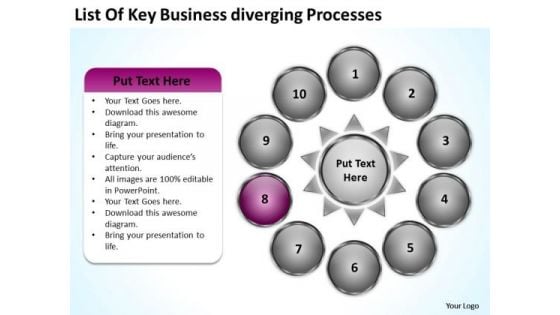
PowerPoint Templates Download Diverging Processes Cyle Circular Flow Diagram
We present our powerpoint templates download diverging processes cyle Circular Flow Diagram.Present our Business PowerPoint Templates because profit levels have been steady over the recent past. Spread your heightened excitement to others in the room. Present our Circle Charts PowerPoint Templates because you have it all down to a nicety, slice by slice, layer by layer. Download and present our Success PowerPoint Templates because the success of your venture depends on the performance of every team member. Download our Shapes PowerPoint Templates because it helps to anticipate the doubts and questions in the minds of your colleagues and enlighten them with your inspired strategy to garner desired success. Use our Flow Charts PowerPoint Templates because you can Show them how you can save the day.Use these PowerPoint slides for presentations relating to Arrows, Blank, Business, Central, Centralized, Chart, Circle, Circular, Circulation, Concept, Conceptual, Converging, Diagram, Empty, Executive, Icon, Idea, Illustration, numbers, Organization, Outwards, Pointing, Procedure, Process, Six, Strategy, Template. The prominent colors used in the PowerPoint template are Pink, Gray, Black. Professionals tell us our powerpoint templates download diverging processes cyle Circular Flow Diagram are Radiant. Customers tell us our Chart PowerPoint templates and PPT Slides are Fantastic. Use our powerpoint templates download diverging processes cyle Circular Flow Diagram are Radiant. The feedback we get is that our Circular PowerPoint templates and PPT Slides are Elevated. Professionals tell us our powerpoint templates download diverging processes cyle Circular Flow Diagram are Endearing. Presenters tell us our Circular PowerPoint templates and PPT Slides are Graceful. Economise on the time you have. Equip yourself with our PowerPoint Templates Download Diverging Processes Cyle Circular Flow Diagram.
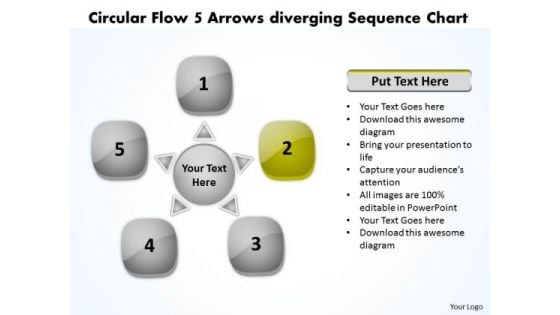
Circular Flow 5 Arrows Diverging Sequence Chart Charts And Networks PowerPoint Slides
We present our circular flow 5 arrows diverging sequence chart Charts and Networks PowerPoint Slides.Use our Circle Charts PowerPoint Templates because you have had your share of being a goldfish in a small bowl.you are ready to launch out and spread your wings. Download our Arrows PowerPoint Templates because the chart is designed to give you the flavour of the kind of tools you may need and the work that is performed in the lifecycle. Present our Shapes PowerPoint Templates because you require care and diligence to function well. Use our Ring Charts PowerPoint Templates because with the help of our Slides you can Illustrate your plans on using the many social media modes available to inform soceity at large of the benefits of your product. Use our Business PowerPoint Templates because this slide will fire away with all the accuracy at your command.Use these PowerPoint slides for presentations relating to 5, abstract, arrows, blank, business, central, centralized, chart, circle, circular, circulation, concept, conceptual, converging, design, diagram, empty, executive, four, icon, idea, illustration, management, map, mapping, mba, model, numbers, organization, outwards, pointing, procedure, process, radial, radiating, relationship, resource, sequence, sequential, square, strategy, template. The prominent colors used in the PowerPoint template are Green, Gray, White. PowerPoint presentation experts tell us our circular flow 5 arrows diverging sequence chart Charts and Networks PowerPoint Slides are Playful. PowerPoint presentation experts tell us our central PowerPoint templates and PPT Slides are Radiant. Presenters tell us our circular flow 5 arrows diverging sequence chart Charts and Networks PowerPoint Slides are Royal. Presenters tell us our chart PowerPoint templates and PPT Slides are Detailed. You can be sure our circular flow 5 arrows diverging sequence chart Charts and Networks PowerPoint Slides are Splendid. We assure you our centralized PowerPoint templates and PPT Slides are Romantic. Drive home the lesson with our Circular Flow 5 Arrows Diverging Sequence Chart Charts And Networks PowerPoint Slides. Bring all your experience to the fore.
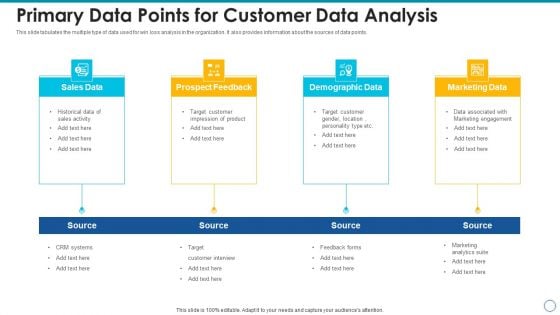
Primary Data Points For Customer Data Analysis Ideas PDF
This slide tabulates the multiple type of data used for win loss analysis in the organization. It also provides information about the sources of data points. Presenting primary data points for customer data analysis ideas pdf to dispense important information. This template comprises four stages. It also presents valuable insights into the topics including sales data, prospect feedback, demographic data, marketing data. This is a completely customizable PowerPoint theme that can be put to use immediately. So, download it and address the topic impactfully.
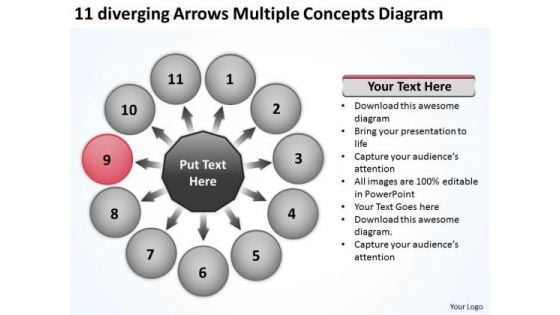
11 Diverging Arrows Multilple Concepts Diagram Cycle Motion Network PowerPoint Templates
We present our 11 diverging arrows multilple concepts diagram Cycle Motion Network PowerPoint templates.Use our Arrow PowerPoint Templates because activities which in themselves have many inherent business oppurtunities. Use our Shapes PowerPoint Templates because different people with differing ideas and priorities perform together to score. Use our Ring Charts PowerPoint Templates because you can Explain the contribution of each of the elements and how they provide impetus to the next phase. Download our Business PowerPoint Templates because spell out your advertising plans to increase market share. The feedback has been positive and productive. Download and present our Marketing PowerPoint Templates because customer satisfaction is a mantra of the marketplace. Building a loyal client base is an essential element of your business.Use these PowerPoint slides for presentations relating to Arrows, business, circle, concept, cycle,design, development, direction, eco,ecological, ecology, energy, environment,environmental, flow, global, growth, icon,illustration, industry, life, loop, motion,movement, natural, nature, object,pollution, protection, recyclable, recycle,recycling, reduce, render, renew, reuse,rolling, save, shape, sign, soft, symbol. The prominent colors used in the PowerPoint template are Red, White, Black. You can be sure our 11 diverging arrows multilple concepts diagram Cycle Motion Network PowerPoint templates are Adorable. Professionals tell us our design PowerPoint templates and PPT Slides are Adorable. PowerPoint presentation experts tell us our 11 diverging arrows multilple concepts diagram Cycle Motion Network PowerPoint templates are Lush. You can be sure our eco PowerPoint templates and PPT Slides are Fancy. You can be sure our 11 diverging arrows multilple concepts diagram Cycle Motion Network PowerPoint templates are Ritzy. The feedback we get is that our concept PowerPoint templates and PPT Slides are Breathtaking. Live life in the fast lane. Our11 Diverging Arrows Multilple Concepts Diagram Cycle Motion Network PowerPoint Templates will accelerate your thought process.
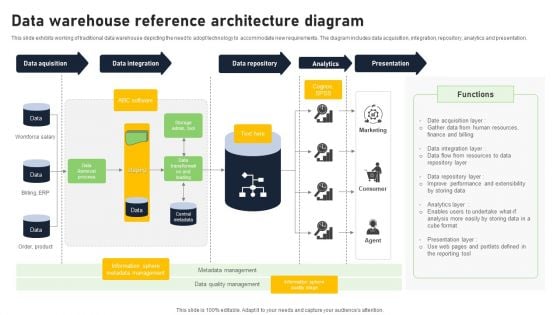
Data Warehouse Reference Architecture Diagram Summary PDF
This slide exhibits working of traditional data warehouse depicting the need to adopt technology to accommodate new requirements. The diagram includes data acquisition, integration, repository, analytics and presentation. Showcasing this set of slides titled Data Warehouse Reference Architecture Diagram Summary PDF. The topics addressed in these templates are Data Acquisition, Data Integration, Data Repository. All the content presented in this PPT design is completely editable. Download it and make adjustments in color, background, font etc. as per your unique business setting.
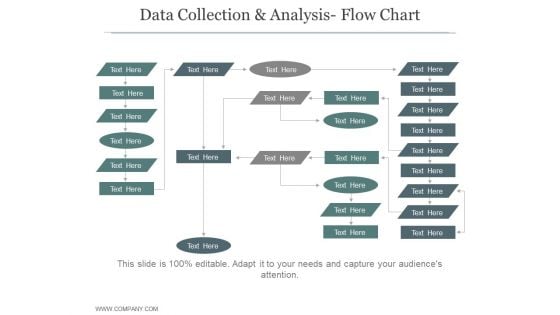
Data Collection And Analysis Flow Chart Ppt PowerPoint Presentation Sample
This is a data collection and analysis flow chart ppt powerpoint presentation sample. This is a five stage process. The stages in this process are business, strategy, marketing, process, growth strategy, finance.

 Home
Home