Dashboard Icon
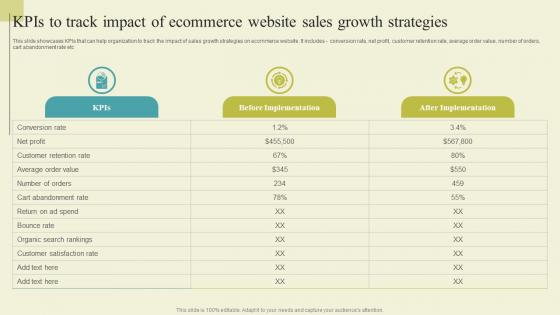
Successful Guide For Ecommerce Promotion Kpis To Track Impact Of Ecommerce Themes Pdf
This slide showcases KPIs that can help organization to track the impact of sales growth strategies on ecommerce website. It includes conversion rate, net profit, customer retention rate, average order value, number of orders, cart abandonment rate etc. Retrieve professionally designed Successful Guide For Ecommerce Promotion Kpis To Track Impact Of Ecommerce Themes Pdf to effectively convey your message and captivate your listeners. Save time by selecting pre-made slideshows that are appropriate for various topics, from business to educational purposes. These themes come in many different styles, from creative to corporate, and all of them are easily adjustable and can be edited quickly. Access them as PowerPoint templates or as Google Slides themes. You do not have to go on a hunt for the perfect presentation because Slidegeeks got you covered from everywhere. This slide showcases KPIs that can help organization to track the impact of sales growth strategies on ecommerce website. It includes conversion rate, net profit, customer retention rate, average order value, number of orders, cart abandonment rate etc.
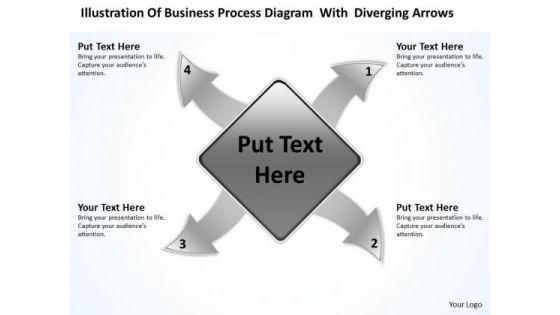
Diagram With Diverging Arrows Relative Circular Flow Process PowerPoint Slides
We present our diagram with diverging arrows Relative Circular Flow Process PowerPoint Slides.Download our Process and Flows PowerPoint Templates because Timeline crunches are a fact of life. Meet all deadlines using our PowerPoint Templates and Slides. Download our Flow Charts PowerPoint Templates because this slide can help to bullet point your views. Use our Shapes PowerPoint Templates because your marketing strategies can funnel down to the cone, stage by stage, refining as you go along. Use our Business PowerPoint Templates because like the famed William Tell, they put aside all emotions and concentrate on the target. Present our Targets PowerPoint Templates because the colour coding of our templates are specifically designed to highlight you points.Use these PowerPoint slides for presentations relating to Arrow, background, ball, business, button, catalog,chart, circle, circular, clipart, company,concept, cross, cycle, development,diagram, edit, editable, element, goals, icon, leader, marketing, model, navigation,organization, parts, pie, plans, presentation, report, representation,retro, six, sphere, stakeholder, team. The prominent colors used in the PowerPoint template are Gray, Black, White. Use our diagram with diverging arrows Relative Circular Flow Process PowerPoint Slides are Detailed. Professionals tell us our ball PowerPoint templates and PPT Slides are Lush. Customers tell us our diagram with diverging arrows Relative Circular Flow Process PowerPoint Slides are Colorful. Presenters tell us our circular PowerPoint templates and PPT Slides are One-of-a-kind. You can be sure our diagram with diverging arrows Relative Circular Flow Process PowerPoint Slides are Reminiscent. PowerPoint presentation experts tell us our ball PowerPoint templates and PPT Slides are Ultra. Teach your team with our Diagram With Diverging Arrows Relative Circular Flow Process PowerPoint Slides. Download without worries with our money back guaranteee.
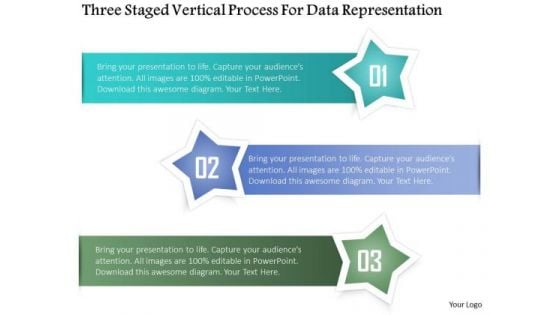
Business Diagram Three Staged Vertical Process For Data Representation Presentation Template
Three staged vertical process diagram has been used to craft this power point template diagram. This PPT contains the concept of data representation. Use this PPT for business and marketing data related presentations.
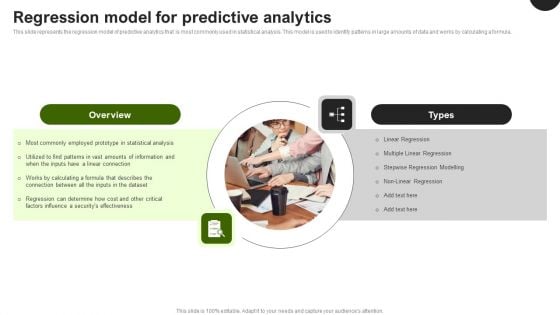
Predictive Analytics In The Age Of Big Data Regression Model For Predictive Analytics Elements PDF
This slide represents the regression model of predictive analytics that is most commonly used in statistical analysis. This model is used to identify patterns in large amounts of data and works by calculating a formula. Do you know about Slidesgeeks Predictive Analytics In The Age Of Big Data Regression Model For Predictive Analytics Elements PDF, These are perfect for delivering any kind od presentation. Using it, create PowerPoint presentations that communicate your ideas and engage audiences. Save time and effort by using our pre designed presentation templates that are perfect for a wide range of topic. Our vast selection of designs covers a range of styles, from creative to business, and are all highly customizable and easy to edit. Download as a PowerPoint template or use them as Google Slides themes.
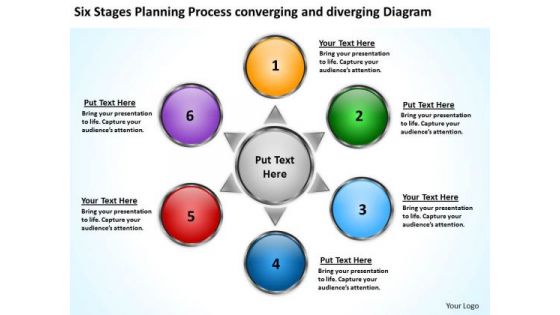
Process Converging And Diverging Diagram Circular Spoke PowerPoint Templates
We present our process converging and diverging diagram Circular Spoke PowerPoint templates.Present our Circle Charts PowerPoint Templates because business ethics is an essential element in your growth. Download our Arrows PowerPoint Templates because watching them will strengthen your companys sinews. Download and present our Business PowerPoint Templates because you have analysed many global markets and come up with possibilities. Highlight the pros and cons of other likely business oppurtunities. Download and present our Shapes PowerPoint Templates because you can Decorate it with your well wrapped ideas and colourful thoughts. Use our Flow Charts PowerPoint Templates because they are truly some of the wonders of our life.Use these PowerPoint slides for presentations relating to abstract, arrow, business, chart, circle, circular, collection, color, continuity, cycle, decoration, design, diagram, dimensional, direction, element, flow, glossy, graph, icon, illustration, isolated, modern, motion, movement, pattern, pie, recycling, repetition, report, ring, round, scheme, section, set, shape, shiny, sign, slice, spinning, symbol, turn, vector, web. The prominent colors used in the PowerPoint template are Purple, Yellow, Green. Customers tell us our process converging and diverging diagram Circular Spoke PowerPoint templates are aesthetically designed to attract attention. We guarantee that they will grab all the eyeballs you need. PowerPoint presentation experts tell us our circular PowerPoint templates and PPT Slides are Graceful. People tell us our process converging and diverging diagram Circular Spoke PowerPoint templates will impress their bosses and teams. People tell us our chart PowerPoint templates and PPT Slides are Luxurious. Customers tell us our process converging and diverging diagram Circular Spoke PowerPoint templates are incredible easy to use. People tell us our circle PowerPoint templates and PPT Slides are Playful. Our Process Converging And Diverging Diagram Circular Spoke PowerPoint Templates encourage a creative environment. Allow diverse ideas to gain acceptance.

Data Interpretation And Analysis Playbook How To Overcome Automated Data Analysis Powered By Ml Challenges Summary PDF
This template illustrates that automated discovery of insights utilizes machine learning algorithms to analyze billions of data points in seconds to perform complex segmentation, anomaly detection, and trend-based analysis without coding. Deliver and pitch your topic in the best possible manner with this data interpretation and analysis playbook how to overcome automated data analysis powered by ml challenges summary pdf. Use them to share invaluable insights on opportunity, service, analytics, industry and impress your audience. This template can be altered and modified as per your expectations. So, grab it now.

Diagram With Diverging Arrows Ppt Relative Circular Flow Process PowerPoint Slide
We present our diagram with diverging arrows ppt Relative Circular Flow Process PowerPoint Slide.Use our Process and Flows PowerPoint Templates because you have the plans ready for them to absorb and understand. Download our Flow Charts PowerPoint Templates because so that you can Lead the way to spread good cheer to one and all. Download and present our Shapes PowerPoint Templates because it helps you to display your ideas and thoughts. Present our Business PowerPoint Templates because it will demonstrate the strength of character under severe stress. Shine the torch ahead and bring the light to shine on all. Download our Targets PowerPoint Templates because getting it done in time is the key to success.Use these PowerPoint slides for presentations relating to Arrow, background, ball, business, button, catalog,chart, circle, circular, clipart, company,concept, cross, cycle, development,diagram, edit, editable, element, goals, icon, leader, marketing, model, navigation,organization, parts, pie, plans, presentation, report, representation,retro, six, sphere, stakeholder, team. The prominent colors used in the PowerPoint template are Orange, Black, White. Use our diagram with diverging arrows ppt Relative Circular Flow Process PowerPoint Slide are Chic. Professionals tell us our button PowerPoint templates and PPT Slides are Liberated. Customers tell us our diagram with diverging arrows ppt Relative Circular Flow Process PowerPoint Slide are Swanky. Presenters tell us our ball PowerPoint templates and PPT Slides are Charming. You can be sure our diagram with diverging arrows ppt Relative Circular Flow Process PowerPoint Slide are Royal. PowerPoint presentation experts tell us our circular PowerPoint templates and PPT Slides are Colorful. In the market,customer is king. Anoint him with our Diagram With Diverging Arrows Ppt Relative Circular Flow Process PowerPoint Slide.
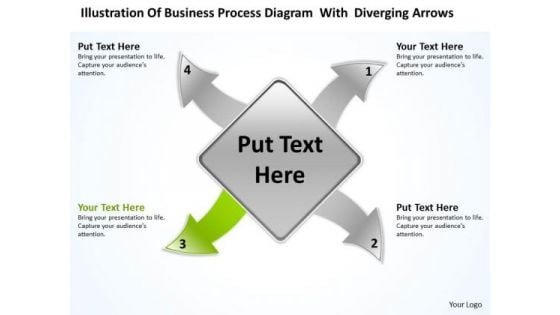
Diagram With Diverging Arrows Relative Circular Flow Process PowerPoint Slide
We present our diagram with diverging arrows Relative Circular Flow Process PowerPoint Slide.Download our Process and Flows PowerPoint Templates because you have played a stellar role and have a few ideas. Present our Flow Charts PowerPoint Templates because this helps you to chart the path ahead to arrive at your destination and acheive the goal. Download and present our Shapes PowerPoint Templates because they will Amplify your basic corporate concept and forefront the benefits of overlapping processes to arrive at common goals. Use our Business PowerPoint Templates because you are sure you have the right people for your plans. Download and present our Targets PowerPoint Templates because firing the arrows to emblazon the desired path will let you achieve anticipated results.Use these PowerPoint slides for presentations relating to Arrow, background, ball, business, button, catalog,chart, circle, circular, clipart, company,concept, cross, cycle, development,diagram, edit, editable, element, goals, icon, leader, marketing, model, navigation,organization, parts, pie, plans, presentation, report, representation,retro, six, sphere, stakeholder, team. The prominent colors used in the PowerPoint template are Green, White, Black. Use our diagram with diverging arrows Relative Circular Flow Process PowerPoint Slide are Multicolored. Professionals tell us our chart PowerPoint templates and PPT Slides are Elegant. Customers tell us our diagram with diverging arrows Relative Circular Flow Process PowerPoint Slide are effectively colour coded to prioritise your plans They automatically highlight the sequence of events you desire. Presenters tell us our chart PowerPoint templates and PPT Slides are readymade to fit into any presentation structure. You can be sure our diagram with diverging arrows Relative Circular Flow Process PowerPoint Slide are Beautiful. PowerPoint presentation experts tell us our button PowerPoint templates and PPT Slides are Upbeat. Add emphasis to your ideas with our Diagram With Diverging Arrows Relative Circular Flow Process PowerPoint Slide. Lend greater credence to your expression.

Business Diagram Three Staged Pencil Diagram For Graph Formation PowerPoint Slide
This business diagram displays set of pencils. This Power Point template has been designed to compare and present business data. Download this diagram to represent stages of business growth.
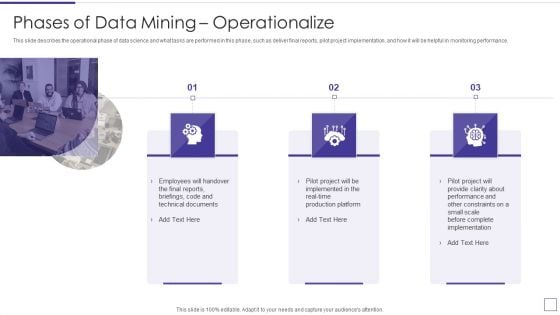
Data Mining Implementation Phases Of Data Mining Operationalize Professional PDF
This slide describes the operational phase of data science and what tasks are performed in this phase, such as deliver final reports, pilot project implementation, and how it will be helpful in monitoring performance.Presenting data mining implementation phases of data mining operationalize professional pdf to provide visual cues and insights. Share and navigate important information on three stages that need your due attention. This template can be used to pitch topics like employees will handover, technical documents, complete implementation In addtion, this PPT design contains high resolution images, graphics, etc, that are easily editable and available for immediate download.
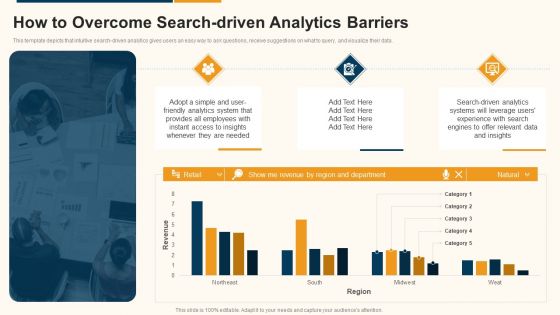
Data Interpretation And Analysis Playbook How To Overcome Search Driven Analytics Barriers Summary PDF
This template depicts that intuitive search-driven analytics gives users an easy way to ask questions, receive suggestions on what to query, and visualize their data. Deliver and pitch your topic in the best possible manner with this data interpretation and analysis playbook how to overcome search driven analytics barriers summary pdf. Use them to share invaluable insights on how to overcome search driven analytics barriers and impress your audience. This template can be altered and modified as per your expectations. So, grab it now.

Reasons Towards Failure Of Data Analytics Project Business Analysis Modification Toolkit Topics PDF
This slide shows the graph highlighting key reasons for the failure of data management project.Deliver an awe inspiring pitch with this creative Reasons Towards Failure Of Data Analytics Project Business Analysis Modification Toolkit Topics PDF bundle. Topics like Incorrect Project, Inadequate Management, Cultural Resistance can be discussed with this completely editable template. It is available for immediate download depending on the needs and requirements of the user.
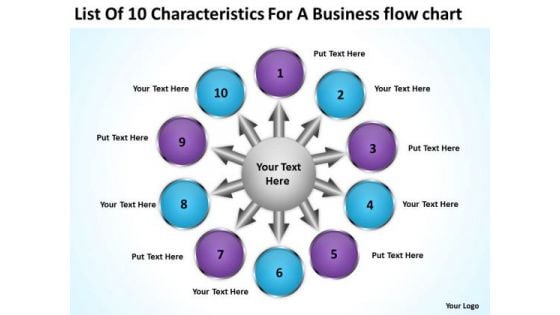
Business PowerPoint Presentation Flow Chart Circular Process Network Slides
We present our business powerpoint presentation flow chart Circular Process Network Slides.Use our Circle Charts PowerPoint Templates because with the help of our Slides you can Illustrate these thoughts with this slide. Use our Arrows PowerPoint Templates because the great Bald headed Eagle embodies your personality. the eagle eye to seize upon the smallest of oppurtunities. Download and present our Business PowerPoint Templates because your fledgling career is in the chrysallis stage. Nurture it and watch it grow into a beautiful butterfly. Use our Shapes PowerPoint Templates because you are the Champion of your team shall anoint. Download our Flow Charts PowerPoint Templates because getting it done in time is the key to success.Use these PowerPoint slides for presentations relating to 3d, abstract, arrow, art, background, blank, business, chart, circle, concept, connection, cycle, development, diagram, direction, element, environment, exchange, finance, financial, flow, graph, graphic, graphic presentation, group, icon, illustration, investment, isolated, isometric, market, motion, movement, organization, passive income, perspective, process, process chart, recycle, report, ring, sign, step, stock, success, symbol, teamwork, text, vector. The prominent colors used in the PowerPoint template are Blue, Purple, Gray. Customers tell us our business powerpoint presentation flow chart Circular Process Network Slides will impress their bosses and teams. PowerPoint presentation experts tell us our circle PowerPoint templates and PPT Slides are Nice. People tell us our business powerpoint presentation flow chart Circular Process Network Slides are readymade to fit into any presentation structure. People tell us our art PowerPoint templates and PPT Slides will make the presenter look like a pro even if they are not computer savvy. Customers tell us our business powerpoint presentation flow chart Circular Process Network Slides are Quaint. People tell us our circle PowerPoint templates and PPT Slides are Breathtaking. You have the X-factor without a doubt. Let everyone experience it with our Business PowerPoint Presentation Flow Chart Circular Process Network Slides.
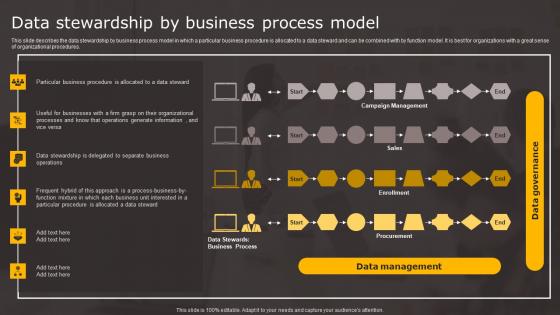
Data Stewardship By Business Data Stewardship In Business Processes Diagrams Pdf
This slide describes the data stewardship by business process model in which a particular business procedure is allocated to a data steward and can be combined with by function model. It is best for organizations with a great sense of organizational procedures. If your project calls for a presentation, then Slidegeeks is your go to partner because we have professionally designed, easy to edit templates that are perfect for any presentation. After downloading, you can easily edit Data Stewardship By Business Data Stewardship In Business Processes Diagrams Pdf and make the changes accordingly. You can rearrange slides or fill them with different images. Check out all the handy templates This slide describes the data stewardship by business process model in which a particular business procedure is allocated to a data steward and can be combined with by function model. It is best for organizations with a great sense of organizational procedures.
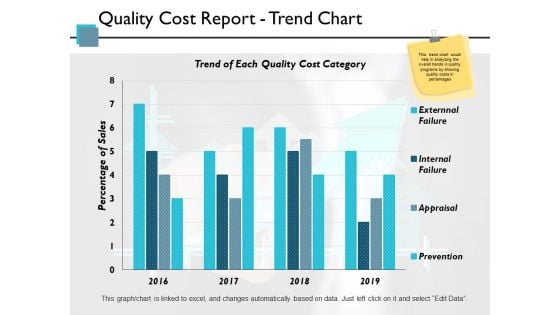
Quality Cost Report Trend Chart Ppt PowerPoint Presentation Pictures Themes
This is a quality cost report trend chart ppt powerpoint presentation pictures themes. This is a four stage process. The stages in this process are finance, strategy, marketing, management, business.
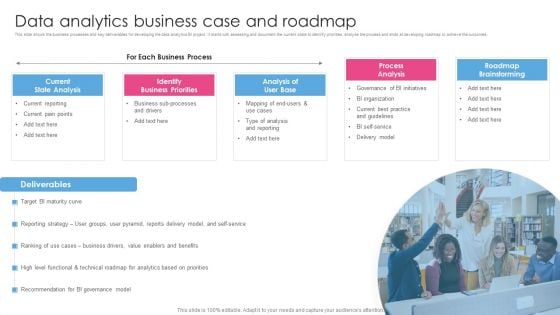
Data Analytics Business Case And Roadmap Business Analysis Modification Toolkit Diagrams PDF
Presenting Data Analytics Business Case And Roadmap Business Analysis Modification Toolkit Diagrams PDF to provide visual cues and insights. Share and navigate important information on one stage that need your due attention. This template can be used to pitch topics like Identify Business, Governance Initiatives, Governance Model. In addtion, this PPT design contains high resolution images, graphics, etc, that are easily editable and available for immediate download.
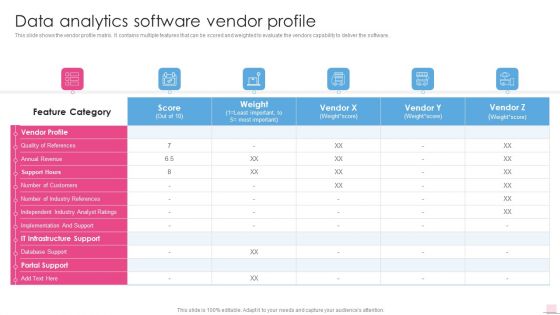
Data Analytics Software Vendor Profile Business Analysis Modification Toolkit Diagrams PDF
This slide shows the vendor profile matrix. It contains multiple features that can be scored and weighted to evaluate the vendors capability to deliver the software.Deliver an awe inspiring pitch with this creative Data Analytics Software Vendor Profile Business Analysis Modification Toolkit Diagrams PDF bundle. Topics like Independent Industry, Implementation Support, Infrastructure Support can be discussed with this completely editable template. It is available for immediate download depending on the needs and requirements of the user.
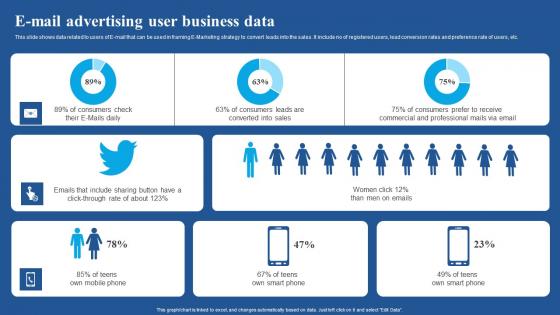
E Mail Advertising User Business Data Diagrams Pdf
This slide shows data related to users of E-mail that can be used in framing E-Marketing strategy to convert leads into the sales. It include no of registered users, lead conversion rates and preference rate of users, etc.Showcasing this set of slides titled E Mail Advertising User Business Data Diagrams Pdf The topics addressed in these templates are E Mail Advertising, User Business Data All the content presented in this PPT design is completely editable. Download it and make adjustments in color, background, font etc. as per your unique business setting. This slide shows data related to users of E mail that can be used in framing E Marketing strategy to convert leads into the sales. It include no of registered users, lead conversion rates and preference rate of users, etc.
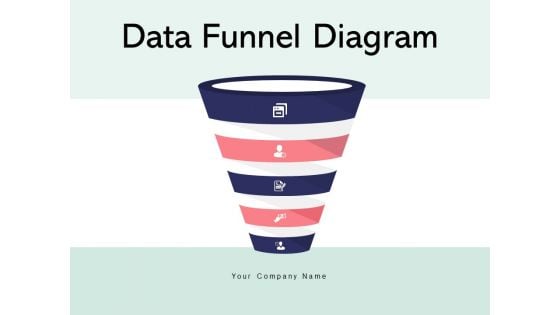
Data Funnel Diagram Interest Analysis Ppt PowerPoint Presentation Complete Deck
Presenting this set of slides with name data funnel diagram interest analysis ppt powerpoint presentation complete deck. The topics discussed in these slides are interest, analysis, arrow, marketing, funnel. This is a completely editable PowerPoint presentation and is available for immediate download. Download now and impress your audience.
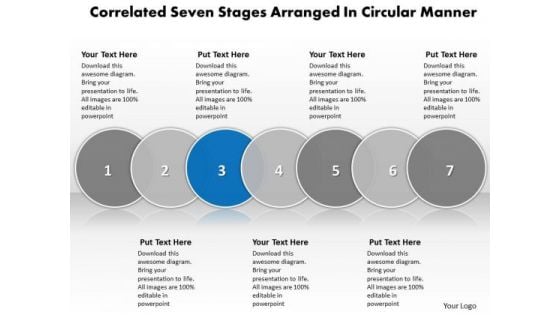
Ppt Correlated Seven Phase Diagram Business PowerPoint Templates
PPT correlated seven phase diagram Business PowerPoint Templates-This PowerPoint Diagram shows you the 3d Sequential Demonstration to explain Internet Marketing. It consists of Seven Layers explaining third here. Use this diagram as a method of graphically representing the flow of data as an information processing system. This is a good resource also for Marketing PowerPoint Diagrams or Business Backgrounds for PowerPoint or business presentation PowerPoint Diagram to master your strategic thinking.-PPT correlated seven phase diagram Business PowerPoint Templates-3, Advice, Analysis, Analyze, Answer, Area, Career, Chart, Choice, Circles, Concept, Determination, Diagram, Graph, Idea, Illustration, Intersect, Measurement, Opportunities, Options, Overlap, Overlapped, Overlapping, Passion, Passionate, Prioritize, Priority, Profession Falsify claims with our Ppt Correlated Seven Phase Diagram Business PowerPoint Templates. Just download, type and present.

Diagram With Diverging Arrows Ppt Relative Circular Flow Process PowerPoint Slides
We present our diagram with diverging arrows ppt Relative Circular Flow Process PowerPoint Slides.Present our Process and Flows PowerPoint Templates because with the help of our Slides you can Illustrate your plans on using the many social media modes available to inform soceity at large of the benefits of your product. Present our Flow Charts PowerPoint Templates because Our PowerPoint Templates and Slides will let you Illuminate the road ahead to Pinpoint the important landmarks along the way. Present our Shapes PowerPoint Templates because Our PowerPoint Templates and Slides will generate and maintain the level of interest you desire. They will create the impression you want to imprint on your audience. Use our Business PowerPoint Templates because watch the excitement levels rise as they realise their worth. Download our Targets PowerPoint Templates because it is a step by step process with levels rising at every stage.Use these PowerPoint slides for presentations relating to Arrow, background, ball, business, button, catalog,chart, circle, circular, clipart, company,concept, cross, cycle, development,diagram, edit, editable, element, goals, icon, leader, marketing, model, navigation,organization, parts, pie, plans, presentation, report, representation,retro, six, sphere, stakeholder, team. The prominent colors used in the PowerPoint template are Yellow, Gray, Black. Use our diagram with diverging arrows ppt Relative Circular Flow Process PowerPoint Slides will impress their bosses and teams. Professionals tell us our button PowerPoint templates and PPT Slides are Bright. Customers tell us our diagram with diverging arrows ppt Relative Circular Flow Process PowerPoint Slides are Vintage. Presenters tell us our catalog PowerPoint templates and PPT Slides are Quaint. You can be sure our diagram with diverging arrows ppt Relative Circular Flow Process PowerPoint Slides will generate and maintain the level of interest you desire. They will create the impression you want to imprint on your audience. PowerPoint presentation experts tell us our chart PowerPoint templates and PPT Slides are Upbeat. Attach importance to your views with our Diagram With Diverging Arrows Ppt Relative Circular Flow Process PowerPoint Slides. You will come out on top.
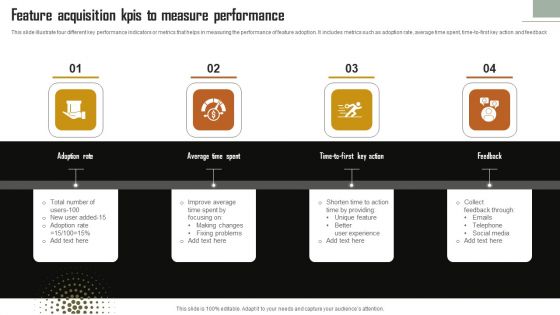
Feature Acquisition Kpis To Measure Performance Themes PDF
This slide illustrate four different key performance indicators or metrics that helps in measuring the performance of feature adoption. It includes metrics such as adoption rate, average time spent, time-to-first key action and feedback. Persuade your audience using this Feature Acquisition Kpis To Measure Performance Themes PDF. This PPT design covers four stages, thus making it a great tool to use. It also caters to a variety of topics including Adoption Rate, Average Time Spent, Feedback. Download this PPT design now to present a convincing pitch that not only emphasizes the topic but also showcases your presentation skills.
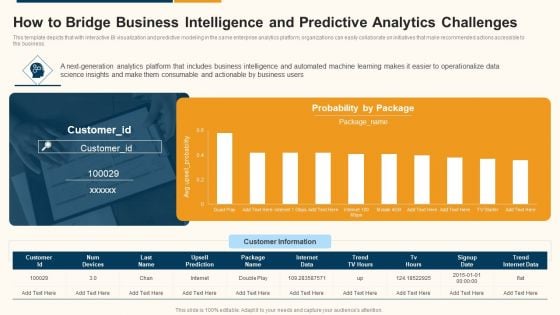
Data Interpretation And Analysis Playbook How To Bridge Business Intelligence And Predictive Analytics Challenges Designs PDF
This template depicts that with interactive BI visualization and predictive modeling in the same enterprise analytics platform, organizations can easily collaborate on initiatives that make recommended actions accessible to the business. Deliver an awe inspiring pitch with this creative data interpretation and analysis playbook how to bridge business intelligence and predictive analytics challenges designs pdf bundle. Topics like how to bridge business intelligence and predictive analytics challenges can be discussed with this completely editable template. It is available for immediate download depending on the needs and requirements of the user.
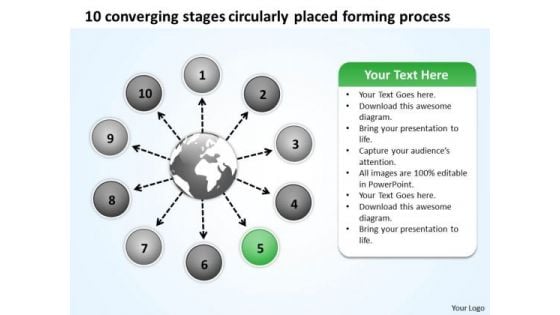
10 Converging Stages Circularly Placed Forming Process Cycle PowerPoint Templates
We present our 10 converging stages circularly placed forming process Cycle PowerPoint templates.Use our Flow charts PowerPoint Templates because with the help of our Slides you can Illustrate your plans to your listeners with the same accuracy. Use our Arrows PowerPoint Templates because spreading the light of knowledge around you will clear the doubts and enlighten the questioning minds with your brilliance and ability. Download and present our Ring charts PowerPoint Templates because there are different paths to gain the necessary knowledge to acheive it. Download our Circle charts PowerPoint Templates because there are so many different pieces to the puzzle. Download and present our Business PowerPoint Templates because you can see clearly through to the bigger bowl ahead. Time your jump to perfection and hit the nail on the head.Use these PowerPoint slides for presentations relating to Arrow, blank, business, chart, circle, concept, connection, cycle, development, diagram, direction, element, environment, exchange, finance, financial, flow, graph, graphic, graphic presentation, group, icon, illustration, investment, isolated, isometric, market, motion, movement, organization, passive income, perspective, process, process chart, recycle, report, ring, sign, step, stock, success, symbol. The prominent colors used in the PowerPoint template are Blue , Black, White. You can be sure our 10 converging stages circularly placed forming process Cycle PowerPoint templates are Luxurious. Presenters tell us our circle PowerPoint templates and PPT Slides are Zippy. We assure you our 10 converging stages circularly placed forming process Cycle PowerPoint templates are Flirty. Customers tell us our circle PowerPoint templates and PPT Slides are Awesome. Presenters tell us our 10 converging stages circularly placed forming process Cycle PowerPoint templates are Striking. You can be sure our development PowerPoint templates and PPT Slides effectively help you save your valuable time. Do competitive market positioning with our 10 Converging Stages Circularly Placed Forming Process Cycle PowerPoint Templates. They will make you look good.
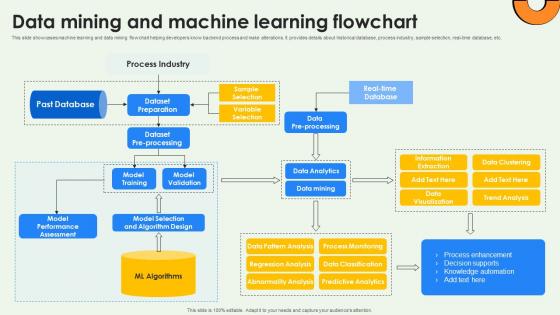
Data Warehousing And Data Mining And Machine Learning Flowchart AI SS V
This slide showcases machine learning and data mining flowchart helping developers know backend process and make alterations. It provides details about historical database, process industry, sample selection, real-time database, etc. Presenting this PowerPoint presentation, titled Data Warehousing And Data Mining And Machine Learning Flowchart AI SS V, with topics curated by our researchers after extensive research. This editable presentation is available for immediate download and provides attractive features when used. Download now and captivate your audience. Presenting this Data Warehousing And Data Mining And Machine Learning Flowchart AI SS V. Our researchers have carefully researched and created these slides with all aspects taken into consideration. This is a completely customizable Data Warehousing And Data Mining And Machine Learning Flowchart AI SS V that is available for immediate downloading. Download now and make an impact on your audience. Highlight the attractive features available with our PPTs. This slide showcases machine learning and data mining flowchart helping developers know backend process and make alterations. It provides details about historical database, process industry, sample selection, real-time database, etc.
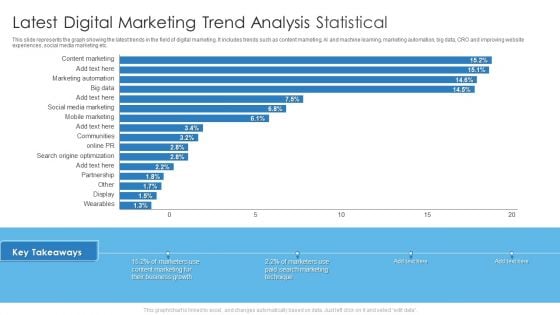
Latest Digital Marketing Trend Analysis Statistical Template PDF
This slide represents the graph showing the latest trends in the field of digital marketing. It includes trends such as content marketing, AI and machine learning, marketing automation, big data, CRO and improving website experiences, social media marketing etc. Deliver an awe inspiring pitch with this creative Latest Digital Marketing Trend Analysis Statistical Template PDF bundle. Topics like Business Growth, Content Marketing, Technique can be discussed with this completely editable template. It is available for immediate download depending on the needs and requirements of the user.
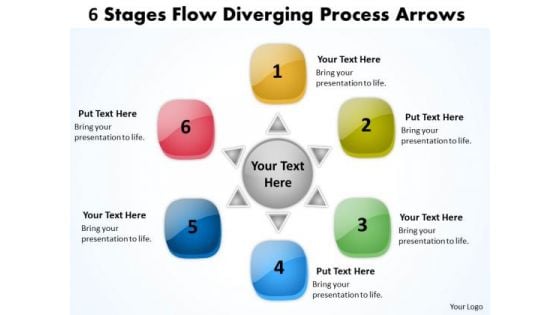
6 Stages Flow Diverging Process Arrows Relative Cycle Chart PowerPoint Slides
We present our 6 stages flow diverging process arrows Relative Cycle Chart PowerPoint Slides.Download and present our Boxes PowerPoint Templates because you understand the ailment and how to fight it. Download our Business PowerPoint Templates because this template can project the path to sucess that you have charted. Download our Arrows PowerPoint Templates because so that you can Lead the way to spread good cheer to one and all. Download and present our Circle Charts PowerPoint Templates because Our PowerPoint Templates and Slides offer you the widest possible range of options. Download our Flow Charts PowerPoint Templates because your group can behave steady in the top bracket.Use these PowerPoint slides for presentations relating to 3d, abstract, arrow, art, background, blank, business, chart, circle, concept, connection, cycle, development, diagram, direction, element, environment, exchange, finance, financial, flow, graph, graphic, graphic presentation, group, icon, illustration, investment, isolated, isometric, market, motion, movement, organization, passive income, perspective, process, process chart, recycle, report, ring, sign, step, stock, success, symbol, teamwork, text, vector. The prominent colors used in the PowerPoint template are Blue, Red, Yellow. Presenters tell us our 6 stages flow diverging process arrows Relative Cycle Chart PowerPoint Slides will save the presenter time. You can be sure our arrow PowerPoint templates and PPT Slides are Excellent. Professionals tell us our 6 stages flow diverging process arrows Relative Cycle Chart PowerPoint Slides are Handsome. People tell us our art PowerPoint templates and PPT Slides are Youthful. People tell us our 6 stages flow diverging process arrows Relative Cycle Chart PowerPoint Slides will make the presenter look like a pro even if they are not computer savvy. Professionals tell us our arrow PowerPoint templates and PPT Slides provide great value for your money. Be assured of finding the best projection to highlight your words. Attack doubts with our 6 Stages Flow Diverging Process Arrows Relative Cycle Chart PowerPoint Slides. You will come out on top.
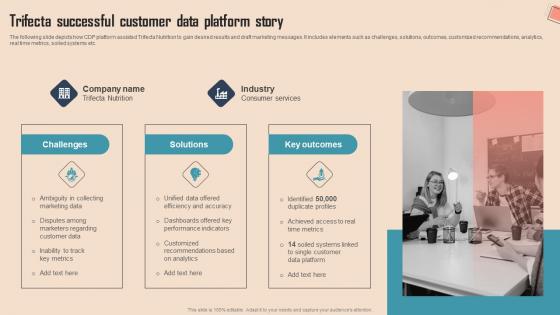
Trifecta Successful Customer Data Platform Comprehensive CDP Guide For Promoters Background Pdf
The following slide depicts how CDP platform assisted Trifecta Nutrition to gain desired results and draft marketing messages. It includes elements such as challenges, solutions, outcomes, customized recommendations, analytics, real time metrics, soiled systems etc.Do you know about Slidesgeeks Trifecta Successful Customer Data Platform Comprehensive CDP Guide For Promoters Background Pdf These are perfect for delivering any kind od presentation. Using it, create PowerPoint presentations that communicate your ideas and engage audiences. Save time and effort by using our pre-designed presentation templates that are perfect for a wide range of topic. Our vast selection of designs covers a range of styles, from creative to business, and are all highly customizable and easy to edit. Download as a PowerPoint template or use them as Google Slides themes. The following slide depicts how CDP platform assisted Trifecta Nutrition to gain desired results and draft marketing messages. It includes elements such as challenges, solutions, outcomes, customized recommendations, analytics, real time metrics, soiled systems etc.
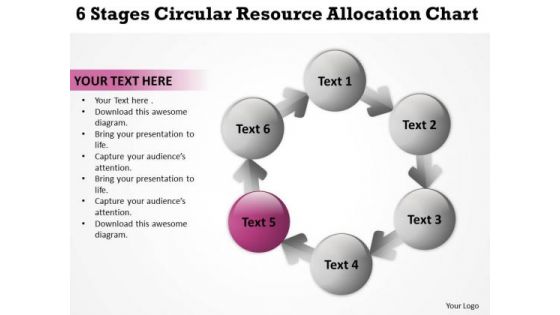
6 Stages Circular Resource Allocation Chart Create Business Plan Template PowerPoint Slides
We present our 6 stages circular resource allocation chart create business plan template PowerPoint Slides.Download our Circle Charts PowerPoint Templates because You can Rise to the occasion with our PowerPoint Templates and Slides. You will bring your audience on their feet in no time. Use our Arrows PowerPoint Templates because Our PowerPoint Templates and Slides has conjured up a web of all you need with the help of our great team. Use them to string together your glistening ideas. Download our Flows Charts PowerPoint Templates because Our PowerPoint Templates and Slides will embellish your thoughts. See them provide the desired motivation to your team. Use our Business PowerPoint Templates because Our PowerPoint Templates and Slides are specially created by a professional team with vast experience. They diligently strive to come up with the right vehicle for your brilliant Ideas. Download and present our Process and Flows PowerPoint Templates because You are working at that stage with an air of royalty. Let our PowerPoint Templates and Slides be the jewels in your crown.Use these PowerPoint slides for presentations relating to Abstract, arrow, art, background, ball, blue, business, button, chart, circle, circular, clip, company, concept, cycle, diagram, edit, editable, element, green, guide,icon, leader, management, marketing, model, numbers, organization, plans, point, presentation, purple, red, report, representation, seven, sphere, stakeholder,team, text, tool, vector, white. The prominent colors used in the PowerPoint template are Pink, Gray, White. Doable is not enough for our 6 Stages Circular Resource Allocation Chart Create Business Plan Template PowerPoint Slides. Be elated with what they can actually do.
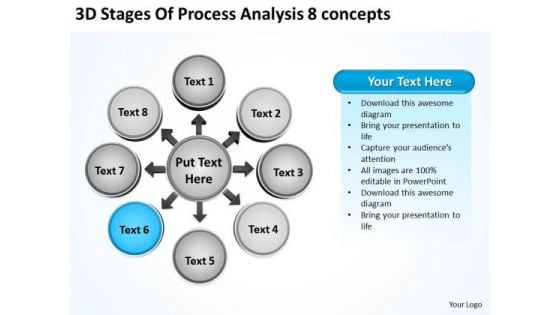
3d Stages Of Process Analysis 8 Concepts Circular Flow Chart PowerPoint Slides
We present our 3d stages of process analysis 8 concepts Circular Flow Chart PowerPoint Slides.Use our Business PowerPoint Templates because it helps you to project your enthusiasm and single mindedness to your colleagues. Present our Circle Charts PowerPoint Templates because you should explain the process by which you intend to right it. Present our Shapes PowerPoint Templates because it outlines the process with this innovative graphic to authenticate your plan of achieving the goal of added value/profit. Present our Process and Flows PowerPoint Templates because it shows how one can contribute to the overall feeling of well-being. Download our Success PowerPoint Templates because iT outlines the entire thought process for the benefit of others. Tell it to the world with your characteristic aplomb.Use these PowerPoint slides for presentations relating to Abstract, arrow,blank, business, chart, circle, concept,connection, cycle, development,diagram, direction, element,environment, exchange, finance,financial, flow, graph, graphic, graphicpresentation, group, icon, illustration,investment, isolated, isometric, market,motion, movement, organization, p perspective, presentation,process, processchart, recycle, report,ring, sign, step, stock, success, symbol. The prominent colors used in the PowerPoint template are Blue light, Gray, White. The feedback we get is that our 3d stages of process analysis 8 concepts Circular Flow Chart PowerPoint Slides are Enchanting. The feedback we get is that our concept PowerPoint templates and PPT Slides are Clever. Presenters tell us our 3d stages of process analysis 8 concepts Circular Flow Chart PowerPoint Slides are Vintage. The feedback we get is that our blank PowerPoint templates and PPT Slides are Clever. PowerPoint presentation experts tell us our 3d stages of process analysis 8 concepts Circular Flow Chart PowerPoint Slides are Adorable. Customers tell us our concept PowerPoint templates and PPT Slides are Ultra. Our 3d Stages Of Process Analysis 8 Concepts Circular Flow Chart PowerPoint Slides are not a figment of imagination. They actually help in day to day aspects.
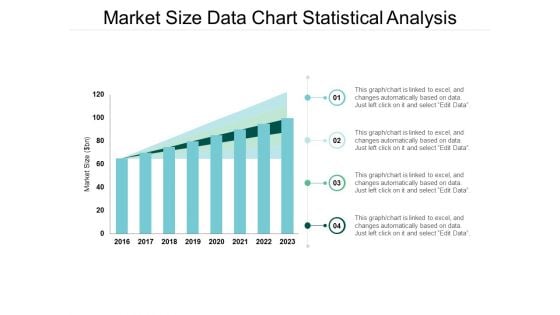
Market Size Data Chart Statistical Analysis Ppt Powerpoint Presentation Model Format
This is a market size data chart statistical analysis ppt powerpoint presentation model format. The topics discussed in this diagram are market growth, market opportunity, market profitability. This is a completely editable PowerPoint presentation, and is available for immediate download.
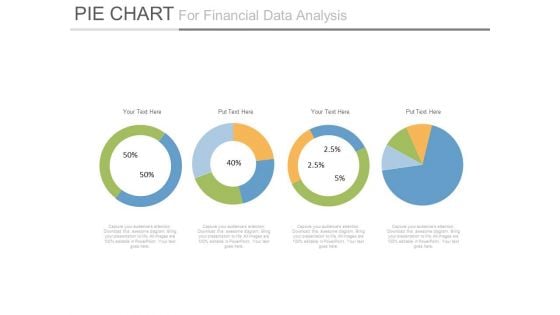
Pie Charts For Financial Ratio Analysis Powerpoint Slides
This PowerPoint template has been designed with diagram of pie charts. This PPT slide can be used to prepare presentations for profit growth report and also for financial data analysis. You can download finance PowerPoint template to prepare awesome presentations.
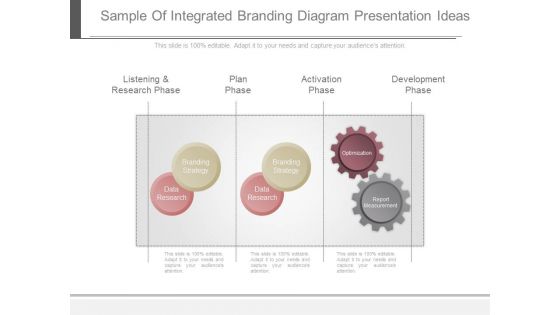
Sample Of Integrated Branding Diagram Presentation Ideas
This is a sample of integrated branding diagram presentation ideas. This is a three stage process. The stages in this process are listening and research phase, plan phase, activation phase, development phase, branding strategy, data research, optimization, report measurement.
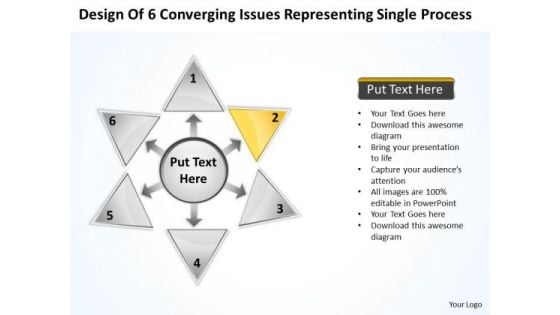
Of 6 Converging Issues Representing Single Process Circular Spoke Chart PowerPoint Slides
We present our of 6 converging issues representing single process Circular Spoke Chart PowerPoint Slides.Present our Shapes PowerPoint Templates because clarity of thought has been the key to your growth. Present our Business PowerPoint Templates because the great Bald headed Eagle embodies your personality. the eagle eye to seize upon the smallest of opportunities. Download our Arrows PowerPoint Templates because they will Amplify your thoughts via our appropriate templates. Use our Symbol PowerPoint Templates because your marketing strategies can funnel down to the cone, stage by stage, refining as you go along. Download our Signs PowerPoint Templates because you know Coincidentally it will always point to the top.Use these PowerPoint slides for presentations relating to 3d, Abstract, Arrow, Business, Chart, Circle, Circular, Collection, Color, Continuity, Cycle, Decoration, Design, Diagram, Dimensional, Direction, Element, Flow, Glossy, Graph, Icon, Illustration, Isolated, Modern, Motion, Movement, Pattern, Pie, Recycling, Repetition, Report, Ring, Round, Scheme, Section, Set, Shape, Shiny, Sign, Slice, Spinning, Symbol. The prominent colors used in the PowerPoint template are Yellow, Gray, Black. Use our of 6 converging issues representing single process Circular Spoke Chart PowerPoint Slides are Second to none. We assure you our Arrow PowerPoint templates and PPT Slides are Enchanting. People tell us our of 6 converging issues representing single process Circular Spoke Chart PowerPoint Slides are Efficient. PowerPoint presentation experts tell us our Chart PowerPoint templates and PPT Slides are Excellent. PowerPoint presentation experts tell us our of 6 converging issues representing single process Circular Spoke Chart PowerPoint Slides will get their audience's attention. Use our Circle PowerPoint templates and PPT Slides are Amazing. With our Of 6 Converging Issues Representing Single Process Circular Spoke Chart PowerPoint Slides you'll more than break even. Add to the entries in the credit column.
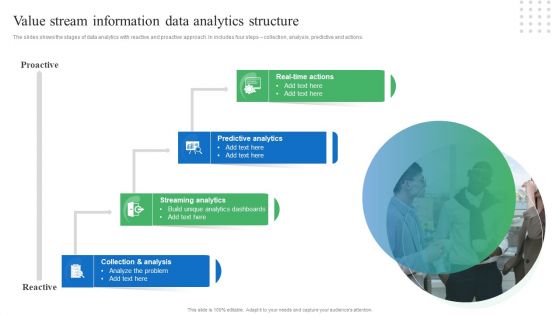
Toolkit For Data Science And Analytics Transition Value Stream Information Data Analytics Structure Sample PDF
The slides shows the stages of data analytics with reactive and proactive approach. In includes four steps collection, analysis, predictive and actions. Retrieve professionally designed Toolkit For Data Science And Analytics Transition Value Stream Information Data Analytics Structure Sample PDF to effectively convey your message and captivate your listeners. Save time by selecting pre made slideshows that are appropriate for various topics, from business to educational purposes. These themes come in many different styles, from creative to corporate, and all of them are easily adjustable and can be edited quickly. Access them as PowerPoint templates or as Google Slides themes. You do not have to go on a hunt for the perfect presentation because Slidegeeks got you covered from everywhere.
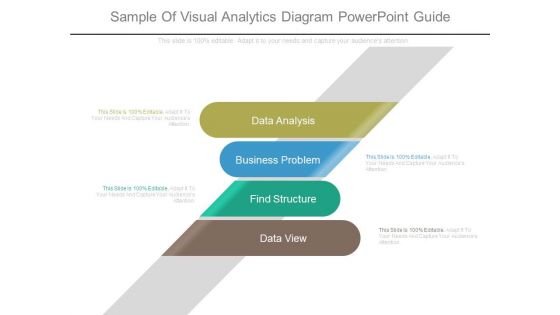
Sample Of Visual Analytics Diagram Powerpoint Guide
This is a sample of visual analytics diagram powerpoint guide. This is a four stage process. The stages in this process are data analysis, business problem, find structure, data view.
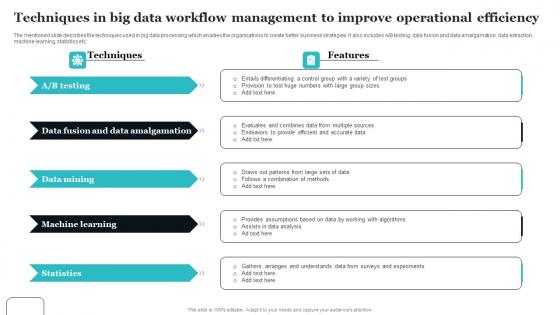
Techniques In Big Data Workflow Management To Improve Operational Efficiency Diagrams Pdf
The mentioned slide describes the techniques used in big data processing which enables the organizations to create better business strategies. It also includes A or B testing, data fusion and data amalgamation, data extraction, machine learning, statistics etc. Pitch your topic with ease and precision using this Techniques In Big Data Workflow Management To Improve Operational Efficiency Diagrams Pdf This layout presents information on Data Fusion, Data Amalgamation, Machine Learning It is also available for immediate download and adjustment. So, changes can be made in the color, design, graphics or any other component to create a unique layout. The mentioned slide describes the techniques used in big data processing which enables the organizations to create better business strategies. It also includes A or B testing, data fusion and data amalgamation, data extraction, machine learning, statistics etc.
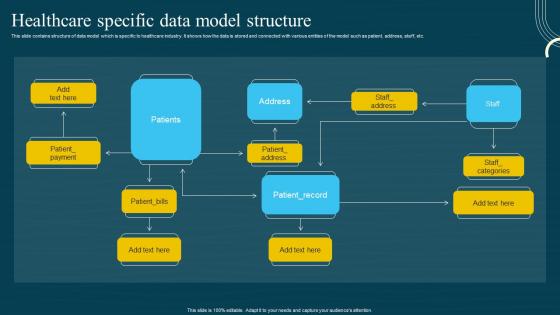
Database Modeling Structures Healthcare Specific Data Model Structure Demonstration Pdf
This slide contains structure of data model which is specific to healthcare industry. It shows how the data is stored and connected with various entities of the model such as patient, address, staff, etc. This Database Modeling Structures Healthcare Specific Data Model Structure Demonstration Pdf is perfect for any presentation, be it in front of clients or colleagues. It is a versatile and stylish solution for organizing your meetings. The Database Modeling Structures Healthcare Specific Data Model Structure Demonstration Pdf features a modern design for your presentation meetings. The adjustable and customizable slides provide unlimited possibilities for acing up your presentation. Slidegeeks has done all the homework before launching the product for you. So, do not wait, grab the presentation templates today This slide contains structure of data model which is specific to healthcare industry. It shows how the data is stored and connected with various entities of the model such as patient, address, staff, etc.
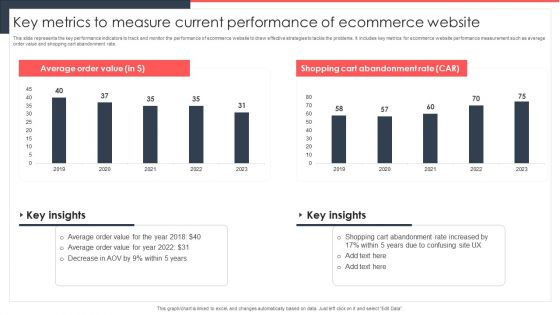
Implementing Management System To Enhance Ecommerce Processes Key Metrics To Measure Current Performance Themes PDF
This slide represents the key performance indicators to track and monitor the performance of ecommerce website to draw effective strategies to tackle the problems. It includes key metrics for ecommerce website performance measurement such as average order value and shopping cart abandonment rate. Do you know about Slidesgeeks Implementing Management System To Enhance Ecommerce Processes Key Metrics To Measure Current Performance Themes PDF. These are perfect for delivering any kind od presentation. Using it, create PowerPoint presentations that communicate your ideas and engage audiences. Save time and effort by using our pre designed presentation templates that are perfect for a wide range of topic. Our vast selection of designs covers a range of styles, from creative to business, and are all highly customizable and easy to edit. Download as a PowerPoint template or use them as Google Slides themes.
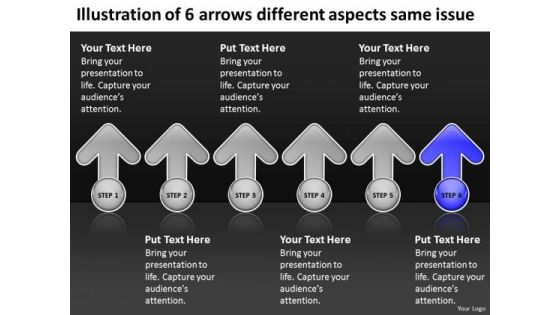
6 Arrows Different Aspects Same Issue Ppt Sample Business Plan PowerPoint Templates
We present our 6 arrows different aspects same issue ppt sample business plan PowerPoint templates.Use our Arrows PowerPoint Templates because they help to lay the base of your trend of thought. Present our Shapes PowerPoint Templates because it Creates a winner with your passion and dream. Download our Circle Charts PowerPoint Templates because the structure of our templates allows you to effectively highlight the key issues concerning the growth of your business. Present our Signs PowerPoint Templates because there are various viable propositions available to further your commercial interests. Use our Business PowerPoint Templates because it illustrates the city with a lasting tryst with resilience. You epitomise the qualities that give your city its fame.Use these PowerPoint slides for presentations relating to 3d, achievement, aim, arrow, business, career, chart, communication, competition, concept, direction, financial, flying, forward, gain, going, gold, golden, graphic, group, grow, grow up, growing, growth, icon, illustration, image, leader, leadership, line, market, motion, one, progress, reflection, sign, silver, success, symbol, team, teamwork, together, turn, two, up, upward, way, white, win, winner. The prominent colors used in the PowerPoint template are Blue navy, Gray, White. People tell us our 6 arrows different aspects same issue ppt sample business plan PowerPoint templates are visually appealing. Use our career PowerPoint templates and PPT Slides are Bold. Use our 6 arrows different aspects same issue ppt sample business plan PowerPoint templates are Gorgeous. PowerPoint presentation experts tell us our competition PowerPoint templates and PPT Slides are One-of-a-kind. People tell us our 6 arrows different aspects same issue ppt sample business plan PowerPoint templates are Nice. Customers tell us our competition PowerPoint templates and PPT Slides are Dazzling. Coach your organization with our 6 Arrows Different Aspects Same Issue Ppt Sample Business Plan PowerPoint Templates. You will come out on top.
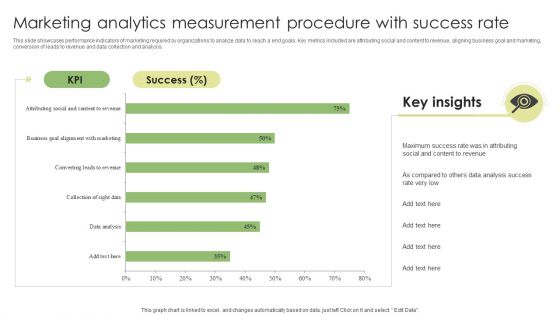
Marketing Analytics Measurement Procedure With Success Rate Guidelines PDF
This slide showcases performance indicators of marketing required by organizations to analyze data to reach a end goals. Key metrics included are attributing social and content to revenue, aligning business goal and marketing, conversion of leads to revenue and data collection and analysis. Showcasing this set of slides titled Marketing Analytics Measurement Procedure With Success Rate Guidelines PDF. The topics addressed in these templates areMarketing Analytics Measurement, Procedure With Success Rate. All the content presented in this PPT design is completely editable. Download it and make adjustments in color, background, font etc. as per your unique business setting.
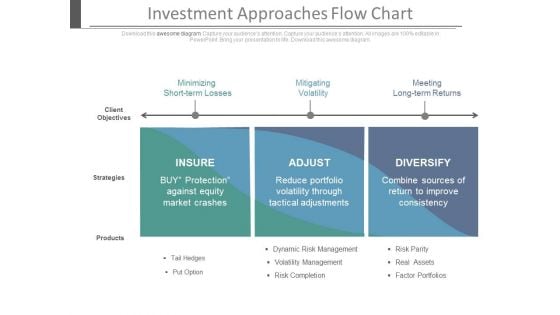
Investment Approaches Flow Chart Ppt Slides
This is an investment approached flow chart ppt slides. This is a three stage process. The stages in this process are marketing, business, success.
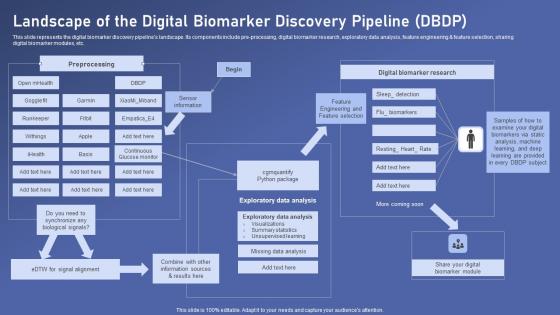
Landscape Of The Digital Biomarker Biomedical Data Science And Health Informatics Diagrams Pdf
This slide represents the digital biomarker discovery pipelines landscape. Its components include pre processing, digital biomarker research, exploratory data analysis, feature engineering and feature selection, sharing digital biomarker modules, etc. This Landscape Of The Digital Biomarker Biomedical Data Science And Health Informatics Diagrams Pdf from Slidegeeks makes it easy to present information on your topic with precision. It provides customization options, so you can make changes to the colors, design, graphics, or any other component to create a unique layout. It is also available for immediate download, so you can begin using it right away. Slidegeeks has done good research to ensure that you have everything you need to make your presentation stand out. Make a name out there for a brilliant performance. This slide represents the digital biomarker discovery pipelines landscape. Its components include pre processing, digital biomarker research, exploratory data analysis, feature engineering and feature selection, sharing digital biomarker modules, etc.
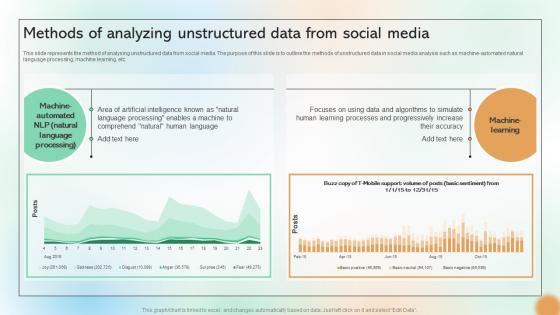
Methods Of Analyzing Unstructured Data From Social Media Cracking The Code Of Social Media
This slide represents the method of analysing unstructured data from social media. The purpose of this slide is to outline the methods of unstructured data in social media analysis such as machine automated natural language processing, machine learning, etc. Want to ace your presentation in front of a live audience Our Methods Of Analyzing Unstructured Data From Social Media Cracking The Code Of Social Media can help you do that by engaging all the users towards you. Slidegeeks experts have put their efforts and expertise into creating these impeccable powerpoint presentations so that you can communicate your ideas clearly. Moreover, all the templates are customizable, and easy-to-edit and downloadable. Use these for both personal and commercial use. This slide represents the method of analysing unstructured data from social media. The purpose of this slide is to outline the methods of unstructured data in social media analysis such as machine automated natural language processing, machine learning, etc.
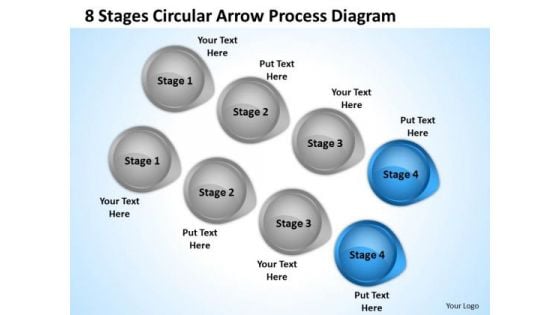
Define Parallel Processing 8 Stages Circular Arrow Diagram PowerPoint Slides
We present our define parallel processing 8 stages circular arrow diagram PowerPoint Slides.Present our Business PowerPoint Templates because You are working at that stage with an air of royalty. Let our PowerPoint Templates and Slides be the jewels in your crown. Present our Circle Charts PowerPoint Templates because Our PowerPoint Templates and Slides are like the strings of a tennis racquet. Well strung to help you serve aces. Use our Arrows PowerPoint Templates because It will get your audience in sync. Download and present our Shapes PowerPoint Templates because Our PowerPoint Templates and Slides will embellish your thoughts. See them provide the desired motivation to your team. Present our Signs PowerPoint Templates because Our PowerPoint Templates and Slides are aesthetically designed to attract attention. We gaurantee that they will grab all the eyeballs you need.Use these PowerPoint slides for presentations relating to 3d, abstract, analysis, arrow, background, business, button, chart, circle, circular, color, concept, conservation, cycle, development, diagram, direction, eco, ecology, energy, environment, flow, flowchart, globe, graphic, growing, growth, icon, internet, isolated, object, power, process, protection, recyclable, recycle, recycling, render, resource, saving, sign, solution, sphere, statistic, sustainable, symbol, technology, white. The prominent colors used in the PowerPoint template are Blue, Gray, Black. You can be sure our define parallel processing 8 stages circular arrow diagram PowerPoint Slides effectively help you save your valuable time. People tell us our chart PowerPoint templates and PPT Slides provide you with a vast range of viable options. Select the appropriate ones and just fill in your text. You can be sure our define parallel processing 8 stages circular arrow diagram PowerPoint Slides are specially created by a professional team with vast experience. They diligently strive to come up with the right vehicle for your brilliant Ideas. Use our chart PowerPoint templates and PPT Slides are aesthetically designed to attract attention. We guarantee that they will grab all the eyeballs you need. Presenters tell us our define parallel processing 8 stages circular arrow diagram PowerPoint Slides will make you look like a winner. We assure you our circle PowerPoint templates and PPT Slides are designed by a team of presentation professionals. Our Define Parallel Processing 8 Stages Circular Arrow Diagram PowerPoint Slides are created with professional insight. Use them and give your group a a winning vision.
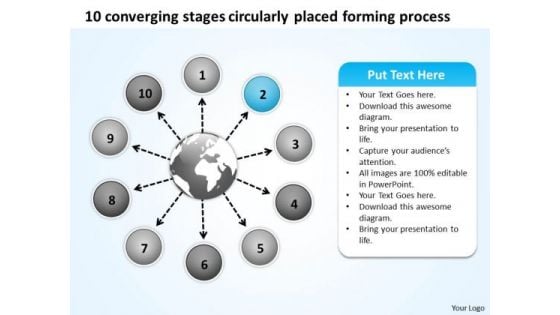
10 Converging Stages Circularly Placed Forming Process Cycle Flow Network PowerPoint Slides
We present our 10 converging stages circularly placed forming process Cycle Flow Network PowerPoint Slides.Present our Process and flows PowerPoint Templates because the gears of youthful minds are useful, therefore set them in motion. Download our Circle charts PowerPoint Templates because they represent the proress in our lives. Use our Ring charts PowerPoint Templates because it gives a core idea about various enveloping layers. Present our Arrows PowerPoint Templates because there are a bucketful of brilliant ideas swirling around within your group. Use our Business PowerPoint Templates because you can Flutter your wings and enchant the world. Impress them with the innate attractiveness of your thoughts and words.Use these PowerPoint slides for presentations relating to Arrow, blank, business, chart, circle, concept, connection, cycle, development, diagram, direction, element, environment, exchange, finance, financial, flow, graph, graphic, graphic presentation, group, icon, illustration, investment, isolated, isometric, market, motion, movement, organization, passive income, perspective, process, process chart, recycle, report, ring, sign, step, stock, success, symbol. The prominent colors used in the PowerPoint template are Green , Black, Gray. You can be sure our 10 converging stages circularly placed forming process Cycle Flow Network PowerPoint Slides are Whimsical. Presenters tell us our connection PowerPoint templates and PPT Slides are Wistful. We assure you our 10 converging stages circularly placed forming process Cycle Flow Network PowerPoint Slides are Majestic. Customers tell us our chart PowerPoint templates and PPT Slides are Delightful. Presenters tell us our 10 converging stages circularly placed forming process Cycle Flow Network PowerPoint Slides are Energetic. You can be sure our cycle PowerPoint templates and PPT Slides are One-of-a-kind. Establish the fundamentals of the venture. Fix the parameters. with our 10 Converging Stages Circularly Placed Forming Process Cycle Flow Network PowerPoint Slides.
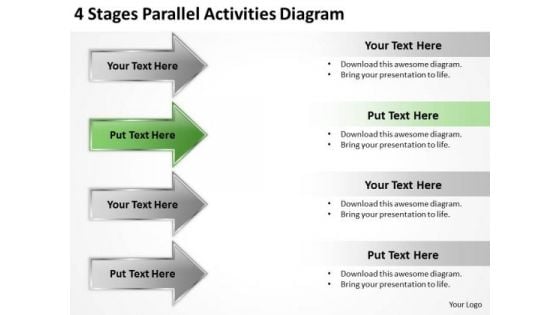
Applications Of Parallel Processing 4 Stages Activities Diagram PowerPoint Templates
We present our applications of parallel processing 4 stages activities diagram PowerPoint templates.Download our Arrows PowerPoint Templates because Your ideas provide food for thought. Our PowerPoint Templates and Slides will help you create a dish to tickle the most discerning palate. Download our Steps PowerPoint Templates because Our PowerPoint Templates and Slides will effectively help you save your valuable time. They are readymade to fit into any presentation structure. Present our Business PowerPoint Templates because You are well armed with penetrative ideas. Our PowerPoint Templates and Slides will provide the gunpowder you need. Download and present our Process and Flows PowerPoint Templates because Our PowerPoint Templates and Slides will let you meet your Deadlines. Use our Flow Charts PowerPoint Templates because you can Add colour to your speech with our PowerPoint Templates and Slides. Your presentation will leave your audience speechless.Use these PowerPoint slides for presentations relating to Accounting, arrow, art, bar, blue, business, calculation, chart, collection,company, elements, diagram, directive, expense, finance, firm, forecast,future, gain, graph, grow, growth, icon, illustration, income, line, market, measure,objects, office, profit, progress, rate, set, statistic, stock, success, two, up, . The prominent colors used in the PowerPoint template are Green, Gray, Black. The feedback we get is that our applications of parallel processing 4 stages activities diagram PowerPoint templates will impress their bosses and teams. Professionals tell us our bar PowerPoint templates and PPT Slides are readymade to fit into any presentation structure. Use our applications of parallel processing 4 stages activities diagram PowerPoint templates will help you be quick off the draw. Just enter your specific text and see your points hit home. Presenters tell us our collection PowerPoint templates and PPT Slides are designed to make your presentations professional. You can be sure our applications of parallel processing 4 stages activities diagram PowerPoint templates will save the presenter time. PowerPoint presentation experts tell us our art PowerPoint templates and PPT Slides are incredible easy to use. Well begun is half done. Get a dream beginning with our Applications Of Parallel Processing 4 Stages Activities Diagram PowerPoint Templates.
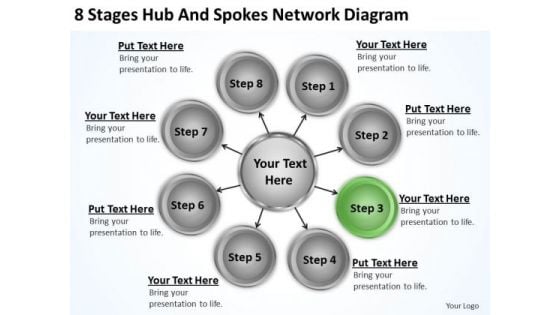
Business Processes 8 Stages Hub And Spokes Network Diagram Ppt 4 PowerPoint Slides
We present our business processes 8 stages hub and spokes network diagram ppt 4 PowerPoint Slides.Download our Industrial PowerPoint Templates because You canTake a leap off the starting blocks with our PowerPoint Templates and Slides. They will put you ahead of the competition in quick time. Download our Arrows PowerPoint Templates because Our PowerPoint Templates and Slides will give good value for money. They also have respect for the value of your time. Download our Signs PowerPoint Templates because It can be used to Set your controls for the heart of the sun. Our PowerPoint Templates and Slides will be the propellant to get you there. Download and present our Shapes PowerPoint Templates because Our PowerPoint Templates and Slides are created with admirable insight. Use them and give your group a sense of your logical mind. Download our Process and Flows PowerPoint Templates because Our PowerPoint Templates and Slides will help you be quick off the draw. Just enter your specific text and see your points hit home.Use these PowerPoint slides for presentations relating to 3d, abstract, arrow, art, background, blank, business, chart, circle, concept, connection, cycle, development, diagram, direction, element, environment, exchange, finance, financial, flow, graph, graphic, graphic presentation, group, icon, illustration, investment, isolated, isometric, market, motion, movement, organization, passive income, perspective, presentation, process, process chart, recycle, report, ring, sign, step, stock, success, symbol, teamwork, text. The prominent colors used in the PowerPoint template are Green, Gray, White. Great presentations happen with our Business Processes 8 Stages Hub And Spokes Network Diagram Ppt 4 PowerPoint Slides. Try us out and see what a difference our templates make.
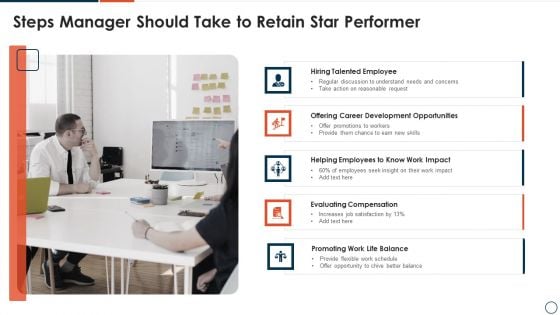
Steps Manager Should Take To Retain Star Performer Infographics PDF
Presenting steps manager should take to retain star performer infographics pdf to dispense important information. This template comprises five stages. It also presents valuable insights into the topics including hiring talented employee, evaluating compensation, promoting work life balance. This is a completely customizable PowerPoint theme that can be put to use immediately. So, download it and address the topic impactfully.
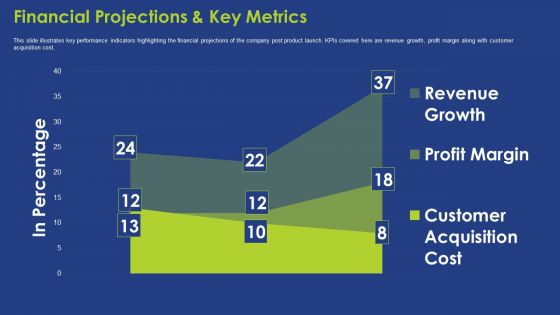
Financial Projections And Key Metrics Ppt Summary Background PDF
This slide illustrates key performance indicators highlighting the financial projections of the company post product launch. KPIs covered here are revenue growth, profit margin along with customer acquisition cost. Deliver an awe inspiring pitch with this creative financial projections and key metrics ppt summary background pdf bundle. Topics like financial projections and key metrics can be discussed with this completely editable template. It is available for immediate download depending on the needs and requirements of the user.
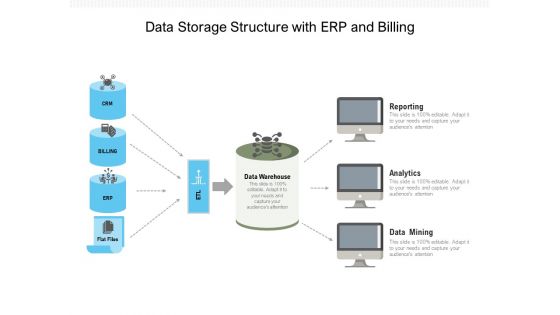
Data Storage Structure With ERP And Billing Ppt PowerPoint Presentation Gallery Outline PDF
Presenting data storage structure with erp and billing ppt powerpoint presentation gallery outline pdf to dispense important information. This template comprises four stages. It also presents valuable insights into the topics including reporting, analytics, data mining. This is a completely customizable PowerPoint theme that can be put to use immediately. So, download it and address the topic impactfully.

Business Flowchart 3d Man With Blog And Globe PowerPoint Templates
We present our business flowchart 3d man with blog and globe PowerPoint templates.Download our Global PowerPoint Templates because It will Raise the bar of your Thoughts. They are programmed to take you to the next level. Use our People PowerPoint Templates because It can Bubble and burst with your ideas. Download and present our Business PowerPoint Templates because Our PowerPoint Templates and Slides will let you meet your Deadlines. Present our Internet PowerPoint Templates because Our PowerPoint Templates and Slides are aesthetically designed to attract attention. We gaurantee that they will grab all the eyeballs you need. Present our Computer PowerPoint Templates because Our PowerPoint Templates and Slides will let you Hit the right notes. Watch your audience start singing to your tune.Use these PowerPoint slides for presentations relating to 3d, Blog, Character, Communication, Computer, Concepts, Connecting, Continent, Data, Discussion, Earth, Figure, Friendship, Global, Guy, Human, Icon, Idea, Information, Internet, Leadership, Manager, Map, Medium, Men, Message, Network, Page, People, Person, Puppet, Render, Shapes, Sign, Standing, Symbol, Text, Three-Dimensional, Web, Weblog, World, Www. The prominent colors used in the PowerPoint template are Blue, White, Gray. Use our business flowchart 3d man with blog and globe PowerPoint templates will make the presenter successul in his career/life. We assure you our Concepts PowerPoint templates and PPT Slides will make the presenter look like a pro even if they are not computer savvy. Use our business flowchart 3d man with blog and globe PowerPoint templates will save the presenter time. Customers tell us our Continent PowerPoint templates and PPT Slides have awesome images to get your point across. Presenters tell us our business flowchart 3d man with blog and globe PowerPoint templates are topically designed to provide an attractive backdrop to any subject. PowerPoint presentation experts tell us our Character PowerPoint templates and PPT Slides are designed by a team of presentation professionals. Become popular for your presentation skills with our Business Flowchart 3d Man With Blog And Globe PowerPoint Templates. You'll always stay ahead of the game.

Business Diagram Three Heads With Pie For Data Driven Technology PowerPoint Slide
This business diagram displays three human faces with pie charts. This Power Point template has been designed to compare and present business data. You may use this diagram to impart professional appearance to your presentations.
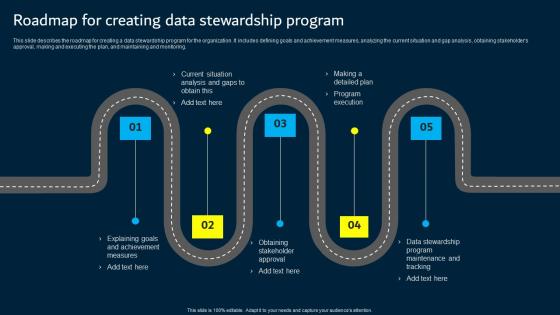
Roadmap For Creating Data Stewardship Program Data Custodianship Introduction Pdf
This slide describes the roadmap for creating a data stewardship program for the organization. It includes defining goals and achievement measures, analyzing the current situation and gap analysis, obtaining stakeholder s approval, making and executing the plan, and maintaining and monitoring. Are you searching for a Roadmap For Creating Data Stewardship Program Data Custodianship Introduction Pdf that is uncluttered, straightforward, and original Its easy to edit, and you can change the colors to suit your personal or business branding. For a presentation that expresses how much effort you have put in, this template is ideal With all of its features, including tables, diagrams, statistics, and lists, its perfect for a business plan presentation. Make your ideas more appealing with these professional slides. Download Roadmap For Creating Data Stewardship Program Data Custodianship Introduction Pdf from Slidegeeks today. This slide describes the roadmap for creating a data stewardship program for the organization. It includes defining goals and achievement measures, analyzing the current situation and gap analysis, obtaining stakeholder s approval, making and executing the plan, and maintaining and monitoring.
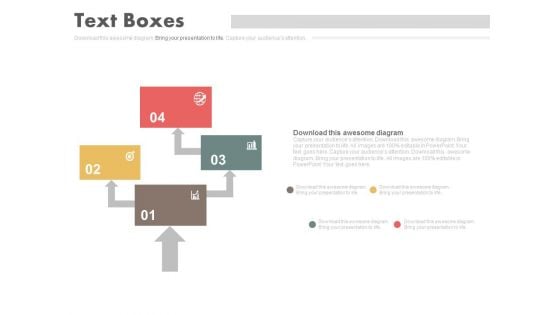
Four Steps Arrow Chart Design Powerpoint Slides
This PowerPoint template has been designed with four steps arrow chart. This PPT slide can be used to prepare presentations for marketing reports and also for financial data analysis. You can download finance PowerPoint template to prepare awesome presentations.
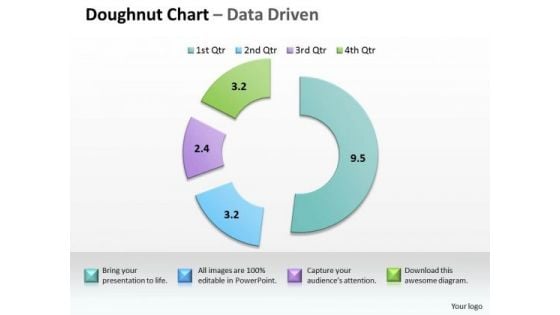
Data Analysis In Excel Completion Project Management PowerPoint Templates
Touch Base With Our data analysis in excel completion project management Powerpoint Templates . Review Your Growth With Your Audience.

Data Analysis Excel Bar Graph To Compare PowerPoint Templates
Get The Domestics Right With Our data analysis excel bar graph to compare Powerpoint Templates. Create The Base For Thoughts To Grow.
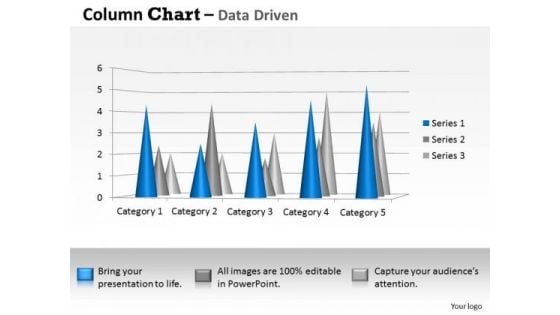
Data Analysis Techniques 3d Distribution Of In Sets PowerPoint Templates
Your Thoughts Will Be The Main Course. Provide The Dressing With Our data analysis techniques 3d distribution of in sets Powerpoint Templates .
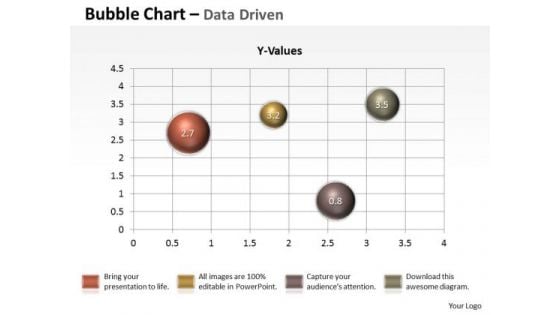
Data Analysis Techniques 3d Graphical Presentation Of PowerPoint Templates
Our data analysis techniques 3d graphical presentation of Powerpoint Templates Will Follow The Drill. They Accomplish The Task Assigned To Them.
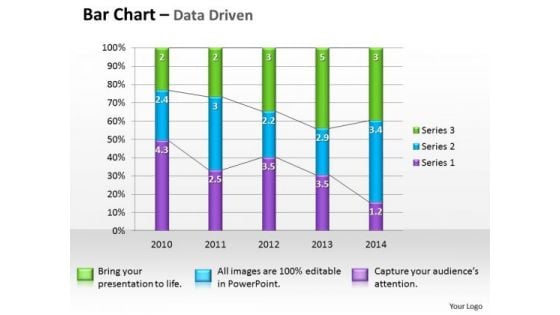
Microsoft Excel Data Analysis Bar Graph PowerPoint Templates
Double The Impact With Our microsoft excel data analysis bar graph Powerpoint Templates . Your Thoughts Will Have An Imposing Effect.

 Home
Home