Dashboard Icon
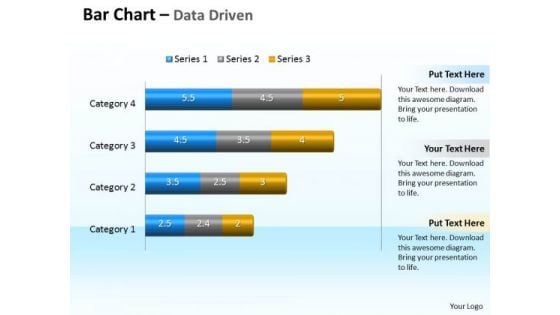
Data Analysis Programs 3d Bar Chart To Compare Categories PowerPoint Templates
Discover Decisive Moments With Our data analysis programs 3d bar chart to compare categories Powerpoint Templates . They Help Make That Crucial Difference.
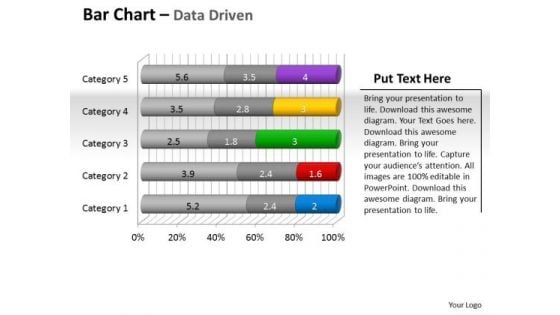
Data Analysis Programs 3d Bar Chart To Put Information PowerPoint Templates
Draw Up Your Agenda On Our data analysis programs 3d bar chart to put information Powerpoint Templates . Coax Your Audience Into Acceptance.
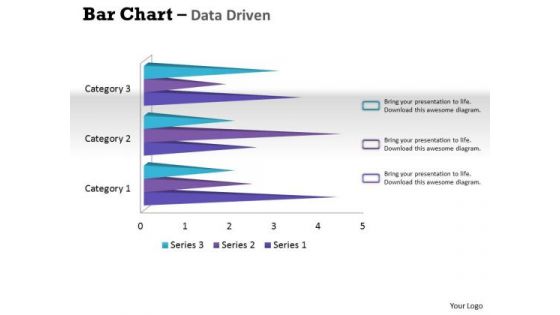
Data Analysis Techniques 3d Bar Chart For Financial Solutions PowerPoint Templates
Make Your Dreams A Reality With Our data analysis techniques 3d bar chart for financial solutions Powerpoint Templates . Your Ideas Will Begin To Take Shape.

Data Analysis Template Driven Express Business Facts Pie Chart PowerPoint Slides Templates
Display Your Drive On Our data analysis template driven express business facts pie chart powerpoint slides Templates . Invigorate The Audience With Your Fervor.
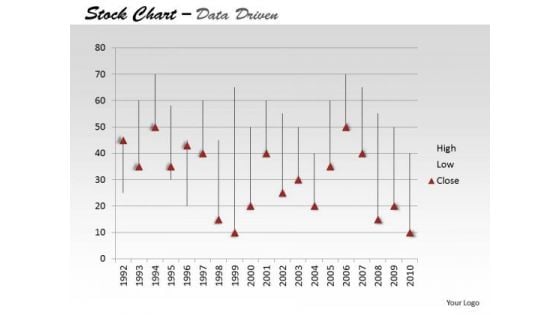
Data Analysis Template Driven Ineract With Stock Chart PowerPoint Slides Templates
Drive Your Passion With Our data analysis template driven ineract with stock chart powerpoint slides Templates . Steer Yourself To Achieve Your Aims.
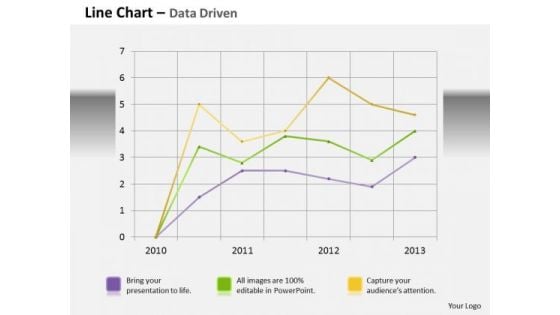
Data Analysis Template Driven Line Chart Business Graph PowerPoint Slides Templates
Bottle Your Thoughts In Our data analysis template driven line chart business graph powerpoint slides Templates . Pass It Around For Your Audience To Sip.
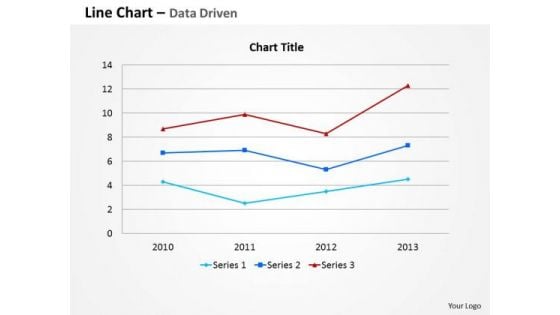
Data Analysis Template Driven Line Chart For Business Information PowerPoint Slides Templates
Your Thoughts Are Dripping With Wisdom. Lace It With Our data analysis template driven line chart for business information powerpoint slides Templates .
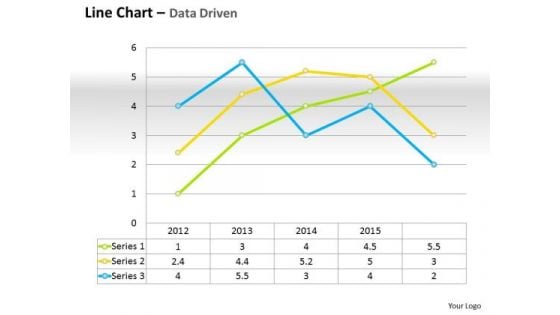
Data Analysis Template Driven Line Chart For Business Performance PowerPoint Slides Templates
Do Not Allow Things To Drift. Ring In Changes With Our data analysis template driven line chart for business performance powerpoint slides Templates .
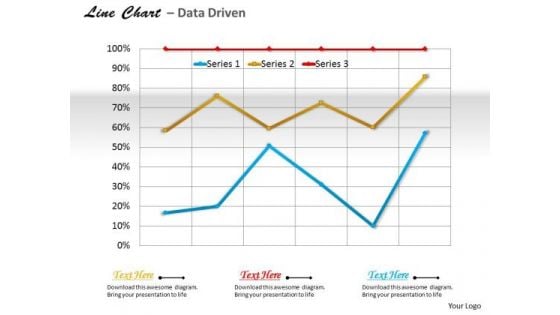
Data Analysis Template Driven Line Chart For Business Trends PowerPoint Slides Templates
Use Our data analysis template driven line chart for business trends powerpoint slides Templates As The Bit. Drill Your Thoughts Into Their Minds.
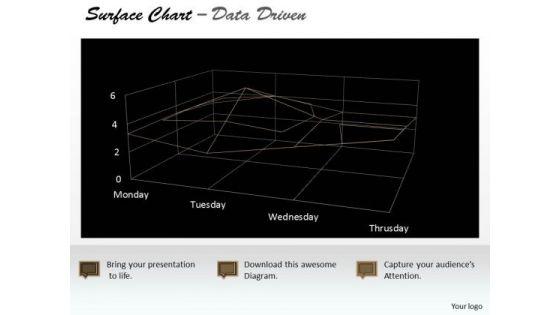
Data Analysis Template Driven Surface Chart Indicating Areas PowerPoint Slides Templates
Highlight Your Drive With Our data analysis template driven surface chart indicating areas powerpoint slides Templates . Prove The Fact That You Have Control.
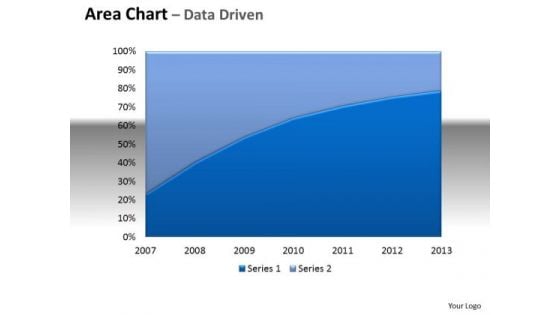
Financial Data Analysis Area Chart With Plotted Line Center PowerPoint Templates
Be The Doer With Our financial data analysis area chart with plotted line center Powerpoint Templates . Put Your Thoughts Into Practice.
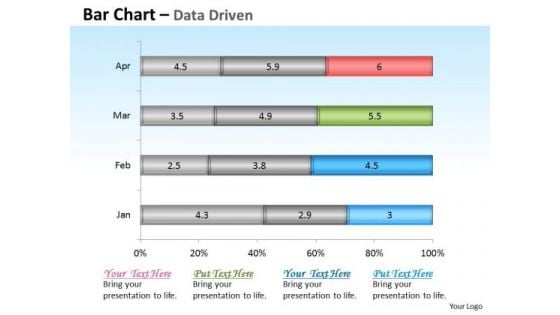
Financial Data Analysis Driven Base Bar Chart Design PowerPoint Slides Templates
Get The Domestics Right With Our financial data analysis driven base bar chart design powerpoint slides Templates . Create The Base For Thoughts To Grow.
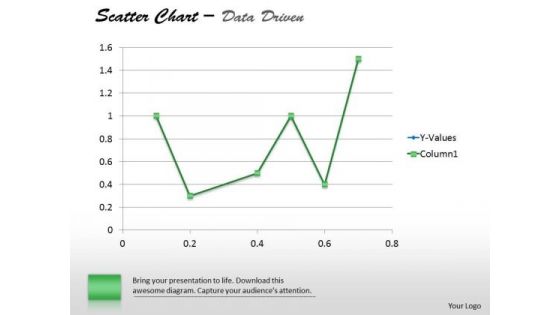
Financial Data Analysis Driven Demonstrate Statistics With Scatter Chart PowerPoint Slides Templates
Establish The Dominance Of Your Ideas. Our financial data analysis driven demonstrate statistics with scatter chart powerpoint slides Templates Will Put Them On Top.
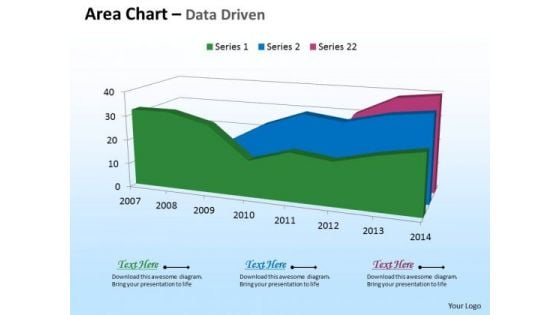
Microsoft Excel Data Analysis 3d Area Chart For Time Based PowerPoint Templates
Deliver The Right Dose With Our microsoft excel data analysis 3d area chart for time based Powerpoint Templates . Your Ideas Will Get The Correct Illumination.
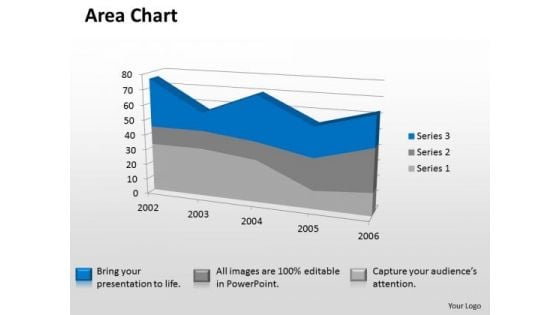
Microsoft Excel Data Analysis 3d Area Chart Showimg Change In Values PowerPoint Templates
Our microsoft excel data analysis 3d area chart showimg change in values Powerpoint Templates Deliver At Your Doorstep. Let Them In For A Wonderful Experience.
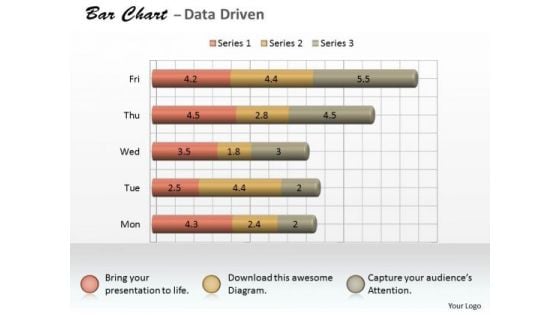
Microsoft Excel Data Analysis 3d Bar Chart As Research Tool PowerPoint Templates
Knock On The Door To Success With Our microsoft excel data analysis 3d bar chart as research tool Powerpoint Templates . Be Assured Of Gaining Entry.
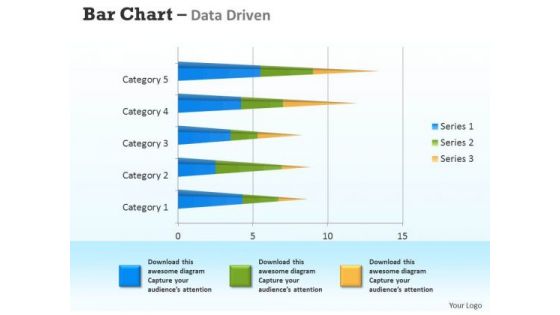
Microsoft Excel Data Analysis 3d Bar Chart For Analyzing Survey PowerPoint Templates
Connect The Dots With Our microsoft excel data analysis 3d bar chart for analyzing survey Powerpoint Templates . Watch The Whole Picture Clearly Emerge.
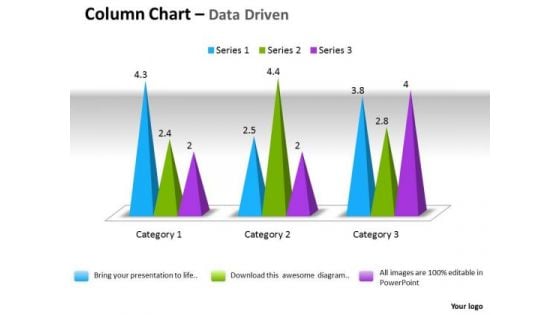
Microsoft Excel Data Analysis 3d Change In Business Process Chart PowerPoint Templates
Double Your Chances With Our microsoft excel data analysis 3d change in business process chart Powerpoint Templates . The Value Of Your Thoughts Will Increase Two-Fold.
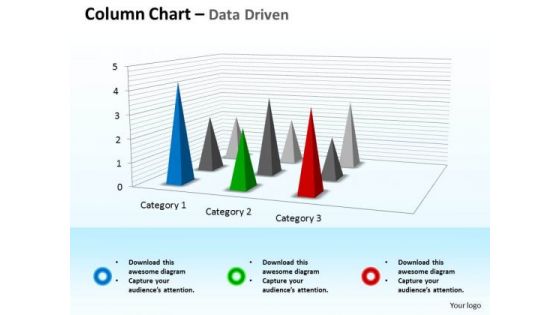
Microsoft Excel Data Analysis 3d Chart For Business Observation PowerPoint Templates
Double Up Our microsoft excel data analysis 3d chart for business observation Powerpoint Templates With Your Thoughts. They Will Make An Awesome Pair.
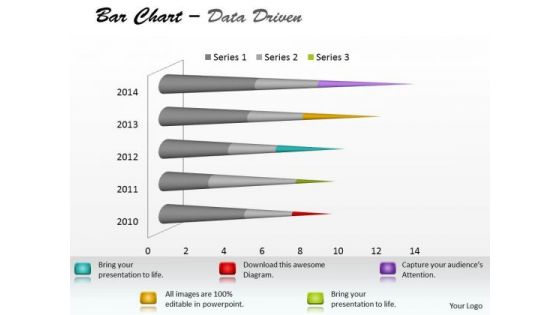
Microsoft Excel Data Analysis Bar Chart To Communicate Information PowerPoint Templates
With Our microsoft excel data analysis bar chart to communicate information Powerpoint Templates You Will Be Doubly Sure. They Possess That Stamp Of Authority.
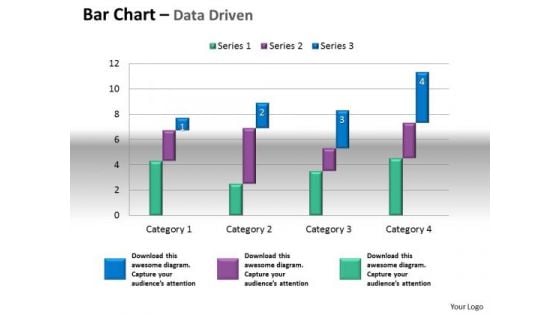
Microsoft Excel Data Analysis Bar Chart To Compare Quantities PowerPoint Templates
Our microsoft excel data analysis bar chart to compare quantities Powerpoint Templates Leave No One In Doubt. Provide A Certainty To Your Views.
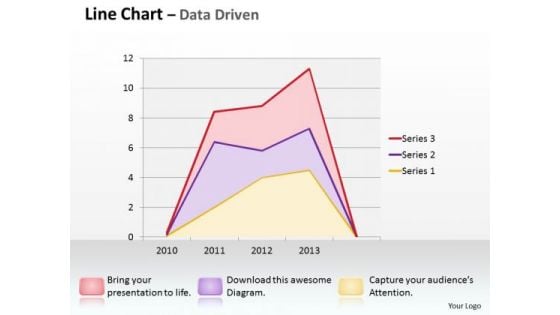
Multivariate Data Analysis Driven Line Chart Shows Revenue Trends PowerPoint Slides Templates
Good Camaraderie Is A Key To Teamwork. Our multivariate data analysis driven line chart shows revenue trends powerpoint slides Templates Can Be A Cementing Force.
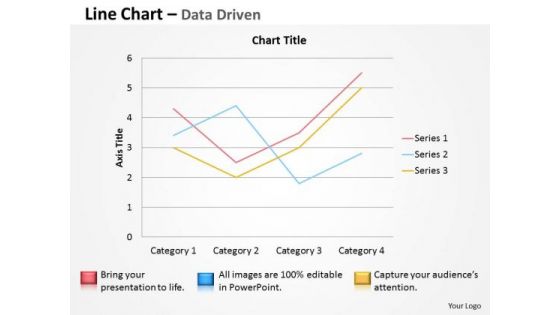
Multivariate Data Analysis Driven Line Chart To Demonstrate PowerPoint Slides Templates
Brace Yourself, Arm Your Thoughts. Prepare For The Hustle With Our multivariate data analysis driven line chart to demonstrate powerpoint slides Templates .
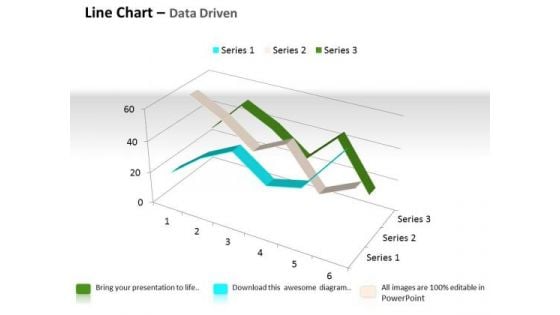
Quantitative Data Analysis 3d Line Chart For Comparison Of PowerPoint Templates
Touch Base With Our quantitative data analysis 3d line chart for comparison of Powerpoint Templates . Review Your Growth With Your Audience.

Quantitative Data Analysis 3d Pie Chart For Business Process PowerPoint Templates
Put Them On The Same Page With Our quantitative data analysis 3d pie chart for business process Powerpoint Templates . Your Team Will Sing From The Same Sheet.
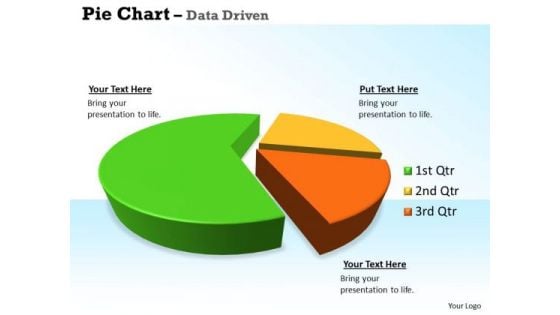
Quantitative Data Analysis 3d Pie Chart For Business Statistics PowerPoint Templates
Our quantitative data analysis 3d pie chart for business statistics Powerpoint Templates Allow You To Do It With Ease. Just Like Picking The Low Hanging Fruit.
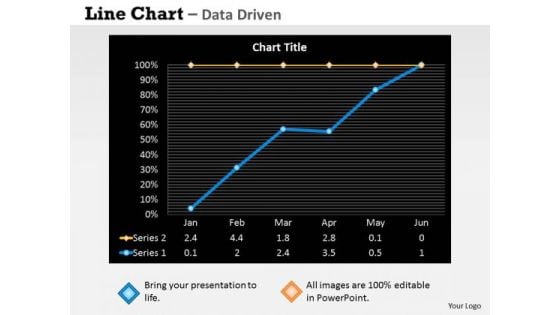
Quantitative Data Analysis Driven Economic Status Line Chart PowerPoint Slides Templates
Be The Dramatist With Our quantitative data analysis driven economic status line chart powerpoint slides Templates . Script Out The Play Of Words.
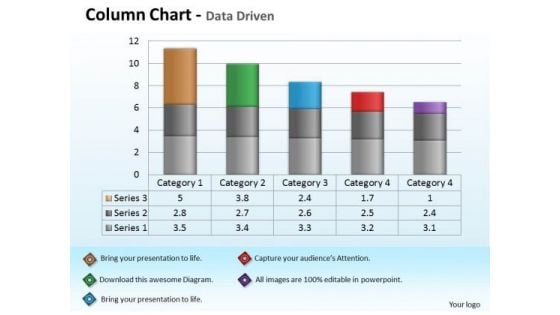
Quantitative Data Analysis Driven Economic With Column Chart PowerPoint Slides Templates
Add Some Dramatization To Your Thoughts. Our quantitative data analysis driven economic with column chart powerpoint slides Templates Make Useful Props.
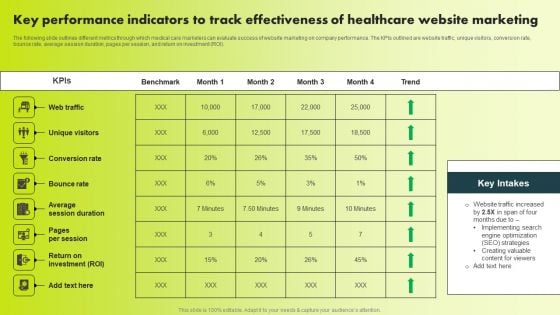
Key Performance Indicators To Track Effectiveness Of Healthcare Website Marketing Themes PDF
The following slide outlines different metrics through which medical care marketers can evaluate success of website marketing on company performance. The KPIs outlined are website traffic, unique visitors, conversion rate, bounce rate, average session duration, pages per session, and return on investment ROI. Whether you have daily or monthly meetings, a brilliant presentation is necessary. Key Performance Indicators To Track Effectiveness Of Healthcare Website Marketing Themes PDF can be your best option for delivering a presentation. Represent everything in detail using Key Performance Indicators To Track Effectiveness Of Healthcare Website Marketing Themes PDF and make yourself stand out in meetings. The template is versatile and follows a structure that will cater to your requirements. All the templates prepared by Slidegeeks are easy to download and edit. Our research experts have taken care of the corporate themes as well. So, give it a try and see the results.
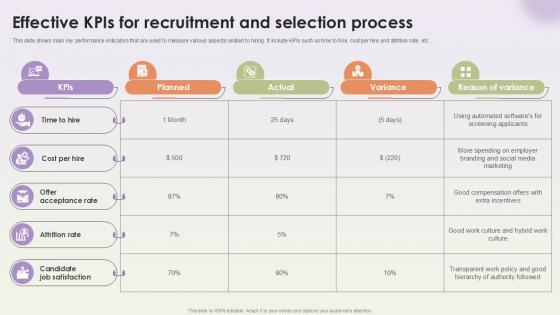
Effective Kpis For Recruitment And Selection Workforce Procurement And Aptitude Evaluation Ppt Presentation
This slide shows main key performance indicators that are used to measure various aspects related to hiring. It include KPIs such as time to hire, cost per hire and attrition rate, etc. Whether you have daily or monthly meetings, a brilliant presentation is necessary. Effective Kpis For Recruitment And Selection Workforce Procurement And Aptitude Evaluation Ppt Presentation can be your best option for delivering a presentation. Represent everything in detail using Effective Kpis For Recruitment And Selection Workforce Procurement And Aptitude Evaluation Ppt Presentation and make yourself stand out in meetings. The template is versatile and follows a structure that will cater to your requirements. All the templates prepared by Slidegeeks are easy to download and edit. Our research experts have taken care of the corporate themes as well. So, give it a try and see the results. This slide shows main key performance indicators that are used to measure various aspects related to hiring. It include KPIs such as time to hire, cost per hire and attrition rate, etc.
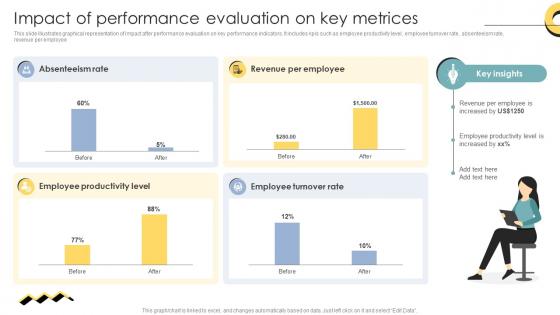
Skill Enhancement Performance Impact Of Performance Evaluation On Key Metrices
This slide illustrates graphical representation of impact after performance evaluation on key performance indicators. It includes kpis such as employee productivity level, employee turnover rate, absenteeism rate, revenue per employee. Do you have to make sure that everyone on your team knows about any specific topic I yes, then you should give Skill Enhancement Performance Impact Of Performance Evaluation On Key Metrices a try. Our experts have put a lot of knowledge and effort into creating this impeccable Skill Enhancement Performance Impact Of Performance Evaluation On Key Metrices. You can use this template for your upcoming presentations, as the slides are perfect to represent even the tiniest detail. You can download these templates from the Slidegeeks website and these are easy to edit. So grab these today This slide illustrates graphical representation of impact after performance evaluation on key performance indicators. It includes kpis such as employee productivity level, employee turnover rate, absenteeism rate, revenue per employee.
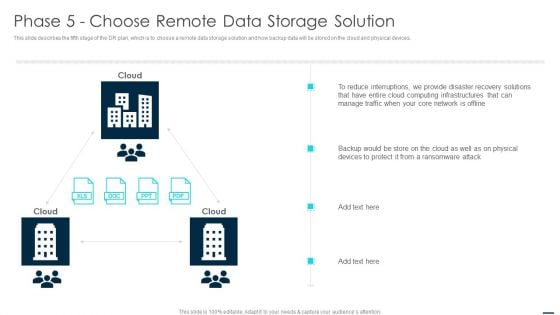
Technology Disaster Recovery Plan Phase 5 Choose Remote Data Storage Solution Professional PDF
This slide describes the fifth stage of the DR plan, which is to choose a remote data storage solution and how backup data will be stored on the cloud and physical devices. Presenting Technology Disaster Recovery Plan Phase 5 Choose Remote Data Storage Solution Professional PDF to provide visual cues and insights. Share and navigate important information on three stages that need your due attention. This template can be used to pitch topics like Network, Cloud, Reduce Interruptions. In addtion, this PPT design contains high resolution images, graphics, etc, that are easily editable and available for immediate download.
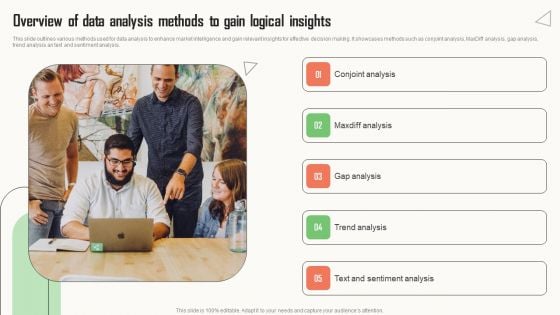
Strategic Market Insight Implementation Guide Overview Of Data Analysis Methods To Gain Logical Insights Themes PDF
This slide outlines various methods used for data analysis to enhance market intelligence and gain relevant insights for effective decision making. It showcases methods such as conjoint analysis, MaxDiff analysis, gap analysis, trend analysis an text and sentiment analysis. Take your projects to the next level with our ultimate collection of Strategic Market Insight Implementation Guide Overview Of Data Analysis Methods To Gain Logical Insights Themes PDF. Slidegeeks has designed a range of layouts that are perfect for representing task or activity duration, keeping track of all your deadlines at a glance. Tailor these designs to your exact needs and give them a truly corporate look with your own brand colors they will make your projects stand out from the rest.
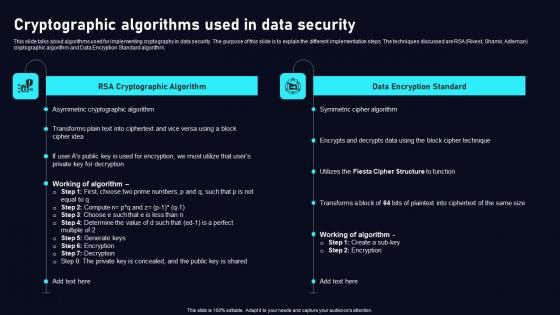
Cryptographic Algorithms Used In Cloud Data Security Using Cryptography Themes Pdf
This slide talks about algorithms used for implementing cryptography in data security. The purpose of this slide is to explain the different implementation steps. The techniques discussed are RSA Rivest, Shamir, Adleman cryptographic algorithm and Data Encryption Standard algorithm. The best PPT templates are a great way to save time, energy, and resources. Slidegeeks have 100 percent editable powerpoint slides making them incredibly versatile. With these quality presentation templates, you can create a captivating and memorable presentation by combining visually appealing slides and effectively communicating your message. Download Cryptographic Algorithms Used In Cloud Data Security Using Cryptography Themes Pdf from Slidegeeks and deliver a wonderful presentation. This slide talks about algorithms used for implementing cryptography in data security. The purpose of this slide is to explain the different implementation steps. The techniques discussed are RSA Rivest, Shamir, Adleman cryptographic algorithm and Data Encryption Standard algorithm.
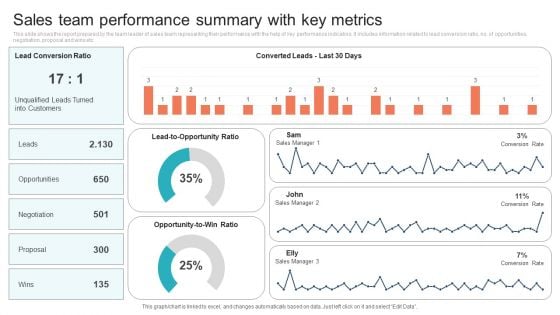
Sales Team Performance Summary With Key Metrics Background PDF
This slide shows the report prepared by the team leader of sales team representing their performance with the help of key performance indicators. It includes information related to lead conversion ratio, no. of opportunities, negotiation, proposal and wins etc. Showcasing this set of slides titled Sales Team Performance Summary With Key Metrics Background PDF. The topics addressed in these templates are Opportunities, Negotiation, Proposal. All the content presented in this PPT design is completely editable. Download it and make adjustments in color, background, font etc. as per your unique business setting.
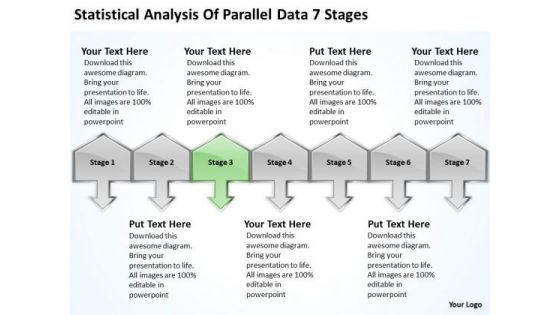
Analysis Of Parallel Data 7 Stages Ppt Franchise Business Plan Sample PowerPoint Slides
We present our analysis of parallel data 7 stages ppt franchise business plan sample PowerPoint Slides.Download our Arrows PowerPoint Templates because You have gained great respect for your brilliant ideas. Use our PowerPoint Templates and Slides to strengthen and enhance your reputation. Download and present our Shapes PowerPoint Templates because you can see clearly through to the bigger bowl ahead. Time your jump to perfection and hit the nail on the head. Download our Metaphors-Visual Concepts PowerPoint Templates because you know that the core of any organisation is the people who work for it. Use our Signs PowerPoint Templates because support groups are an essential element of the on going struggle against cancer. Download our Business PowerPoint Templates because this diagram can set an example to enthuse your team with the passion and fervour of your ideas.Use these PowerPoint slides for presentations relating to achieve, achievement, action, business, chinese, company, concept, conceptual, corporate, definition, idea, macro, market, nature, organization, paintbrush, plan, profit, research, results, sand, shape, single, success, successful, symbol, text, translation, treasure, vision, word. The prominent colors used in the PowerPoint template are Green, Gray, Black. People tell us our analysis of parallel data 7 stages ppt franchise business plan sample PowerPoint Slides are Quaint. Use our action PowerPoint templates and PPT Slides are Nifty. Use our analysis of parallel data 7 stages ppt franchise business plan sample PowerPoint Slides are Ultra. PowerPoint presentation experts tell us our corporate PowerPoint templates and PPT Slides are Magical. People tell us our analysis of parallel data 7 stages ppt franchise business plan sample PowerPoint Slides are Spiffy. Customers tell us our corporate PowerPoint templates and PPT Slides are Dynamic. Preach the value of good business ethics. Our Analysis Of Parallel Data 7 Stages Ppt Franchise Business Plan Sample PowerPoint Slides will keep the faith.
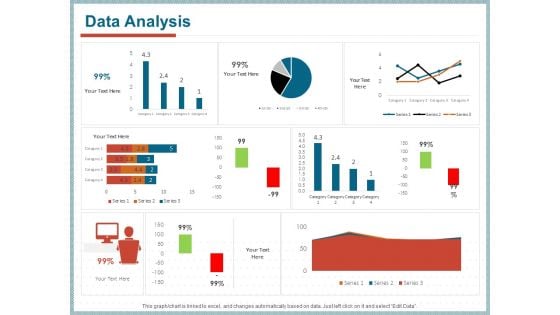
Qualitative Concept Testing Data Analysis Ppt PowerPoint Presentation File Graphics Design PDF
Deliver an awe-inspiring pitch with this creative qualitative concept testing data analysis ppt powerpoint presentation file graphics design pdf bundle. Topics like data analysis can be discussed with this completely editable template. It is available for immediate download depending on the needs and requirements of the user.
Parallel To Each Other Up Direction 6 Stages Best Business Plan Templates PowerPoint Slides
We present our parallel to each other up direction 6 stages best business plan templates PowerPoint Slides.Download our Arrows PowerPoint Templates because using our templates for your colleagues will impart knowledge to feed. Download our Business PowerPoint Templates because spell out your advertising plans to increase market share. The feedback has been positive and productive. Download and present our Signs PowerPoint Templates because It will Give impetus to the hopes of your colleagues. Our PowerPoint Templates and Slides will aid you in winning their trust. Present our Shapes PowerPoint Templates because there are different paths to gain the necessary knowledge to acheive it. Download our Process and Flows PowerPoint Templates because this PPt slide helps you to measure key aspects of the current process and collect relevant data.Use these PowerPoint slides for presentations relating to Abstract, Achievement, Aim, Arrow, Blue, Business, Button, Career, Chart, Color, Communication, Competition, Concept, Development, Direction, Education, Financial, Forecast, Forward, Glossy, Gradient, Graph, Group, Growth, Higher, Icon, Illustration, Increase, Investment, Leader, Leadership, Moving, Onwards, Outlook, Path, Plan, Prediction, Price, Profit, Progress, Property, Sales, Series, Success, Target, Team, Teamwork. The prominent colors used in the PowerPoint template are Yellow, Gray, Black. We assure you our parallel to each other up direction 6 stages best business plan templates PowerPoint Slides are Charming. Use our Arrow PowerPoint templates and PPT Slides are Attractive. Presenters tell us our parallel to each other up direction 6 stages best business plan templates PowerPoint Slides are Striking. PowerPoint presentation experts tell us our Business PowerPoint templates and PPT Slides are Majestic. Customers tell us our parallel to each other up direction 6 stages best business plan templates PowerPoint Slides are Wistful. PowerPoint presentation experts tell us our Chart PowerPoint templates and PPT Slides are Breathtaking. Oversee plans with our Parallel To Each Other Up Direction 6 Stages Best Business Plan Templates PowerPoint Slides. Download without worries with our money back guaranteee.
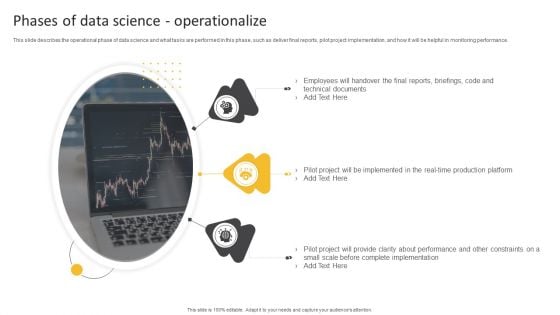
Information Science Phases Of Data Science Operationalize Ppt PowerPoint Presentation Show Display PDF
This slide describes the operational phase of data science and what tasks are performed in this phase, such as deliver final reports, pilot project implementation, and how it will be helpful in monitoring performance.Presenting Information Science Phases Of Data Science Operationalize Ppt PowerPoint Presentation Show Display PDF to provide visual cues and insights. Share and navigate important information on three stages that need your due attention. This template can be used to pitch topics like Technical Documents, Project Implemented, Complete Implementation. In addtion, this PPT design contains high resolution images, graphics, etc, that are easily editable and available for immediate download.
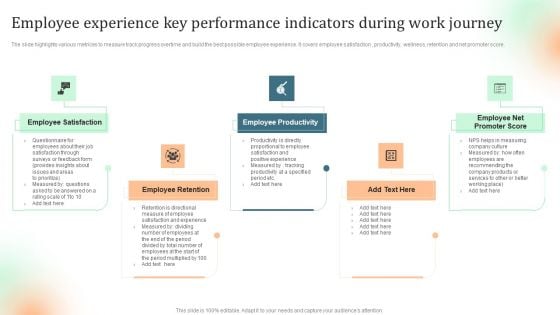
Employee Experience Key Performance Indicators During Work Journey Topics PDF
The slide highlights various metrices to measure track progress overtime and build the best possible employee experience. It covers employee satisfaction , productivity, wellness, retention and net promoter score. Presenting Employee Experience Key Performance Indicators During Work Journey Topics PDF to dispense important information. This template comprises five stages. It also presents valuable insights into the topics including Employee Productivity, Employee Retention, Employee Satisfaction. This is a completely customizable PowerPoint theme that can be put to use immediately. So, download it and address the topic impactfully.
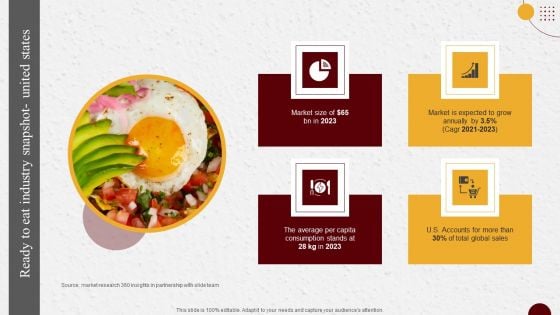
Industry Report Of Packaged Food Products Part 1 Ready To Eat Industry Snapshot United States Elements PDF
Are you searching for a Industry Report Of Packaged Food Products Part 1 Ready To Eat Industry Snapshot United States Elements PDF that is uncluttered, straightforward, and original Its easy to edit, and you can change the colors to suit your personal or business branding. For a presentation that expresses how much effort you have put in, this template is ideal. With all of its features, including tables, diagrams, statistics, and lists, its perfect for a business plan presentation. Make your ideas more appealing with these professional slides. Download Industry Report Of Packaged Food Products Part 1 Ready To Eat Industry Snapshot United States Elements PDF from Slidegeeks today.
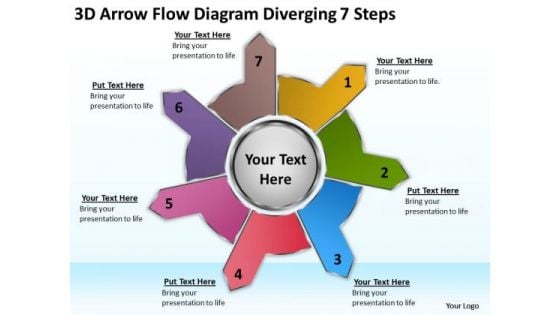
3d Arrow Flow Diagram Diverging 7 Steps Charts And Diagrams PowerPoint Templates
We present our 3d arrow flow diagram diverging 7 steps Charts and Diagrams PowerPoint templates.Use our Arrows PowerPoint Templates because you can Adorn them with your ideas and thoughts. Download and present our Business PowerPoint Templates because you are ready to flap your wings and launch off. All poised are you to touch the sky with glory. Download our Shapes PowerPoint Templates because all elements of the venture are equally critical. Use our Circle Charts PowerPoint Templates because you can Grab the attention of your team with this eye catching template signifying . Download and present our Flow Charts PowerPoint Templates because you have the right arrows in your quiver.Use these PowerPoint slides for presentations relating to 3d, abstract, arrow, art, background, blank, business, chart, circle, concept, connection, cycle, development, diagram, direction, element, environment, exchange, finance, flow, graph, graphic, group, icon, illustration, investment, isolated, isometric, market, motion, movement, organization, passive income, perspective, presentation, process, process chart, recycle, report, ring, sign, step, stock, success, symbol, teamwork, text, vector. The prominent colors used in the PowerPoint template are Yellow, Green, Blue. Customers tell us our 3d arrow flow diagram diverging 7 steps Charts and Diagrams PowerPoint templates are Adorable. PowerPoint presentation experts tell us our arrow PowerPoint templates and PPT Slides are specially created by a professional team with vast experience. They diligently strive to come up with the right vehicle for your brilliant Ideas. People tell us our 3d arrow flow diagram diverging 7 steps Charts and Diagrams PowerPoint templates are Great. People tell us our arrow PowerPoint templates and PPT Slides are Tranquil. Customers tell us our 3d arrow flow diagram diverging 7 steps Charts and Diagrams PowerPoint templates provide great value for your money. Be assured of finding the best projection to highlight your words. People tell us our business PowerPoint templates and PPT Slides are Graceful. Your audience will be absolutely attentive. Fascinate them with our 3d Arrow Flow Diagram Diverging 7 Steps Charts And Diagrams PowerPoint Templates.
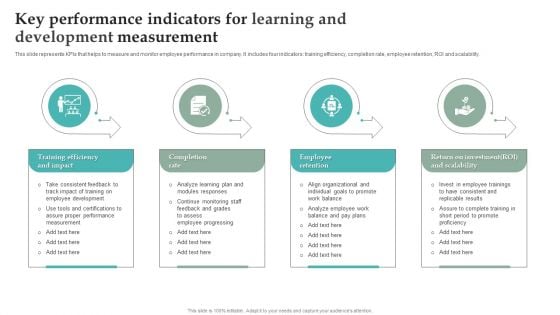
Key Performance Indicators For Learning And Development Measurement Themes PDF
This slide represents KPIs that helps to measure and monitor employee performance in company. It includes four indicators training efficiency, completion rate, employee retention, ROI and scalability. Persuade your audience using this Key Performance Indicators For Learning And Development Measurement Themes PDF. This PPT design covers Four stages, thus making it a great tool to use. It also caters to a variety of topics including Training Efficiency And Impact, Completion Rate Employee Retention. Download this PPT design now to present a convincing pitch that not only emphasizes the topic but also showcases your presentation skills.
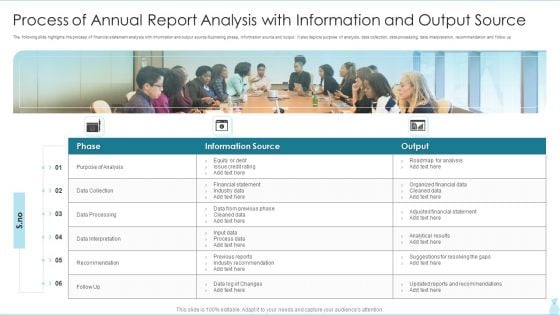
Process Of Annual Report Analysis With Information And Output Source Brochure PDF
The following slide highlights the process of financial statement analysis with information and output source illustrating phase, information source and output. It also depicts purpose of analysis, data collection, data processing, data interpretation, recommendation and follow up.Presenting Process Of Annual Report Analysis With Information And Output Source Brochure PDF to dispense important information. This template comprises six stages. It also presents valuable insights into the topics including Information Source, Financial Statement, Industry Data This is a completely customizable PowerPoint theme that can be put to use immediately. So, download it and address the topic impactfully.
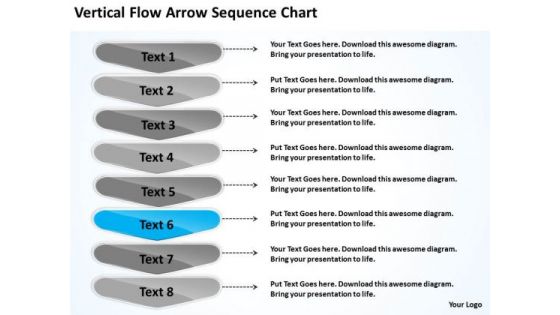
Vertical Flow Arrow Sequence Chart Outline Of Business Plan PowerPoint Templates
We present our vertical flow arrow sequence chart outline of business plan PowerPoint templates.Download our Business PowerPoint Templates because project your ideas to you colleagues and complete the full picture. Use our Marketing PowerPoint Templates because networking is an imperative in todays world. You need to access the views of others. Similarly you need to give access to them of your abilities. Present our Shapes PowerPoint Templates because our creative template will lay down your views. Download and present our Arrows PowerPoint Templates because the foundation stones of many a life. Download and present our Process and Flows PowerPoint Templates because forward thinking is the way to go.Use these PowerPoint slides for presentations relating to Arrow, assortment, attached, blank, blue,business, collection, data, direction,element, green, headline, icon,information, isolated,modern,motion, notepaper, notes, office, page,paper, perspective, pointer, post, red,reflective, reminder, ripped, set,shadow, shiny, sign, striped, symbol, . The prominent colors used in the PowerPoint template are White, Gray, Blue light. PowerPoint presentation experts tell us our vertical flow arrow sequence chart outline of business plan PowerPoint templates are Spiffy. PowerPoint presentation experts tell us our business PowerPoint templates and PPT Slides are designed to make your presentations professional. You can be sure our vertical flow arrow sequence chart outline of business plan PowerPoint templates are Efficacious. You can be sure our collection PowerPoint templates and PPT Slides are incredible easy to use. PowerPoint presentation experts tell us our vertical flow arrow sequence chart outline of business plan PowerPoint templates are Luxurious. People tell us our attached PowerPoint templates and PPT Slides are Adorable. Launch your campaign with our Vertical Flow Arrow Sequence Chart Outline Of Business Plan PowerPoint Templates. Make sure your presentation gets the attention it deserves.
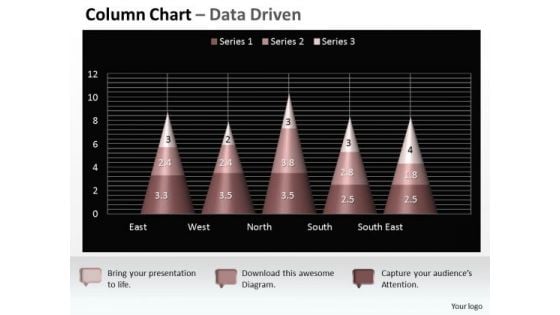
Data Analysis On Excel 3d Chart Shows Interrelated Sets Of PowerPoint Templates
Put Them On The Same Page With Our data analysis on excel 3d chart shows interrelated sets of Powerpoint Templates . Your Team Will Sing From The Same Sheet.
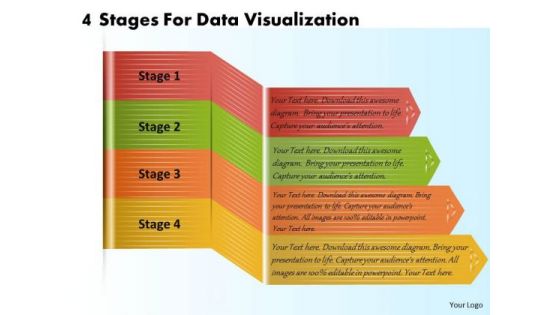
Business Plan And Strategy 4 Stages For Data Visualization Strategic Planning Template Ppt Slide
Your Listeners Will Never Doodle. Our business plan and strategy 4 stages for data visualization strategic planning template ppt slide Powerpoint Templates Will Hold Their Concentration. Do The One Thing With Your Thoughts. Uphold Custom With Our Process and Flows Powerpoint Templates.
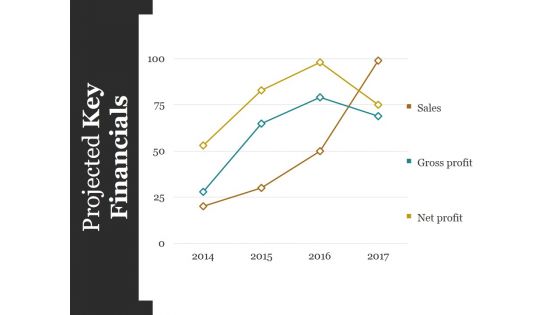
Projected Key Financials Template Ppt PowerPoint Presentation Styles Graphics Design
This is a projected key financials template ppt powerpoint presentation styles graphics design. This is a four stage process. The stages in this process are sales, gross profit, net profit.
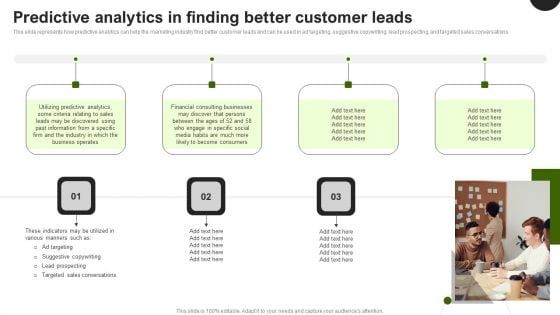
Predictive Analytics In The Age Of Big Data Predictive Analytics In Finding Better Customer Leads Diagrams PDF
This slide represents how predictive analytics can help the marketing industry find better customer leads and can be used in ad targeting, suggestive copywriting, lead prospecting, and targeted sales conversations. Welcome to our selection of the Predictive Analytics In The Age Of Big Data Predictive Analytics In Finding Better Customer Leads Diagrams PDF. These are designed to help you showcase your creativity and bring your sphere to life. Planning and Innovation are essential for any business that is just starting out. This collection contains the designs that you need for your everyday presentations. All of our PowerPoints are 100 percent editable, so you can customize them to suit your needs. This multi purpose template can be used in various situations. Grab these presentation templates today.
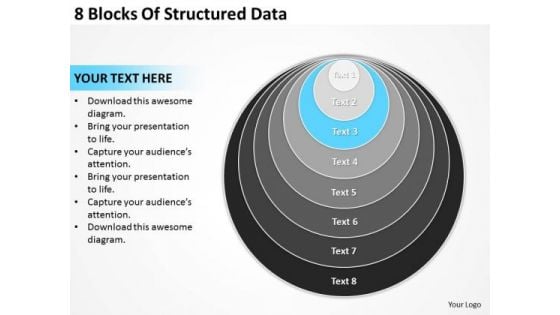
8 Blocks Of Structured Data Strategic Plan PowerPoint Templates
We present our 8 blocks of structured data strategic plan PowerPoint templates.Use our Circle Charts PowerPoint Templates because You can Hit a home run with our PowerPoint Templates and Slides. See your ideas sail into the minds of your audience. Use our Signs PowerPoint Templates because Our PowerPoint Templates and Slides are specially created by a professional team with vast experience. They diligently strive to come up with the right vehicle for your brilliant Ideas. Download and present our Shapes PowerPoint Templates because Our PowerPoint Templates and Slides help you meet the demand of the Market. Just browse and pick the slides that appeal to your intuitive senses. Present our Business PowerPoint Templates because Our PowerPoint Templates and Slides are focused like a searchlight beam. They highlight your ideas for your target audience. Download and present our Metaphors-Visual Concepts PowerPoint Templates because Our PowerPoint Templates and Slides are effectively colour coded to prioritise your plans They automatically highlight the sequence of events you desire.Use these PowerPoint slides for presentations relating to circler, decoration, circled, vector, symbol, orange, textures, illustration, circular, artwork, round, circule, objects, art, sizes. The prominent colors used in the PowerPoint template are Blue, Black, Gray. Delve on the cold facts in detail. Explain the factual analysis on our 8 Blocks Of Structured Data Strategic Plan PowerPoint Templates.
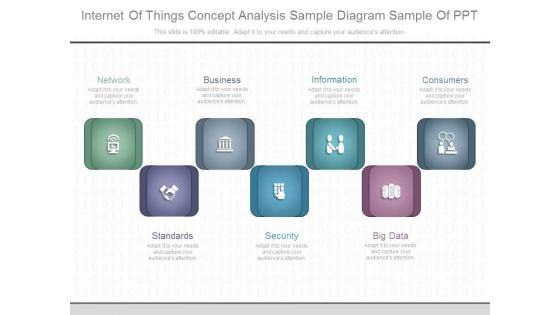
Internet Of Things Concept Analysis Sample Diagram Sample Of Ppt
This is a internet of things concept analysis sample diagram sample of ppt. This is a seven stage process. The stages in this process are network, business, information, consumers, standards, security, big data.
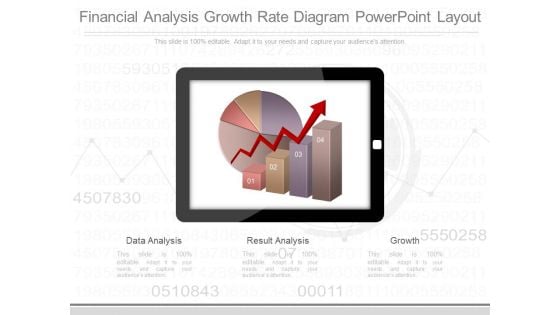
Financial Analysis Growth Rate Diagram Powerpoint Layout
This is a financial analysis growth rate diagram powerpoint layout. This is a three stage process. The stages in this process are data analysis, result analysis, growth.
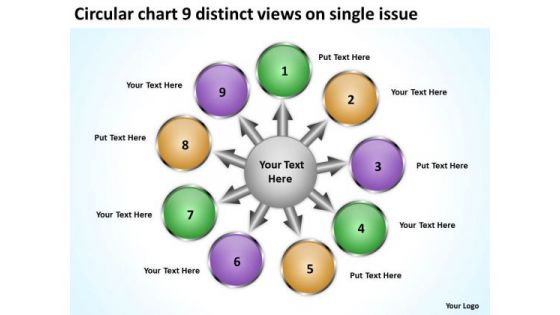
Circular Chart 9 Distinct Views On Single Issue Charts And Networks PowerPoint Templates
We present our circular chart 9 distinct views on single issue Charts and Networks PowerPoint templates.Present our Circle Charts PowerPoint Templates because analyse your plans with equal sincerity. Use our Arrows PowerPoint Templates because the structure of our templates allows you to effectively highlight the key issues concerning the growth of your business. Use our Business PowerPoint Templates because you have secured a name for yourself in the domestic market. Now the time is right to spread your reach to other countries. Download our Shapes PowerPoint Templates because you should explain the process by which you intend to right it. Download our Flow Charts PowerPoint Templates because the great Bald headed Eagle embodies your personality. the eagle eye to seize upon the smallest of oppurtunities.Use these PowerPoint slides for presentations relating to abstract, arrow, art, background, ball, blue, business, button, chart, circle, circular, clip, company, concept, cycle, diagram, edit, editable, element, green, guide, icon, leader, management, marketing, model, numbers, organization, plans, point, presentation, purple, red, report, representation, seven, sphere, stakeholder, team, text, tool, vector, white. The prominent colors used in the PowerPoint template are Purple, Green, Yellow. Customers tell us our circular chart 9 distinct views on single issue Charts and Networks PowerPoint templates are Charming. PowerPoint presentation experts tell us our ball PowerPoint templates and PPT Slides are Dazzling. People tell us our circular chart 9 distinct views on single issue Charts and Networks PowerPoint templates are Magical. People tell us our blue PowerPoint templates and PPT Slides will impress their bosses and teams. Customers tell us our circular chart 9 distinct views on single issue Charts and Networks PowerPoint templates are Graceful. People tell us our chart PowerPoint templates and PPT Slides are Dynamic. Our Circular Chart 9 Distinct Views On Single Issue Charts And Networks PowerPoint Templates will enhance your faith. You will believe in your ability.
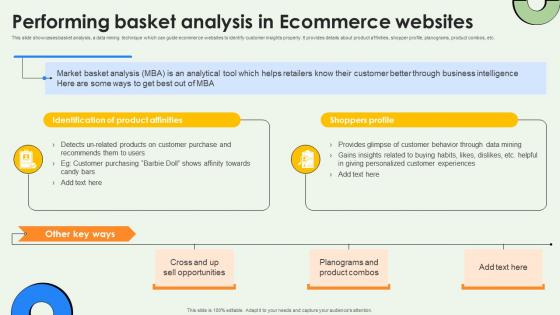
Data Warehousing And Performing Basket Analysis In Ecommerce Websites AI SS V
This slide showcases basket analysis, a data mining technique which can guide ecommerce websites to identify customer insights properly. It provides details about product affinities, shopper profile, planograms, product combos, etc. If you are looking for a format to display your unique thoughts, then the professionally designed Data Warehousing And Performing Basket Analysis In Ecommerce Websites AI SS V is the one for you. You can use it as a Google Slides template or a PowerPoint template. Incorporate impressive visuals, symbols, images, and other charts. Modify or reorganize the text boxes as you desire. Experiment with shade schemes and font pairings. Alter, share or cooperate with other people on your work. Download Data Warehousing And Performing Basket Analysis In Ecommerce Websites AI SS V and find out how to give a successful presentation. Present a perfect display to your team and make your presentation unforgettable. This slide showcases basket analysis, a data mining technique which can guide ecommerce websites to identify customer insights properly. It provides details about product affinities, shopper profile, planograms, product combos, etc.
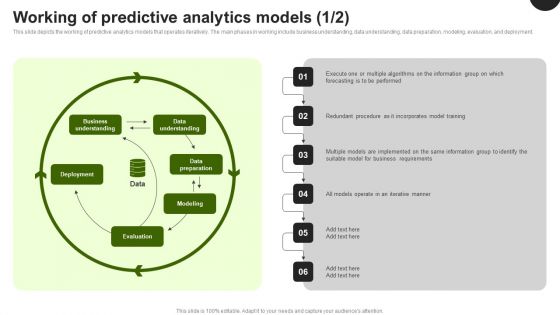
Predictive Analytics In The Age Of Big Data Working Of Predictive Analytics Models Introduction PDF
This slide depicts the working of predictive analytics models that operates iteratively. The main phases in working include business understanding, data understanding, data preparation, modeling, evaluation, and deployment. Find highly impressive Predictive Analytics In The Age Of Big Data Working Of Predictive Analytics Models Introduction PDF on Slidegeeks to deliver a meaningful presentation. You can save an ample amount of time using these presentation templates. No need to worry to prepare everything from scratch because Slidegeeks experts have already done a huge research and work for you. You need to download Predictive Analytics In The Age Of Big Data Working Of Predictive Analytics Models Introduction PDF for your upcoming presentation. All the presentation templates are 100 percent editable and you can change the color and personalize the content accordingly. Download now.
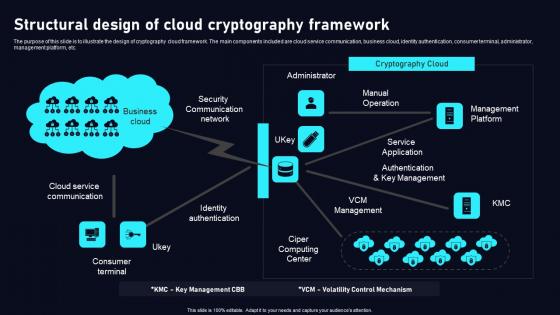
Structural Design Of Cloud Cryptography Cloud Data Security Using Cryptography Themes Pdf
The purpose of this slide is to illustrate the design of cryptography cloud framework. The main components included are cloud service communication, business cloud, identity authentication, consumer terminal, administrator, management platform, etc. If your project calls for a presentation, then Slidegeeks is your go to partner because we have professionally designed, easy to edit templates that are perfect for any presentation. After downloading, you can easily edit Structural Design Of Cloud Cryptography Cloud Data Security Using Cryptography Themes Pdf and make the changes accordingly. You can rearrange slides or fill them with different images. Check out all the handy templates The purpose of this slide is to illustrate the design of cryptography cloud framework. The main components included are cloud service communication, business cloud, identity authentication, consumer terminal, administrator, management platform, etc.

Toolkit For Data Science And Analytics Transition Data Analytics Value Stream Chain Pictures PDF
This slide illustrates the series of activities required for analyzing the data. It contains information such as data preparation, exploratory analysis, and predictive analytics etc. If you are looking for a format to display your unique thoughts, then the professionally designed Toolkit For Data Science And Analytics Transition Data Analytics Value Stream Chain Pictures PDF is the one for you. You can use it as a Google Slides template or a PowerPoint template. Incorporate impressive visuals, symbols, images, and other charts. Modify or reorganize the text boxes as you desire. Experiment with shade schemes and font pairings. Alter, share or cooperate with other people on your work. Download Toolkit For Data Science And Analytics Transition Data Analytics Value Stream Chain Pictures PDF and find out how to give a successful presentation. Present a perfect display to your team and make your presentation unforgettable.
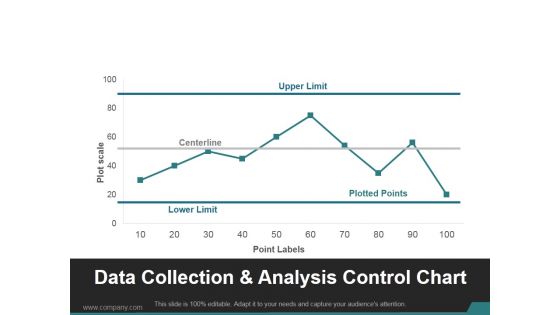
Data Collection And Analysis Control Chart Ppt PowerPoint Presentation Visuals
This is a data collection and analysis control chart ppt powerpoint presentation visuals. This is a ten stage process. The stages in this process are upper limit, centerline, lower limit, plotted points.
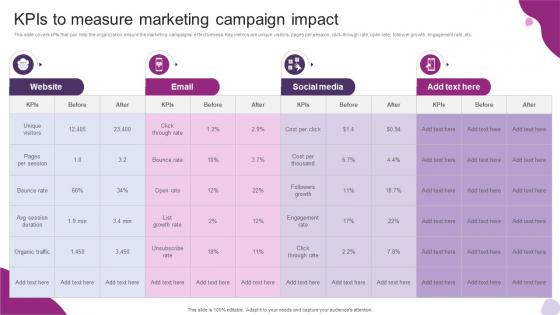
Kpis To Measure Marketing Campaign Impact Powerful Marketing Techniques Strategy SS V
This slide covers kPIs that can help the organization ensure the marketing campaigns effectiveness. Key metrics are unique visitors, pages per session, click-through rate, open rate, follower growth, engagement rate, etc. Do you know about Slidesgeeks Kpis To Measure Marketing Campaign Impact Powerful Marketing Techniques Strategy SS V These are perfect for delivering any kind od presentation. Using it, create PowerPoint presentations that communicate your ideas and engage audiences. Save time and effort by using our pre-designed presentation templates that are perfect for a wide range of topic. Our vast selection of designs covers a range of styles, from creative to business, and are all highly customizable and easy to edit. Download as a PowerPoint template or use them as Google Slides themes. This slide covers kPIs that can help the organization ensure the marketing campaigns effectiveness. Key metrics are unique visitors, pages per session, click-through rate, open rate, follower growth, engagement rate, etc.
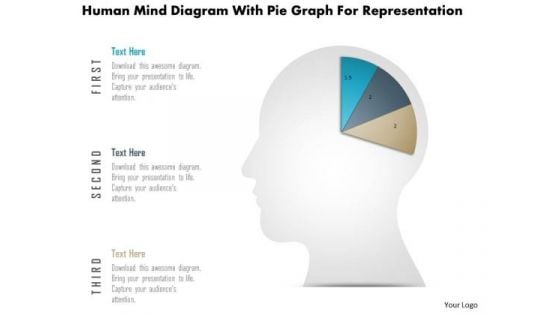
Business Diagram Human Mind Diagram With Pie Graph For Representation PowerPoint Slide
This diagram displays human face graphic divided into sections. This section can be used for data display. Use this diagram to build professional presentations for your viewers.

 Home
Home