Dashboard Icon
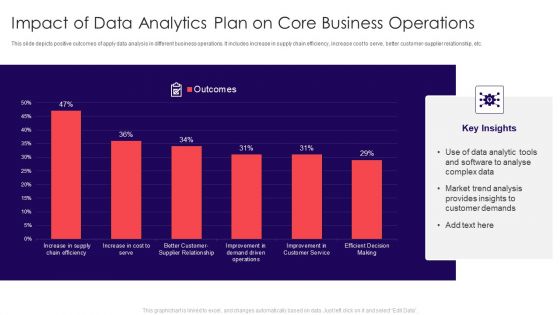
Impact Of Data Analytics Plan On Core Business Operations Summary PDF
This slide depicts positive outcomes of apply data analysis in different business operations. It includes increase in supply chain efficiency, increase cost to serve, better customer-supplier relationship, etc. Showcasing this set of slides titled Impact Of Data Analytics Plan On Core Business Operations Summary PDF. The topics addressed in these templates are Customer Demands, Market Trend Analysis, Complex Data. All the content presented in this PPT design is completely editable. Download it and make adjustments in color, background, font etc. as per your unique business setting.
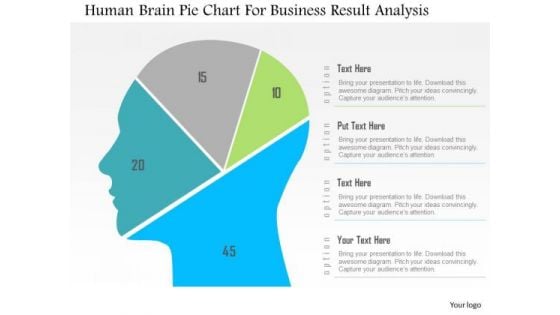
Business Diagram Human Brain Pie Chart For Business Result Analysis PowerPoint Slide
This diagram displays human face graphic divided into sections. This section can be used for data display. Use this diagram to build professional presentations for your viewers.
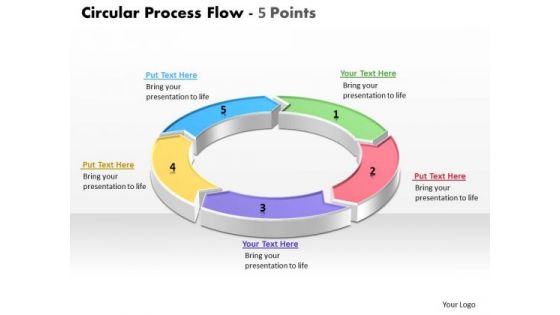
6 Different Views On The Issue Ppt Slides Diagrams Template
We present our 6 Different Views on the issue ppt slides diagrams template.Download our Finance PowerPoint Templates because this diagram helps you to harness the opportunities, celebrate your performance till date and focus on greater growth and expansion in coming years. Use our Business PowerPoint Templates because like the famed William Tell, they put aside all emotions and concentrate on the target. Use our Circle Charts PowerPoint Templates because it is a step by step process with levels rising at every stage. Use our Circle Charts PowerPoint Templates because it builds on your foundation or prepares for change ahead to enhance the future. Download and present our Arrows PowerPoint Templates because this diagram has the unique ability to drive home your ideas and show how they mesh to guarantee success.Use these PowerPoint slides for presentations relating to 3d, Arrow, Background, Black, Blank, Blue, Business, Chart, Circle, Circular, Curving, Eps10, Financial, Flow, Graphic, Gray, Icon, Illustration, Isometric, Perspective, Process, Recycle, Round, Shape, Silver, Six, Spinning, Step, Transparency, Vector. The prominent colors used in the PowerPoint template are Yellow, Green, Blue. Presenters tell us our 6 Different Views on the issue ppt slides diagrams template are Versatile. We assure you our Black PowerPoint templates and PPT Slides will make you look like a winner. The feedback we get is that our 6 Different Views on the issue ppt slides diagrams template are Appealing. The feedback we get is that our Blank PowerPoint templates and PPT Slides are Dazzling. The feedback we get is that our 6 Different Views on the issue ppt slides diagrams template are readymade to fit into any presentation structure. Professionals tell us our Blank PowerPoint templates and PPT Slides are designed to make your presentations professional. Excite the senses with our 6 Different Views On The Issue Ppt Slides Diagrams Template. Tickle the minds with your views.
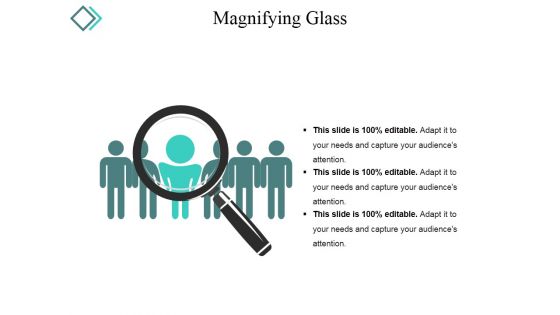
Magnifying Glass Ppt PowerPoint Presentation Pictures Diagrams
This is a magnifying glass ppt powerpoint presentation pictures diagrams. This is a three stage process. The stages in this process are magnifier glass, research, business, marketing.
Magnify Glass Ppt PowerPoint Presentation Gallery Diagrams
This is a magnify glass ppt powerpoint presentation gallery diagrams. This is a one stage process. The stages in this process are search, business, strategy, marketing, management.
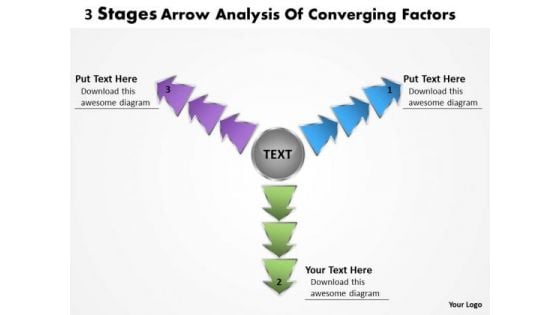
3 Stages Arrow Analysis Of Converging Factors Cycle Diagram PowerPoint Templates
We present our 3 stages arrow analysis of converging factors Cycle Diagram PowerPoint templates.Present our Arrows PowerPoint Templates because you have the product you are very confident of and are very sure it will prove immensely popular with clients all over your target areas. Present our Circle Charts PowerPoint Templates because you have the entire picture in mind. Present our Shapes PowerPoint Templates because the foundation stones of many a life. Download our Business PowerPoint Templates because it illustrates the city with a lasting tryst with resilience. You epitomise the qualities that give your city its fame. Use our Flow Charts PowerPoint Templates because you can Churn the wheels of the brains of your colleagues.Use these PowerPoint slides for presentations relating to arrow, art, back, background, blue, business, button, chrome, circle, clip, color, colorful, communications, computer, connection, design, direction, down, glass, global, glossy, graphic, icon, illustration, image, internet, media, metallic, modern, multimedia, office, page, painting, pc, play, set, shadow, shiny, sign, symbol, traffic,. The prominent colors used in the PowerPoint template are Purple, Blue, Green. Presenters tell us our 3 stages arrow analysis of converging factors Cycle Diagram PowerPoint templates are Stylish. You can be sure our circle PowerPoint templates and PPT Slides will impress their bosses and teams. Professionals tell us our 3 stages arrow analysis of converging factors Cycle Diagram PowerPoint templates are the best it can get when it comes to presenting. People tell us our blue PowerPoint templates and PPT Slides are Precious. People tell us our 3 stages arrow analysis of converging factors Cycle Diagram PowerPoint templates are aesthetically designed to attract attention. We guarantee that they will grab all the eyeballs you need. Professionals tell us our background PowerPoint templates and PPT Slides are Fashionable. Exhibit distinguished performance with our 3 Stages Arrow Analysis Of Converging Factors Cycle Diagram PowerPoint Templates. They will make you look good.
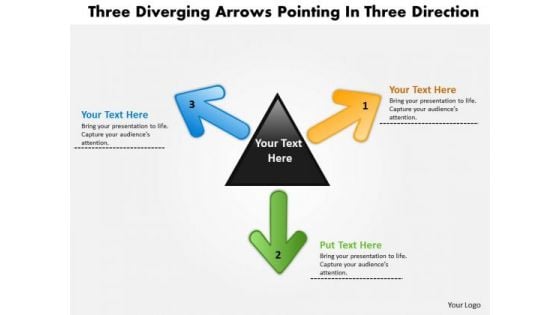
Three Diverging Arrows Pointing Direction Cycle Network PowerPoint Slides
We present our three diverging arrows pointing direction Cycle Network PowerPoint Slides.Download our Arrows PowerPoint Templates because getting it done may not be enough. Present our Triangles PowerPoint Templates because it unravels each one for your audience while setting key timelines as you go along. Present our Shapes PowerPoint Templates because this emphasises on the relevance and importance of all milestones along the way. Present our Business PowerPoint Templates because you have had a great year or so business wise. It is time to celebrate the efforts of your team. Present our Flow Charts PowerPoint Templates because they are Designed to attract the attention of your audience.Use these PowerPoint slides for presentations relating to arrow, arrowheads, badge, banner, blue, button, cerulean, cobalt, colored, colorful, connection, cursor, cyan, design element, designator, directional, download, emblem, gray shadow, green, icon, indicator, interface, internet, link, load, magenta, marker, navigation panel, next, orientation, page site, pictogram, pink, pointer, red, right, satined, sign, signpost, smooth, symbol, . The prominent colors used in the PowerPoint template are Orange, Green, Blue. Presenters tell us our three diverging arrows pointing direction Cycle Network PowerPoint Slides are designed by a team of presentation professionals. You can be sure our banner PowerPoint templates and PPT Slides are Festive. Professionals tell us our three diverging arrows pointing direction Cycle Network PowerPoint Slides are Graceful. People tell us our banner PowerPoint templates and PPT Slides are Gorgeous. People tell us our three diverging arrows pointing direction Cycle Network PowerPoint Slides are Multicolored. Professionals tell us our cerulean PowerPoint templates and PPT Slides are Nifty. Keep up the fight with our Three Diverging Arrows Pointing Direction Cycle Network PowerPoint Slides. Be assured of eventual achievement.
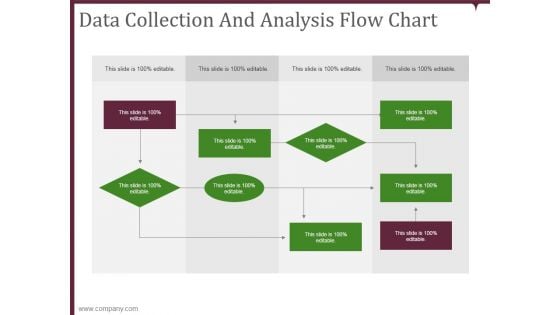
data collection and analysis flow chart ppt powerpoint presentation microsoft
This is a data collection and analysis flow chart ppt powerpoint presentation microsoft. This is a nine stage process. The stages in this process are business, planning, marketing, strategy, management.
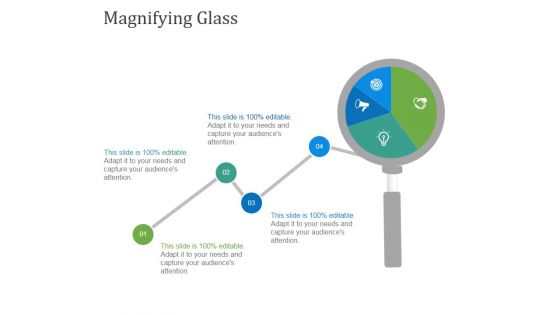
Magnifying Glass Ppt PowerPoint Presentation Diagram Graph Charts
This is a magnifying glass ppt powerpoint presentation diagram graph charts. This is a one stage process. The stages in this process are magnifying glass, planning, marketing, business, management, strategy.
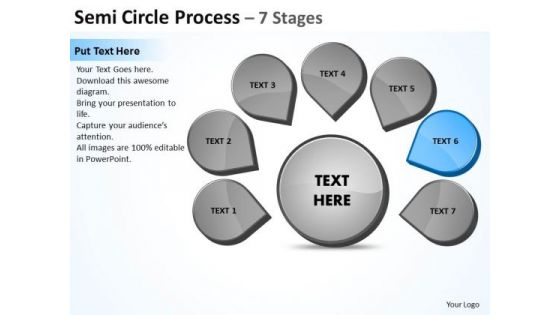
Steps World Business PowerPoint Templates Strategy Circular Flow Chart Slides
We present our steps world business powerpoint templates strategy Circular Flow Chart Slides.Present our Flow Charts PowerPoint Templates because you can Employ the right colours for your brilliant ideas. Present our Business PowerPoint Templates because Building castles in the sand is a danger and you are aware of. You have taken the precaution of building strong fundamentals. Download our Shapes PowerPoint Templates because You should Bet on your luck with our PowerPoint Templates and Slides. Be assured that you will hit the jackpot. Use our Success PowerPoint Templates because the success of your venture depends on the performance of every team member. Present our Process and Flows PowerPoint Templates because it is the time to bond with family, friends, colleagues and any other group of your choice.Use these PowerPoint slides for presentations relating to Business, central, centralized, chart, circle, circular, circulation, concept, design, diagram, executive, icon, idea, illustration, management, crganization, pointing, procedure, process, seven, strategy. The prominent colors used in the PowerPoint template are Blue, Gray, White. The feedback we get is that our steps world business powerpoint templates strategy Circular Flow Chart Slides are Elevated. Customers tell us our centralized PowerPoint templates and PPT Slides are Majestic. Professionals tell us our steps world business powerpoint templates strategy Circular Flow Chart Slides are Zippy. Customers tell us our circular PowerPoint templates and PPT Slides will save the presenter time. Use our steps world business powerpoint templates strategy Circular Flow Chart Slides are Wistful. Professionals tell us our centralized PowerPoint templates and PPT Slides are designed by a team of presentation professionals. Our Steps World Business PowerPoint Templates Strategy Circular Flow Chart Slides ensure an admirable address. The audience won't be able to fault your ideas.

Donut Pie Chart Ppt PowerPoint Presentation File Slideshow
This is a donut pie chart ppt powerpoint presentation file slideshow. This is a four stage process. The stages in this process are business, strategy, analysis, planning, donut pie chart.
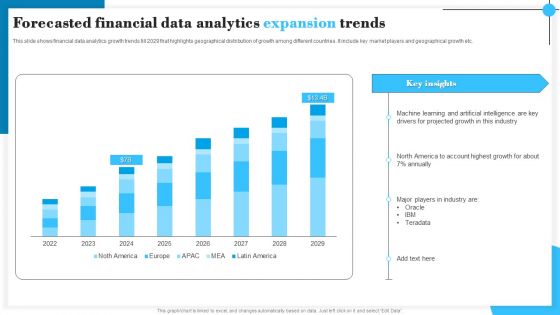
Forecasted Financial Data Analytics Expansion Trends Slides PDF
This slide shows financial data analytics growth trends till 2029 that highlights geographical distribution of growth among different countries. It include key market players and geographical growth etc. Showcasing this set of slides titled Forecasted Financial Data Analytics Expansion Trends Slides PDF. The topics addressed in these templates are Machine Learning, Projected Growth, Industry. All the content presented in this PPT design is completely editable. Download it and make adjustments in color, background, font etc. as per your unique business setting.
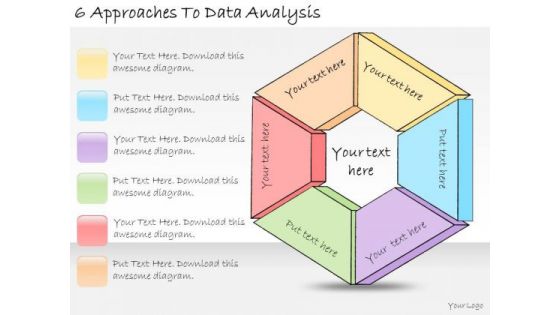
Ppt Slide 6 Approaches To Data Analysis Sales Plan
Get The Doers Into Action. Activate Them With Our PPT Slide 6 Approaches To Data Analysis Sales Plan Powerpoint Templates.
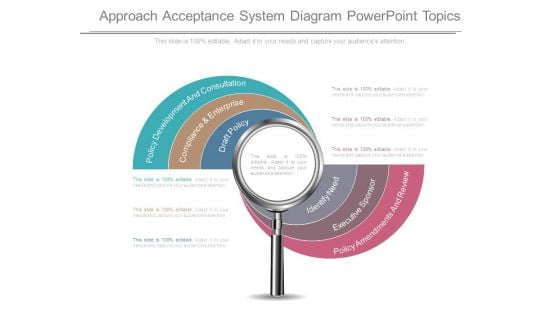
Approach Acceptance System Diagram Powerpoint Topics
This is a approach acceptance system diagram powerpoint topics. This is a six stage process. The stages in this process are policy development and consultation, compliance and enterprise, draft policy, identify need, executive sponsor, policy amendments and review.
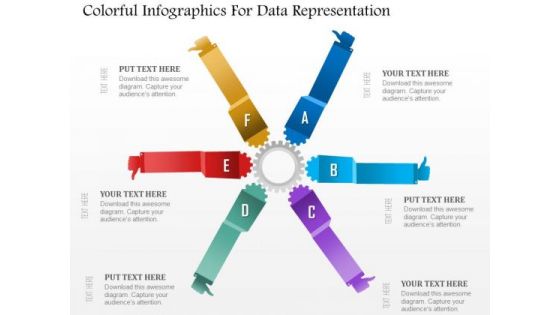
Business Diagram Colorful Infographics For Data Representation Presentation Template
This power point template diagram has been crafted with graphic of colorful info graphics. This PPT diagram contains the concept of analysis and data representations. Use this PPT for marketing and business related presentations.
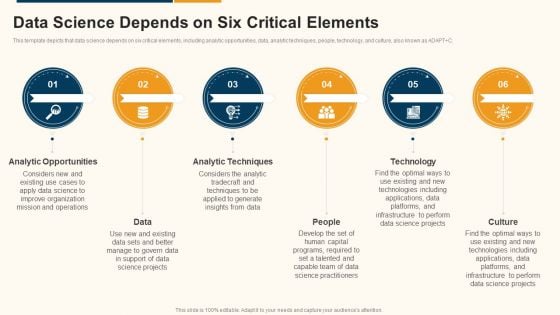
Data Interpretation And Analysis Playbook Data Science Depends On Six Critical Elements Diagrams PDF
This template depicts that data science depends on six critical elements, including analytic opportunities, data, analytic techniques, people, technology, and culture, also known as ADAPT pluse C. Presenting data interpretation and analysis playbook data science depends on six critical elements diagrams pdf to provide visual cues and insights. Share and navigate important information on six stages that need your due attention. This template can be used to pitch topics like analytic opportunities, data, analytic techniques, people, technology, culture. In addtion, this PPT design contains high resolution images, graphics, etc, that are easily editable and available for immediate download.
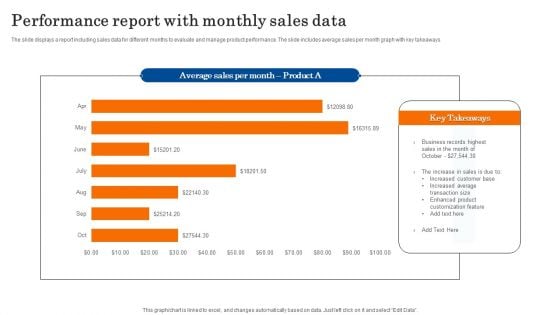
Performance Report With Monthly Sales Data Diagrams PDF
The slide displays a report including sales data for different months to evaluate and manage product performance. The slide includes average sales per month graph with key takeaways. Showcasing this set of slides titled Performance Report With Monthly Sales Data Diagrams PDF. The topics addressed in these templates are Business, Sales, Customization. All the content presented in this PPT design is completely editable. Download it and make adjustments in color, background, font etc. as per your unique business setting.
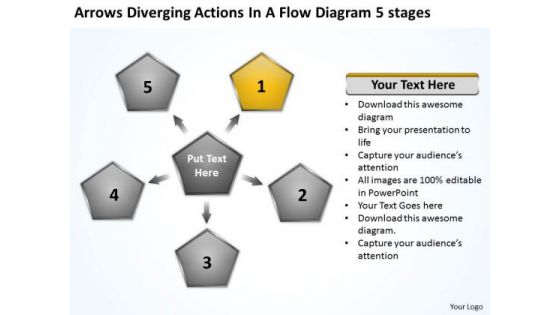
Actions In Flow Diagram 5 Stages Business Circular Layout Network PowerPoint Templates
We present our actions in flow diagram 5 stages business Circular Layout Network PowerPoint templates.Use our Ring Charts PowerPoint Templates because they are Designed to attract the attention of your audience. Download our Business PowerPoint Templates because the fruits of your labour are beginning to show.Enlighten them on the great plans you have for their enjoyment. Present our Future PowerPoint Templates because let this slide illustrates others piggyback on you to see well over the horizon. Present our Process and Flows PowerPoint Templates because with the help of our Slides you can Illustrate your plans to your listeners with the same accuracy. Use our Marketing PowerPoint Templates because The marketplace is the merger of your dreams and your ability. Use these PowerPoint slides for presentations relating to Abstract, action, analysis, blank,business, chart, clipart, commerce,concept, conceptual, design, diagram,direction, flow, generic, goals, guide,guidelines, heirarchy, icon, idea,illustration, lingakes, links, manage,management, mba, model, organization,performance, plan, process, project,representation, resource,steps, strategy, success. The prominent colors used in the PowerPoint template are Black, Yellow, Gray. You can be sure our actions in flow diagram 5 stages business Circular Layout Network PowerPoint templates are effectively colour coded to prioritise your plans They automatically highlight the sequence of events you desire. Professionals tell us our analysis PowerPoint templates and PPT Slides are Versatile. PowerPoint presentation experts tell us our actions in flow diagram 5 stages business Circular Layout Network PowerPoint templates help you meet deadlines which are an element of today's workplace. Just browse and pick the slides that appeal to your intuitive senses. You can be sure our clipart PowerPoint templates and PPT Slides are Magnificent. You can be sure our actions in flow diagram 5 stages business Circular Layout Network PowerPoint templates are Nostalgic. The feedback we get is that our analysis PowerPoint templates and PPT Slides are Magical. Earn a fortune with our Actions In Flow Diagram 5 Stages Business Circular Layout Network PowerPoint Templates. Dont waste time struggling with PowerPoint. Let us do it for you.
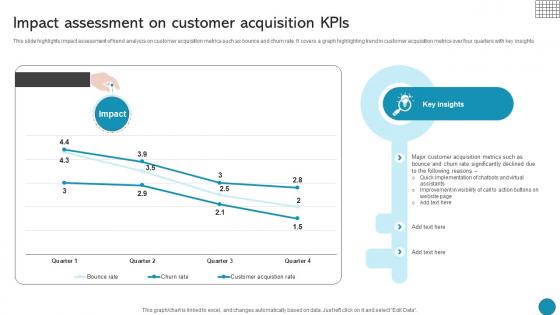
Impact Assessment On Customer Acquisition Kpis Driving Business Success Integrating Product
This slide highlights impact assessment of trend analysis on customer acquisition metrics such as bounce and churn rate. It covers a graph highlighting trend in customer acquisition metrics over four quarters with key insights Are you searching for a Impact Assessment On Customer Acquisition Kpis Driving Business Success Integrating Product that is uncluttered, straightforward, and original Its easy to edit, and you can change the colors to suit your personal or business branding. For a presentation that expresses how much effort you have put in, this template is ideal With all of its features, including tables, diagrams, statistics, and lists, its perfect for a business plan presentation. Make your ideas more appealing with these professional slides. Download Impact Assessment On Customer Acquisition Kpis Driving Business Success Integrating Product from Slidegeeks today. This slide highlights impact assessment of trend analysis on customer acquisition metrics such as bounce and churn rate. It covers a graph highlighting trend in customer acquisition metrics over four quarters with key insights

Key Performance Indicators Sample Diagram Ppt Slides
This is a Key Performance Indicators Sample Diagram Ppt Slides. This is a four stage process. The stages in this process are strategize, measure, innovate, propagate.
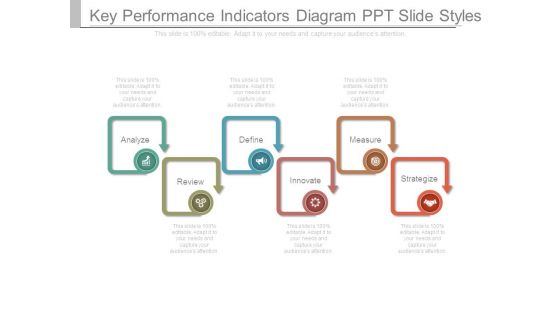
Key Performance Indicators Diagram Ppt Slide Styles
This is a key performance indicators diagram ppt slide styles. This is a six stage process. The stages in this process are analyze, define, measure, review, innovate, strategize.
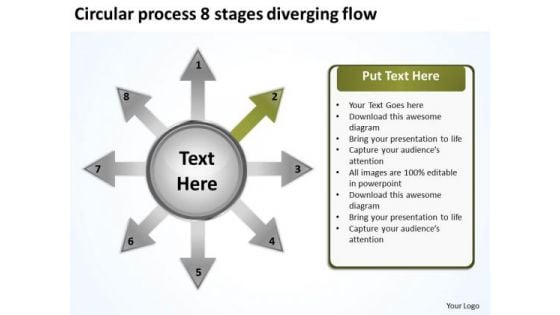
Circular Process 8 Stages Diverging Flow Layout Chart PowerPoint Slides
We present our circular process 8 stages diverging flow Layout Chart PowerPoint Slides.Use our Arrows PowerPoint Templates because getting it done in time is the key to success. Present our Process and flows PowerPoint Templates because you can Place them where they need to be. Present our Flow charts PowerPoint Templates because you can Focus on each one and investigate which one would be the best fit for your needs. Present our Marketing PowerPoint Templates because networking is an imperative in todays world. You need to access the views of others. Similarly you need to give access to them of your abilities. Download our Shapes PowerPoint Templates because the colour coding of our templates are specifically designed to highlight you points.Use these PowerPoint slides for presentations relating to Arrow, green, business, circle, circular, concept, cycle, eco, flow, four, graphic, icon, illustration, part, presentation, process, recycle, recycled, rendered, repeat, repetitive, reuse, round, symbol. The prominent colors used in the PowerPoint template are Brown, Black, White. People tell us our circular process 8 stages diverging flow Layout Chart PowerPoint Slides are Nice. We assure you our concept PowerPoint templates and PPT Slides are Clever. PowerPoint presentation experts tell us our circular process 8 stages diverging flow Layout Chart PowerPoint Slides are Dynamic. You can be sure our circular PowerPoint templates and PPT Slides are Charming. Professionals tell us our circular process 8 stages diverging flow Layout Chart PowerPoint Slides are Liberated. Use our eco PowerPoint templates and PPT Slides are incredible easy to use. Start driving performance improvement with our Circular Process 8 Stages Diverging Flow Layout Chart PowerPoint Slides. They will make you look good.
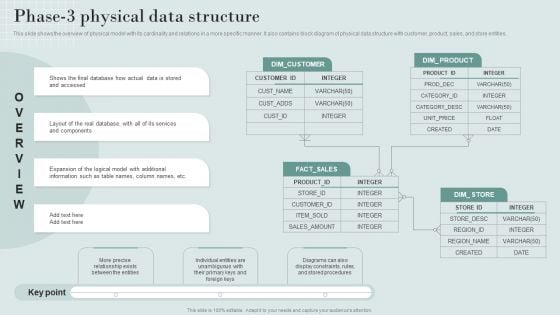
Data Structure IT Phase 3 Physical Data Structure Designs PDF
The Data Structure IT Phase 3 Physical Data Structure Designs PDF is a compilation of the most recent design trends as a series of slides. It is suitable for any subject or industry presentation, containing attractive visuals and photo spots for businesses to clearly express their messages. This template contains a variety of slides for the user to input data, such as structures to contrast two elements, bullet points, and slides for written information. Slidegeeks is prepared to create an impression.
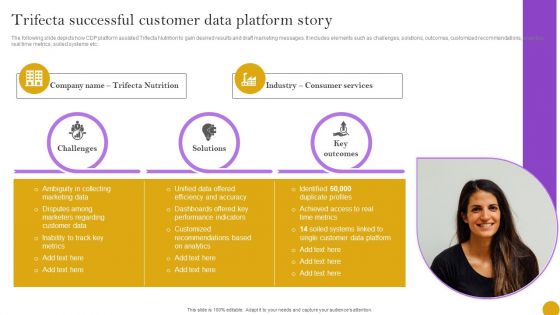
Comprehensive Customer Data Platform Guide Optimizing Promotional Initiatives Trifecta Successful Customer Data Platform Story Designs PDF
The following slide depicts how CDP platform assisted Trifecta Nutrition to gain desired results and draft marketing messages. It includes elements such as challenges, solutions, outcomes, customized recommendations, analytics, real time metrics, soiled systems etc. Whether you have daily or monthly meetings, a brilliant presentation is necessary. Comprehensive Customer Data Platform Guide Optimizing Promotional Initiatives Trifecta Successful Customer Data Platform Story Designs PDF can be your best option for delivering a presentation. Represent everything in detail using Comprehensive Customer Data Platform Guide Optimizing Promotional Initiatives Trifecta Successful Customer Data Platform Story Designs PDF and make yourself stand out in meetings. The template is versatile and follows a structure that will cater to your requirements. All the templates prepared by Slidegeeks are easy to download and edit. Our research experts have taken care of the corporate themes as well. So, give it a try and see the results.
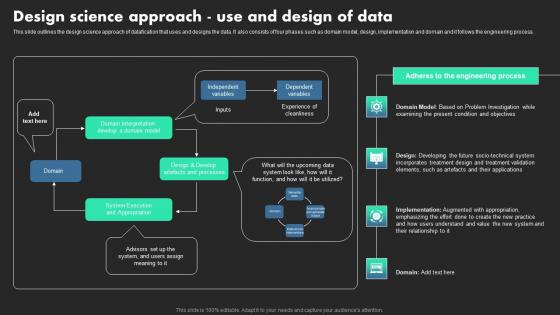
Design Science Approach Use And Design Of Data Ethical Dimensions Of Datafication Brochure Pdf
This slide outlines the design science approach of datafication that uses and designs the data. It also consists of four phases such as domain model, design, implementation and domain and it follows the engineering process. Coming up with a presentation necessitates that the majority of the effort goes into the content and the message you intend to convey. The visuals of a PowerPoint presentation can only be effective if it supplements and supports the story that is being told. Keeping this in mind our experts created Design Science Approach Use And Design Of Data Ethical Dimensions Of Datafication Brochure Pdf to reduce the time that goes into designing the presentation. This way, you can concentrate on the message while our designers take care of providing you with the right template for the situation. This slide outlines the design science approach of datafication that uses and designs the data. It also consists of four phases such as domain model, design, implementation and domain and it follows the engineering process.

Data Structure IT Phase 2 Logical Data Structure Professional PDF
The best PPT templates are a great way to save time, energy, and resources. Slidegeeks have 100 percent editable powerpoint slides making them incredibly versatile. With these quality presentation templates, you can create a captivating and memorable presentation by combining visually appealing slides and effectively communicating your message. Download Data Structure IT Phase 2 Logical Data Structure Professional PDF from Slidegeeks and deliver a wonderful presentation.
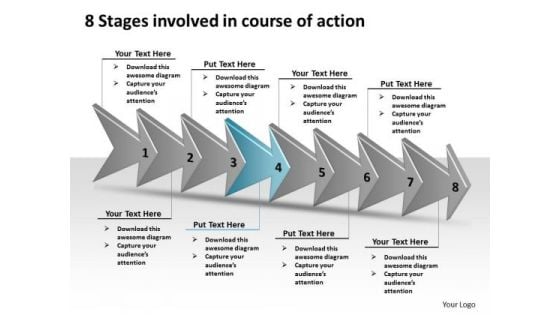
8 Stages Involved Course Of Action Make Flowchart PowerPoint Slides
We present our 8 stages involved course of action make flowchart PowerPoint Slides.Use our Leadership PowerPoint Templates because this diagram can be used to illustrate the logical path or system. Download and present our Shapes PowerPoint Templates because with the help of our Slides you can Illustrate your plans on using the many social media modes available to inform soceity at large of the benefits of your product. Use our Signs PowerPoint Templates because you must Evolve the strategy to take you down the required path with appropriate, efficient and effective marketing along the way. Download our Arrows PowerPoint Templates because we provide the means to project your views. Download and present our Process and Flows PowerPoint Templates because the Venn graphic comprising interlinking circles geometrically demonstate how various functions operating independantly, to a large extent, are essentially interdependant.Use these PowerPoint slides for presentations relating to Designator, blue bottom, circular cobalt banner, clean group badge, clear directional, crimson application icon, down load, download, circle marker, filter grain, front, grunge, grungy, internet page site, left orientation, magenta cursor symbol, monochromatic texture, monochrome pattern, navigation panel, next indicator, noise effect, Arrows sign, push, red pointer pictogram, redo, right, round shape, scattered surface,. The prominent colors used in the PowerPoint template are Blue light, White, Gray. The feedback we get is that our 8 stages involved course of action make flowchart PowerPoint Slides are Pleasant. People tell us our cobalt PowerPoint templates and PPT Slides are Attractive. We assure you our 8 stages involved course of action make flowchart PowerPoint Slides are Upbeat. Presenters tell us our cobalt PowerPoint templates and PPT Slides are One-of-a-kind. We assure you our 8 stages involved course of action make flowchart PowerPoint Slides will make you look like a winner. Use our group PowerPoint templates and PPT Slides are Splendid. Beat mediocrity with our 8 Stages Involved Course Of Action Make Flowchart PowerPoint Slides. You will come out on top.
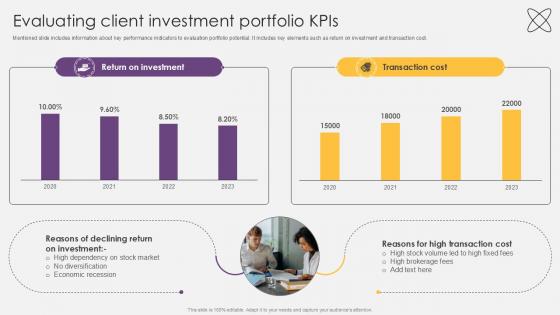
Evaluating Client Investment Portfolio KPIs Investment Fund PPT Presentation
Mentioned slide includes information about key performance indicators to evaluation portfolio potential.It includes key elements such as return on investment and transaction cost. Find highly impressive Evaluating Client Investment Portfolio KPIs Investment Fund PPT Presentation on Slidegeeks to deliver a meaningful presentation. You can save an ample amount of time using these presentation templates. No need to worry to prepare everything from scratch because Slidegeeks experts have already done a huge research and work for you. You need to download Evaluating Client Investment Portfolio KPIs Investment Fund PPT Presentation for your upcoming presentation. All the presentation templates are 100 percent editable and you can change the color and personalize the content accordingly. Download now Mentioned slide includes information about key performance indicators to evaluation portfolio potential.It includes key elements such as return on investment and transaction cost.
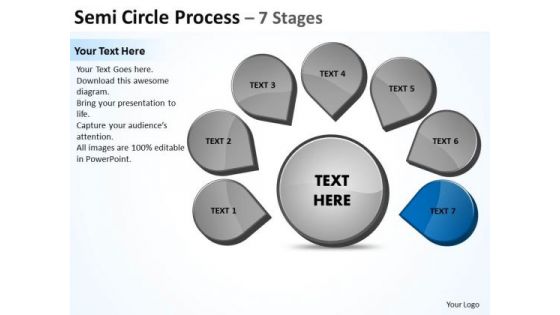
Steps World Business PowerPoint Templates Strategy Ppt Circular Flow Chart Slides
We present our steps world business powerpoint templates strategy ppt Circular Flow Chart Slides.Download and present our Flow Charts PowerPoint Templates because the ideas and plans are on your finger tips. Use our Business PowerPoint Templates because Building castles in the sand is a danger and you are aware of. You have taken the precaution of building strong fundamentals. Download our Shapes PowerPoint Templates because if making a mark is your obsession, then let others get Obsessed with you. Download our Success PowerPoint Templates because the success of your venture depends on the performance of every team member. Present our Process and Flows PowerPoint Templates because you have some great folks working with you, thinking with you.Use these PowerPoint slides for presentations relating to Business, central, centralized, chart, circle, circular, circulation, concept, design, diagram, executive, icon, idea, illustration, management, crganization, pointing, procedure, process, seven, strategy. The prominent colors used in the PowerPoint template are Blue navy, Gray, White. The feedback we get is that our steps world business powerpoint templates strategy ppt Circular Flow Chart Slides are Bright. Customers tell us our circle PowerPoint templates and PPT Slides are Great. Professionals tell us our steps world business powerpoint templates strategy ppt Circular Flow Chart Slides are Enchanting. Customers tell us our chart PowerPoint templates and PPT Slides are Ultra. Use our steps world business powerpoint templates strategy ppt Circular Flow Chart Slides are Tasteful. Professionals tell us our design PowerPoint templates and PPT Slides are Radiant. Our Steps World Business PowerPoint Templates Strategy Ppt Circular Flow Chart Slides are beasts of burden. They have the ability to carry alot.
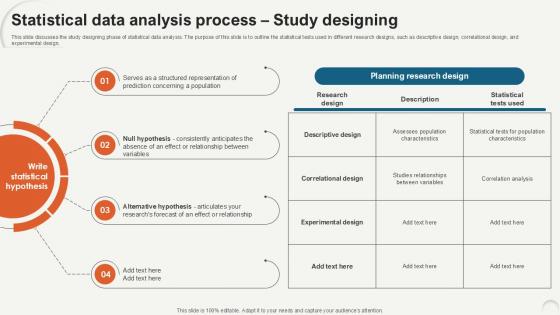
Statistical Data Analysis Process Study Designing Ppt Presentation
This slide discusses the study designing phase of statistical data analysis. The purpose of this slide is to outline the statistical tests used in different research designs, such as descriptive design, correlational design, and experimental design. Do you have to make sure that everyone on your team knows about any specific topic I yes, then you should give Statistical Data Analysis Process Study Designing Ppt Presentation a try. Our experts have put a lot of knowledge and effort into creating this impeccable Statistical Data Analysis Process Study Designing Ppt Presentation. You can use this template for your upcoming presentations, as the slides are perfect to represent even the tiniest detail. You can download these templates from the Slidegeeks website and these are easy to edit. So grab these today This slide discusses the study designing phase of statistical data analysis. The purpose of this slide is to outline the statistical tests used in different research designs, such as descriptive design, correlational design, and experimental design.
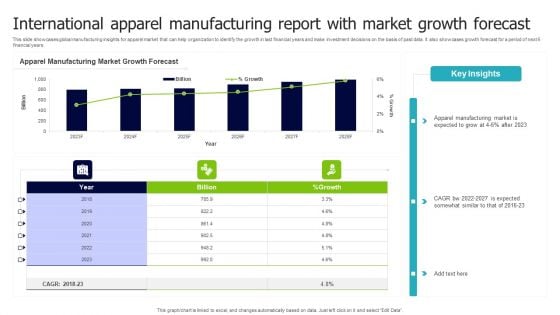
International Apparel Manufacturing Report With Market Growth Forecast Inspiration PDF
This slide showcases global manufacturing insights for apparel market that can help organization to identify the growth in last financial years and make investment decisions on the basis of past data. It also showcases growth forecast for a period of next 6 financial years. Pitch your topic with ease and precision using this International Apparel Manufacturing Report With Market Growth Forecast Inspiration PDF. This layout presents information on Apparel Manufacturing, Market Growth Forecast, Billion. It is also available for immediate download and adjustment. So, changes can be made in the color, design, graphics or any other component to create a unique layout.
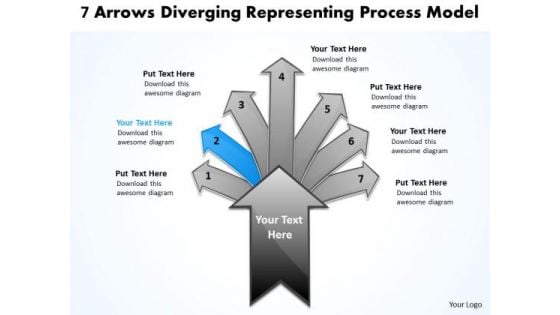
7 Arrows Diverging Representing Process Model Cycle Motion PowerPoint Templates
We present our 7 arrows diverging representing process model Cycle Motion PowerPoint templates.Download our Sale PowerPoint Templates because your foot is on the pedal and your company is purring along smoothly. Download our Arrows PowerPoint Templates because you can Employ the right colours for your brilliant ideas. Present our Process and Flows PowerPoint Templates because the foundation stones of many a life. Present our Business PowerPoint Templates because you are sure you have the right people for your plans. Use our Shapes PowerPoint Templates because they represent the proress in our lives.Use these PowerPoint slides for presentations relating to Abstract, Arrow, Art, Artistic, Background, Banner, Boost, Box, Business, Clip Art, Color, Colorful, Concept, Cover, Creative, Decide, Decision, Design, Direction, Finance, Futuristic, Graphic, Icon, Idea, Illustration, Increase, Info, Information, Journey, Label, Modern, Path, Pattern, Pop, Print, Process, Sale, Solution, Statistic, Sticker, Stylish, Template. The prominent colors used in the PowerPoint template are Blue, Gray, Black. PowerPoint presentation experts tell us our 7 arrows diverging representing process model Cycle Motion PowerPoint templates are Efficient. People tell us our Boost PowerPoint templates and PPT Slides are Attractive. People tell us our 7 arrows diverging representing process model Cycle Motion PowerPoint templates effectively help you save your valuable time. Presenters tell us our Business PowerPoint templates and PPT Slides are Functional. Customers tell us our 7 arrows diverging representing process model Cycle Motion PowerPoint templates are Bright. The feedback we get is that our Boost PowerPoint templates and PPT Slides are Adorable. Fight your battles with our 7 Arrows Diverging Representing Process Model Cycle Motion PowerPoint Templates. You will come out on top.
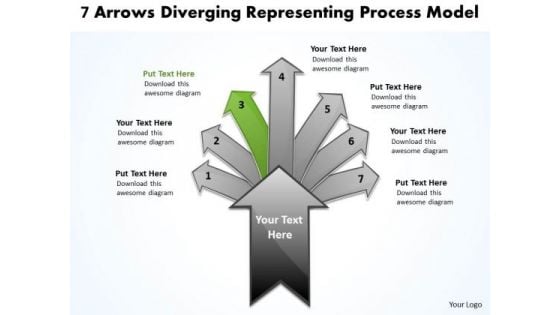
7 Arrows Diverging Representing Process Model Pie Network PowerPoint Templates
We present our 7 arrows diverging representing process model Pie Network PowerPoint templates.Download and present our Sale PowerPoint Templates because you are buzzing with ideas. Download and present our Arrows PowerPoint Templates because there is a very good saying that prevention is better than cure, either way you have a store of knowledge for sure. Use our Process and Flows PowerPoint Templates because you can enlighten your skills with the help of our topical templates. Download our Business PowerPoint Templates because you can gain the success to desired levels in one go. Download our Shapes PowerPoint Templates because you have configured your targets, identified your goals as per priority and importance.Use these PowerPoint slides for presentations relating to Abstract, Arrow, Art, Artistic, Background, Banner, Boost, Box, Business, Clip Art, Color, Colorful, Concept, Cover, Creative, Decide, Decision, Design, Direction, Finance, Futuristic, Graphic, Icon, Idea, Illustration, Increase, Info, Information, Journey, Label, Modern, Path, Pattern, Pop, Print, Process, Sale, Solution, Statistic, Sticker, Stylish, Template. The prominent colors used in the PowerPoint template are Green, Gray, Black. PowerPoint presentation experts tell us our 7 arrows diverging representing process model Pie Network PowerPoint templates are Flirty. People tell us our Business PowerPoint templates and PPT Slides look good visually. People tell us our 7 arrows diverging representing process model Pie Network PowerPoint templates are Swanky. Presenters tell us our Business PowerPoint templates and PPT Slides are Luxurious. Customers tell us our 7 arrows diverging representing process model Pie Network PowerPoint templates are Sparkling. The feedback we get is that our Box PowerPoint templates and PPT Slides are Zippy. Our 7 Arrows Diverging Representing Process Model Pie Network PowerPoint Templates are fashioned to never fade away. They maintain a contemporary look.
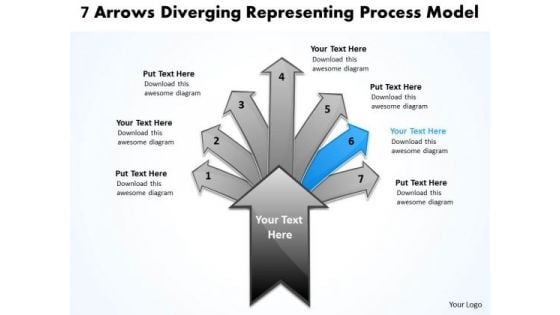
7 Arrows Diverging Representing Process Model Ppt Pie PowerPoint Templates
We present our 7 arrows diverging representing process model ppt Pie PowerPoint templates.Present our Sale PowerPoint Templates because our template will illustrate what you want to say. Download and present our Arrows PowerPoint Templates because you have the ideas to develop the teams vision of where they need to be in the future. Use our Process and Flows PowerPoint Templates because it helps to inject your values into your group and see them bond to achieve success. Download and present our Business PowerPoint Templates because Our PowerPoint Templates and Slides will let you Hit the right notes. Watch your audience start singing to your tune. Present our Shapes PowerPoint Templates because you can Signpost your preferred roadmap to your eager co- travellers and demonstrate clearly how you intend to navigate them towards the desired corporate goal.Use these PowerPoint slides for presentations relating to Abstract, Arrow, Art, Artistic, Background, Banner, Boost, Box, Business, Clip Art, Color, Colorful, Concept, Cover, Creative, Decide, Decision, Design, Direction, Finance, Futuristic, Graphic, Icon, Idea, Illustration, Increase, Info, Information, Journey, Label, Modern, Path, Pattern, Pop, Print, Process, Sale, Solution, Statistic, Sticker, Stylish, Template. The prominent colors used in the PowerPoint template are Blue, Gray, Black. PowerPoint presentation experts tell us our 7 arrows diverging representing process model ppt Pie PowerPoint templates are Upbeat. People tell us our Banner PowerPoint templates and PPT Slides are Fashionable. People tell us our 7 arrows diverging representing process model ppt Pie PowerPoint templates are Fashionable. Presenters tell us our Artistic PowerPoint templates and PPT Slides are Spectacular. Customers tell us our 7 arrows diverging representing process model ppt Pie PowerPoint templates are Energetic. The feedback we get is that our Banner PowerPoint templates and PPT Slides are Cheerful. Counsel them well with our 7 Arrows Diverging Representing Process Model Ppt Pie PowerPoint Templates. Help them absorb your advice.
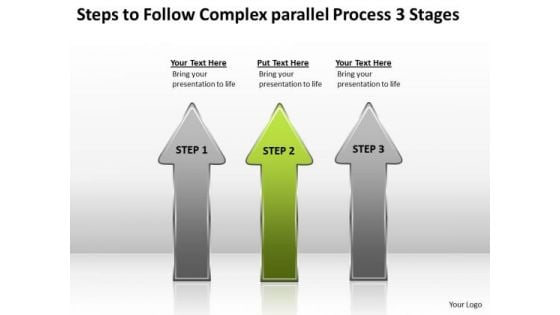
Follow Complex Parallel Process 3 Stages Cleaning Company Business Plan PowerPoint Slides
We present our follow complex parallel process 3 stages cleaning company business plan PowerPoint Slides.Present our Marketing PowerPoint Templates because Our PowerPoint Templates and Slides are specially created by a professional team with vast experience. They diligently strive to come up with the right vehicle for your brilliant Ideas. Download our Business PowerPoint Templates because a brainwave has occurred to you after review. You know just how to push the graph skyward. Download and present our Arrows PowerPoint Templates because they enhance the essence of your viable ideas. Download and present our Symbol PowerPoint Templates because you have the entire picture in mind. Use our Success PowerPoint Templates because your quest has taken you well onto the path of success.Use these PowerPoint slides for presentations relating to 3d, Arrow, Background, Banner, Brochure, Business, Choice, Company, Compare, Content, Corporate, Creative, Description, Design, 10, Goal, Icon, Illustration, Label, Modern, Number, Option, Order, Product, Profit, Progress, Promotion, Red, Rounded, Sequence, Simple, Solution, Special, Standing, Statistic, Step, Success, Symbol, Template. The prominent colors used in the PowerPoint template are Green, Gray, Black. Customers tell us our follow complex parallel process 3 stages cleaning company business plan PowerPoint Slides are Dynamic. Use our Company PowerPoint templates and PPT Slides are Ultra. PowerPoint presentation experts tell us our follow complex parallel process 3 stages cleaning company business plan PowerPoint Slides are Festive. People tell us our Background PowerPoint templates and PPT Slides are Clever. We assure you our follow complex parallel process 3 stages cleaning company business plan PowerPoint Slides provide great value for your money. Be assured of finding the best projection to highlight your words. People tell us our Choice PowerPoint templates and PPT Slides are Endearing. Make your presentations quickly with our Follow Complex Parallel Process 3 Stages Cleaning Company Business Plan PowerPoint Slides. You'll always stay ahead of the game.
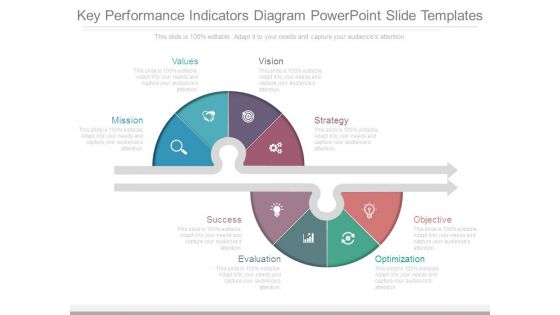
Key Performance Indicators Diagram Powerpoint Slide Templates
This is a key performance indicators diagram powerpoint slide templates. This is a eight stage process. The stages in this process are mission, values, vision, strategy, success, evaluation, optimization, objective.
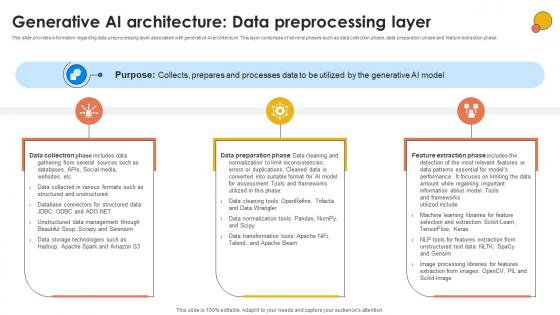
Generative AI Architecture Data Generative AI For Better Productivity AI SS V
This slide provides information regarding data preprocessing layer associated with generative AI architecture. This layer comprises of several phases such as data collection phase, data preparation phase and feature extraction phase. Crafting an eye-catching presentation has never been more straightforward. Let your presentation shine with this tasteful yet straightforward Generative AI Architecture Data Generative AI For Better Productivity AI SS V template. It offers a minimalistic and classy look that is great for making a statement. The colors have been employed intelligently to add a bit of playfulness while still remaining professional. Construct the ideal Generative AI Architecture Data Generative AI For Better Productivity AI SS V that effortlessly grabs the attention of your audience Begin now and be certain to wow your customers This slide provides information regarding data preprocessing layer associated with generative AI architecture. This layer comprises of several phases such as data collection phase, data preparation phase and feature extraction phase.
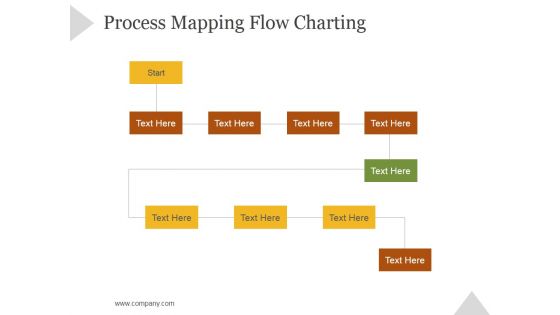
Process Mapping Flow Charting Ppt PowerPoint Presentation Slide Download
This is a process mapping flow charting ppt powerpoint presentation slide download. This is a ten stage process. The stages in this process are business, strategy, marketing, success, growth strategy, flowchart.
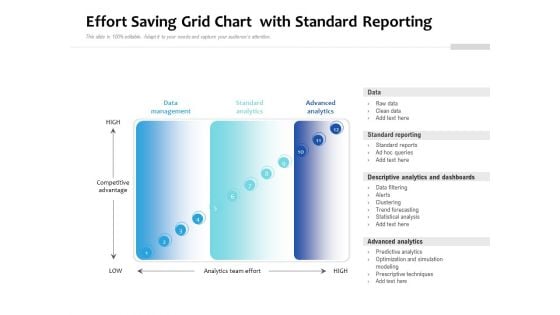
Effort Saving Grid Chart With Standard Reporting Ppt PowerPoint Presentation Layouts Graphics PDF
Presenting effort saving grid chart with standard reporting ppt powerpoint presentation layouts graphics pdf to dispense important information. This template comprises twelve stages. It also presents valuable insights into the topics including data management, standard analytics, advanced analytics. This is a completely customizable PowerPoint theme that can be put to use immediately. So, download it and address the topic impactfully.
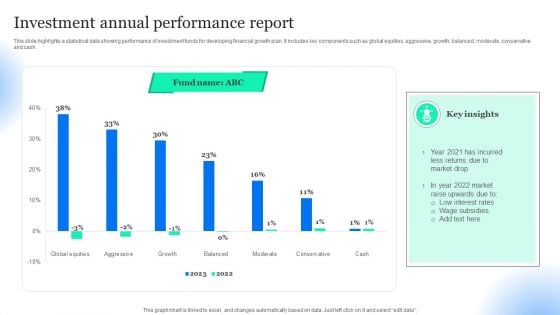
Investment Annual Performance Report Pictures PDF
This slide highlights a statistical data showing performance of investment funds for developing financial growth plan. It includes key components such as global equities, aggressive, growth, balanced, moderate, conservative and cash. Pitch your topic with ease and precision using this Investment Annual Performance Report Pictures PDF. This layout presents information on Low Interest Rates, Wage Subsidies, Returns Due Market Drop. It is also available for immediate download and adjustment. So, changes can be made in the color, design, graphics or any other component to create a unique layout.
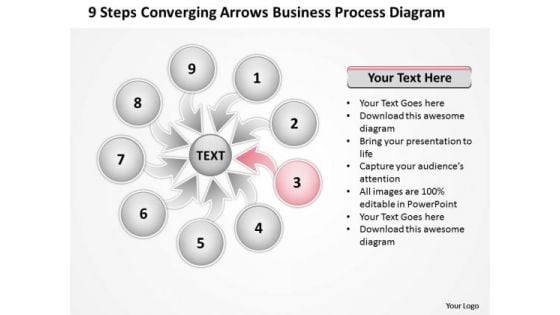
Free Download Process Diagram Relative Circular Flow Arrow PowerPoint Slides
We present our free download process diagram Relative Circular Flow Arrow PowerPoint Slides.Download and present our Leadership PowerPoint Templates because Our PowerPoint Templates and Slides are topically designed to provide an attractive backdrop to any subject. Use our Business PowerPoint Templates because this slide will fire away with all the accuracy at your command. Download and present our Spheres PowerPoint Templates because this diagram depicts the essence of this chain reaction like sequence of events. Use our Arrows PowerPoint Templates because you can Transmit your passion via our creative templates. Download and present our Process and Flows PowerPoint Templates because it helps to churn the mixture to the right degree and pound home your views and expectations in a spectacularly grand and virtuoso fluid performance.Use these PowerPoint slides for presentations relating to Arrows, Business, Central, Centralized, Chart, Circle, Circular, Circulation, Design, Diagram, Executive, Icon, Idea, Illustration, Pointing, Procedure, Process, Resource, Sequence, Sequential, Seven, Square, Strategy, Template. The prominent colors used in the PowerPoint template are Pink, Gray, White. Customers tell us our free download process diagram Relative Circular Flow Arrow PowerPoint Slides are Versatile. Customers tell us our Design PowerPoint templates and PPT Slides are Reminiscent. Presenters tell us our free download process diagram Relative Circular Flow Arrow PowerPoint Slides are Tasteful. PowerPoint presentation experts tell us our Central PowerPoint templates and PPT Slides are Excellent. Customers tell us our free download process diagram Relative Circular Flow Arrow PowerPoint Slides are Elegant. Professionals tell us our Circulation PowerPoint templates and PPT Slides are Fancy. Our Free Download Process Diagram Relative Circular Flow Arrow PowerPoint Slides are fashioned for your thoughts. Your ideas will create a new fad.
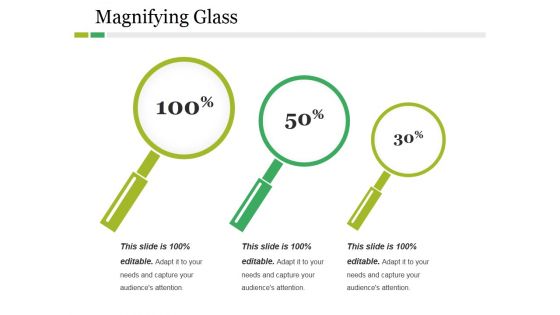
Magnifying Glass Ppt PowerPoint Presentation Diagram Ppt
This is a magnifying glass ppt powerpoint presentation diagram ppt. This is a three stage process. The stages in this process are magnifier glass, research, business, marketing, focus.
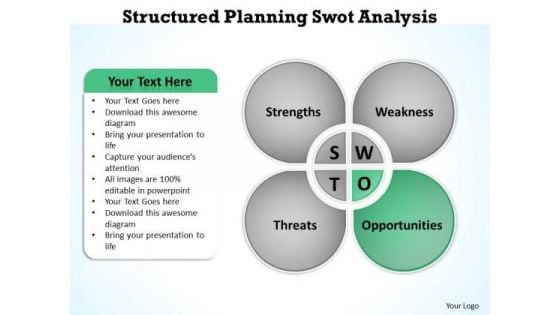
Business Architecture Diagrams Structured Planning Swot Analysis PowerPoint Slides
We present our business architecture diagrams structured planning swot analysis PowerPoint Slides.Use our Advertising PowerPoint Templates because colours generate instant reactions in our brains. Download and present our Business PowerPoint Templates because your product has established a foothold in the market. Customers are happy with the value it brings to their lives. Present our Marketing PowerPoint Templates because The marketplace is the merger of your dreams and your ability. Present our Finance PowerPoint Templates because readymade PowerPoint templates can prove best of your knowledge for your slides to show. Present our Shapes PowerPoint Templates because business ethics is an essential element in your growth.Use these PowerPoint slides for presentations relating to Abstract, Action, Analysis, Business, Chart, Clipart, Commerce, Concept, Conceptual, Design, Diagram, Direction, Dry-Erase, Goals, Guide, Icon, Idea, Illustration, Manage, Management, Mba, Model, Opportunity, Organization, Performance, Plan, Process, Project, Representation, Resource, Sketch, Strategy, Strength, Success, Swot. The prominent colors used in the PowerPoint template are Green, Gray, White. PowerPoint presentation experts tell us our business architecture diagrams structured planning swot analysis PowerPoint Slides are Colorful. Professionals tell us our Conceptual PowerPoint templates and PPT Slides will help you be quick off the draw. Just enter your specific text and see your points hit home. People tell us our business architecture diagrams structured planning swot analysis PowerPoint Slides are Clever. We assure you our Clipart PowerPoint templates and PPT Slides are Dazzling. PowerPoint presentation experts tell us our business architecture diagrams structured planning swot analysis PowerPoint Slides are Pretty. Professionals tell us our Commerce PowerPoint templates and PPT Slides will help you be quick off the draw. Just enter your specific text and see your points hit home. Thoughts won't dry up with our Business Architecture Diagrams Structured Planning Swot Analysis PowerPoint Slides. They keep your brain going at it all the time.
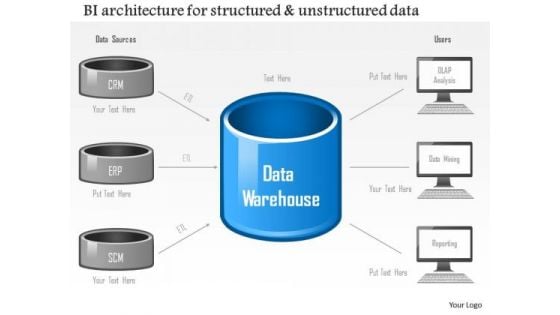
Business Diagram Business Intelligence Architecture For Structured And Unstructured Data Ppt Slide
Graphic of servers and data base has been used to design this technology diagram. It depicts data sources like CRM, ERP, and SCM on side and Users like OLAP analysis, data mining and reporting on other side. Use this diagram to build professional presentation.
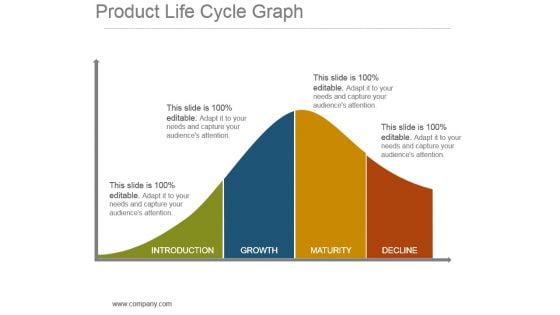
Product Life Cycle Graph Powerpoint Slide Background Image
This is a product life cycle graph powerpoint slide background image. This is a four stage process. The stages in this process are introduction, growth, maturity, decline.
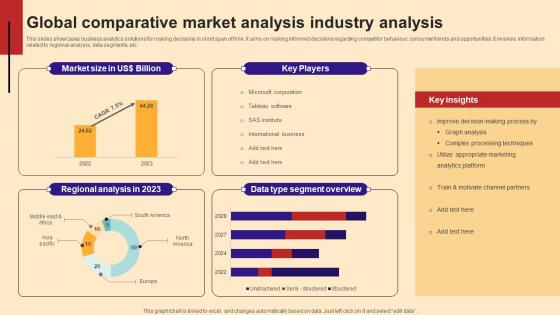
Global Comparative Market Analysis Industry Analysis Introduction Pdf
This slides showcases business analytics solutions for making decisions in short span of time. It aims on making informed decisions regarding competitor behaviour, consumer trends and opportunities. It involves information related to regional analysis, data segments, etc.Showcasing this set of slides titled Global Comparative Market Analysis Industry Analysis Introduction Pdf The topics addressed in these templates are Complex Processing Techniques, Segment Overview, Motivate Channel Partners All the content presented in this PPT design is completely editable. Download it and make adjustments in color, background, font etc. as per your unique business setting. This slides showcases business analytics solutions for making decisions in short span of time. It aims on making informed decisions regarding competitor behaviour, consumer trends and opportunities. It involves information related to regional analysis, data segments, etc.

Manager Evaluating Data Analytics Report On Computer Ppt PowerPoint Presentation File Background PDF
Presenting manager evaluating data analytics report on computer ppt powerpoint presentation file background pdf to dispense important information. This template comprises one stages. It also presents valuable insights into the topics including manager evaluating data analytics report on computer. This is a completely customizable PowerPoint theme that can be put to use immediately. So, download it and address the topic impactfully.
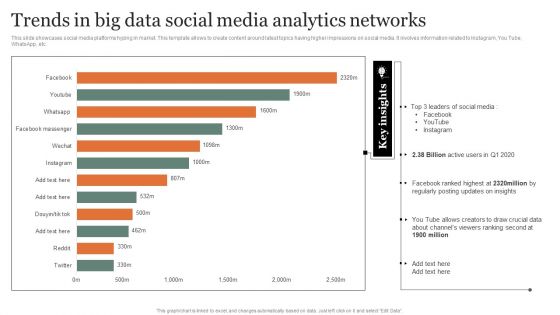
Trends In Big Data Social Media Analytics Networks Guidelines PDF
This slide showcases social media platforms hyping in market. This template allows to create content around latest topics having higher impressions on social media. It involves information related to Instagram, You Tube, WhatsApp, etc. Showcasing this set of slides titled Trends In Big Data Social Media Analytics Networks Guidelines PDF Topics. The topics addressed in these templates are Analytics Networks, Posting Updates, Ranking Second. All the content presented in this PPT design is completely editable. Download it and make adjustments in color, background, font etc. as per your unique business setting.
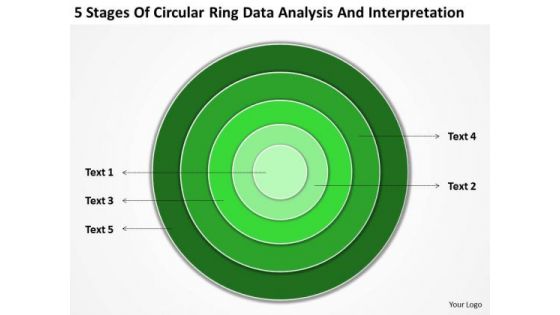
Ring Data Analysis And Interpretation Business Plan Template PowerPoint Templates
We present our ring data analysis and interpretation business plan template PowerPoint templates.Present our Circle Charts PowerPoint Templates because Our PowerPoint Templates and Slides are a sure bet. Gauranteed to win against all odds. Download and present our Business PowerPoint Templates because you should once Tap the ingenuity of our PowerPoint Templates and Slides. They are programmed to succeed. Download our Shapes PowerPoint Templates because Our PowerPoint Templates and Slides are truly out of this world. Even the MIB duo has been keeping tabs on our team. Present our Signs PowerPoint Templates because They will Put your wonderful verbal artistry on display. Our PowerPoint Templates and Slides will provide you the necessary glam and glitter. Download our Metaphors-Visual Concepts PowerPoint Templates because Our PowerPoint Templates and Slides are Clear and concise. Use them and dispel any doubts your team may have.Use these PowerPoint slides for presentations relating to metal, wallpaper, decoration, chrome, vivid, blank, glossy, bright, template, curvy, copyspace, circle, light, decor, element, digital, card, simple, wavy, shape, abstract, wave, modern, creative, circular, round, shiny, backdrop, reflection, design, abstraction, gold, cover, color, colorful, empty, picture, banner, twirl, art, golden, background, border, vortex. The prominent colors used in the PowerPoint template are Green dark , Green, Green lime . Carry your team with our Ring Data Analysis And Interpretation Business Plan Template PowerPoint Templates. You will come out on top.
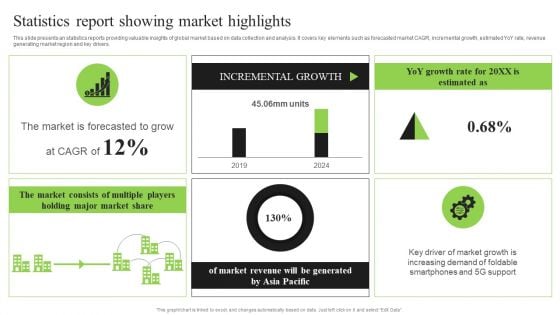
Guidebook For Executing Business Market Intelligence Statistics Report Showing Market Graphics PDF
This slide presents an statistics reports providing valuable insights of global market based on data collection and analysis. It covers key elements such as forecasted market CAGR, incremental growth, estimated YoY rate, revenue generating market region and key drivers. Do you have to make sure that everyone on your team knows about any specific topic I yes, then you should give Guidebook For Executing Business Market Intelligence Statistics Report Showing Market Graphics PDF a try. Our experts have put a lot of knowledge and effort into creating this impeccable Guidebook For Executing Business Market Intelligence Statistics Report Showing Market Graphics PDF. You can use this template for your upcoming presentations, as the slides are perfect to represent even the tiniest detail. You can download these templates from the Slidegeeks website and these are easy to edit. So grab these today.
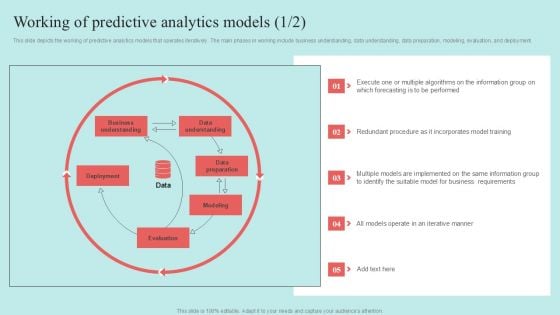
Predictive Data Model Working Of Predictive Analytics Models Pictures PDF
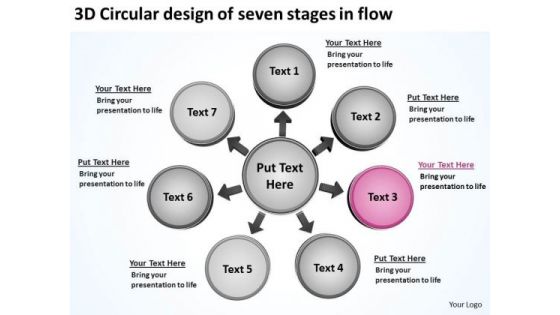
3d Circular Design Of Seven Stages In Flow Business Spoke Process PowerPoint Templates
We present our 3d circular design of seven stages in flow business Spoke Process PowerPoint templates.Download and present our Business PowerPoint Templates because the fruits of your labour are beginning to show.Enlighten them on the great plans you have for their enjoyment. Download our Circle charts PowerPoint Templates because you can Churn the wheels of the brains of your colleagues. Download and present our Arrows PowerPoint Templates because you have an idea of which you are sure. Present our Shapes PowerPoint Templates because we provide the means to project your views. Use our Flow charts PowerPoint Templates because it is in your DNA to analyse possible causes to the minutest detail.Use these PowerPoint slides for presentations relating to Abstract, arrow, arrow, circle, business, concept, career, center, stage, chart, circle circle, connection, contrast, cycle, diagram, direction, flow flowchart, future, graph, icon, illustration, isolate, isolated, job, life, loop, money, motion network, recycle, refresh, ring, rotation, sick, sign, symbol, simply, target, wealth. The prominent colors used in the PowerPoint template are Purple, Gray, White. People tell us our 3d circular design of seven stages in flow business Spoke Process PowerPoint templates are Luxurious. PowerPoint presentation experts tell us our concept PowerPoint templates and PPT Slides are Great. Presenters tell us our 3d circular design of seven stages in flow business Spoke Process PowerPoint templates are Delightful. PowerPoint presentation experts tell us our arrow PowerPoint templates and PPT Slides are Charming. People tell us our 3d circular design of seven stages in flow business Spoke Process PowerPoint templates are Magnificent. People tell us our center PowerPoint templates and PPT Slides are Playful. Motivate your team to excellent performances. Nurture their abilities through our 3d Circular Design Of Seven Stages In Flow Business Spoke Process PowerPoint Templates.
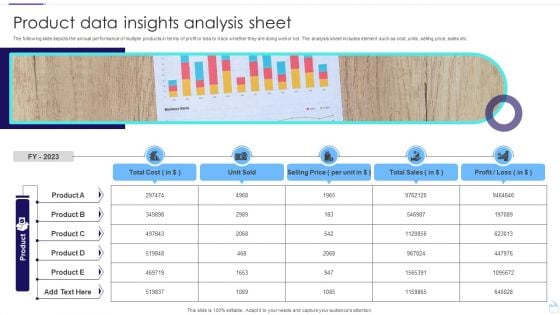
Product Data Insights Analysis Sheet Infographics PDF
The following slide depicts the annual performance of multiple products in terms of profit or loss to track whether they are doing well or not. The analysis sheet includes element such as cost, units, selling price, sales etc. Pitch your topic with ease and precision using this Product Data Insights Analysis Sheet Infographics PDF. This layout presents information on Unit Sold, Selling Price, Total Sales. It is also available for immediate download and adjustment. So, changes can be made in the color, design, graphics or any other component to create a unique layout.
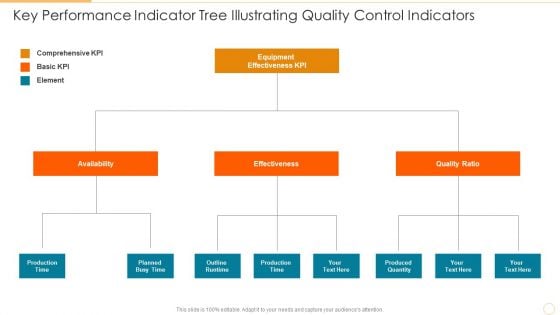
Key Performance Indicator Tree Illustrating Quality Control Indicators Information PDF
Presenting key performance indicator tree illustrating quality control indicators information pdf to dispense important information. This template comprises three stages. It also presents valuable insights into the topics including availability, effectiveness, quality ratio. This is a completely customizable PowerPoint theme that can be put to use immediately. So, download it and address the topic impactfully.
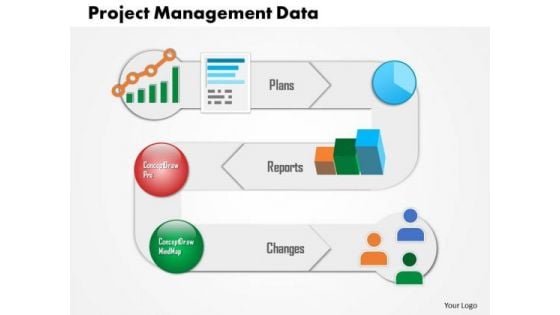
Business Framework Project Management Data PowerPoint Presentation
This diagram displays push pull communication framework. This diagram may used to displays push pull strategy. Use this diagram in business presentations. This diagram will enhance the quality of your presentations.

Increasing Business Awareness Evaluating Kpis To Determine Gap In Business Strategy SS V
This slide analyzes the performance of key metrics of insurance business. It includes information about metrics such as new policies per agent, customer acquisition cost, policy sales growth, average premium per customer. Whether you have daily or monthly meetings, a brilliant presentation is necessary. Increasing Business Awareness Evaluating Kpis To Determine Gap In Business Strategy SS V can be your best option for delivering a presentation. Represent everything in detail using Increasing Business Awareness Evaluating Kpis To Determine Gap In Business Strategy SS V and make yourself stand out in meetings. The template is versatile and follows a structure that will cater to your requirements. All the templates prepared by Slidegeeks are easy to download and edit. Our research experts have taken care of the corporate themes as well. So, give it a try and see the results. This slide analyzes the performance of key metrics of insurance business. It includes information about metrics such as new policies per agent, customer acquisition cost, policy sales growth, average premium per customer.
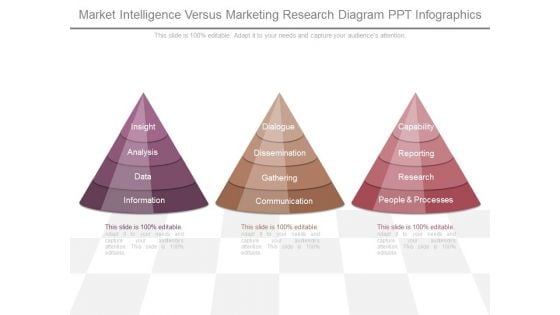
Market Intelligence Versus Marketing Research Diagram Ppt Infographics
This is a market intelligence versus marketing research diagram ppt infographics. This is a three stage process. The stages in this process are insight, analysis, data, information, dialogue, dissemination, gathering, communication, capability, reporting, research, people and processes.
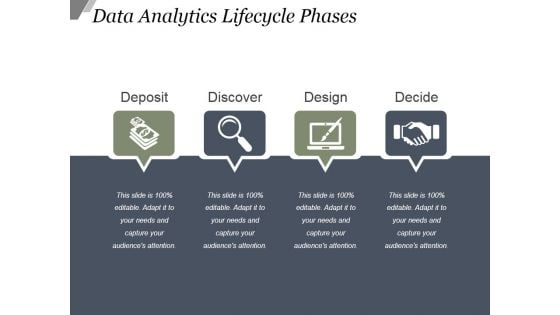
Data Analytics Lifecycle Phases Ppt PowerPoint Presentation Example File
This is a data analytics lifecycle phases ppt powerpoint presentation example file. This is a four stage process. The stages in this process are deposit, discover, design, decide.
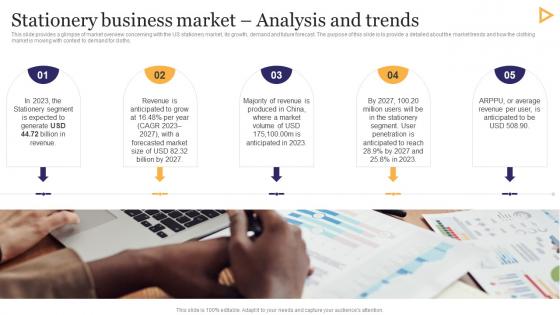
Stationery Business Market Analysis Trends Stationery Business Plan Go To Market Strategy Themes Pdf
This slide provides a glimpse of market overview concerning with the US stationery market, its growth, demand and future forecast. The purpose of this slide is to provide a detailed about the market trends and how the clothing market is moving with context to demand for cloths. Here you can discover an assortment of the finest PowerPoint and Google Slides templates. With these templates, you can create presentations for a variety of purposes while simultaneously providing your audience with an eye catching visual experience. Download Stationery Business Market Analysis Trends Stationery Business Plan Go To Market Strategy Themes Pdf to deliver an impeccable presentation. These templates will make your job of preparing presentations much quicker, yet still, maintain a high level of quality. Slidegeeks has experienced researchers who prepare these templates and write high quality content for you. Later on, you can personalize the content by editing the Stationery Business Market Analysis Trends Stationery Business Plan Go To Market Strategy Themes Pdf. This slide provides a glimpse of market overview concerning with the US stationery market, its growth, demand and future forecast. The purpose of this slide is to provide a detailed about the market trends and how the clothing market is moving with context to demand for cloths.
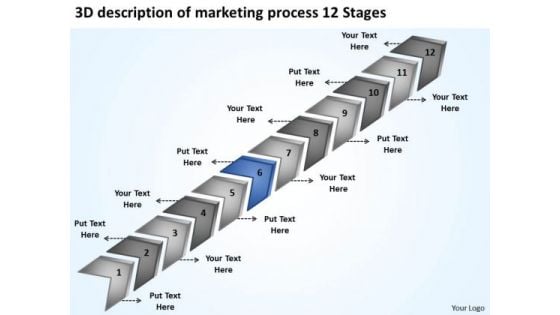
3d Description Of Marketing Process 12 Stages Sample Business Plan Format PowerPoint Slides
We present our 3d description of marketing process 12 stages sample business plan format PowerPoint Slides.Download our Process and flows PowerPoint Templates because this one depicts the popular chart. Download and present our Arrows PowerPoint Templates because stable ideas are the building blocks of a sucessful structure. Present our Flow charts PowerPoint Templates because this diagram helps you to harness the opportunities, celebrate your performance till date and focus on greater growth and expansion in coming years. Download and present our Business PowerPoint Templates because it helps you to project your enthusiasm and single mindedness to your colleagues. Use our Marketing PowerPoint Templates because customer satisfaction is a mantra of the marketplace. Building a loyal client base is an essential element of your business.Use these PowerPoint slides for presentations relating to arrow, background, bullet, business, chart, checkmark, chevron, diagram, drop financial, five, glass, graphic, gray, icon, illustration, management, point, process project, reflection, set, shadow, stage, text, transparency. The prominent colors used in the PowerPoint template are Blue, Gray, White. You can be sure our 3d description of marketing process 12 stages sample business plan format PowerPoint Slides are Detailed. You can be sure our checkmark PowerPoint templates and PPT Slides are Luxuriant. People tell us our 3d description of marketing process 12 stages sample business plan format PowerPoint Slides are Enchanting. We assure you our drop PowerPoint templates and PPT Slides are Precious. The feedback we get is that our 3d description of marketing process 12 stages sample business plan format PowerPoint Slides are Magical. We assure you our bullet PowerPoint templates and PPT Slides are Spectacular. Our 3d Description Of Marketing Process 12 Stages Sample Business Plan Format PowerPoint Slides designers have great aesthetic sense. They treat each slide as a work of art.

 Home
Home