Dashboard Icon
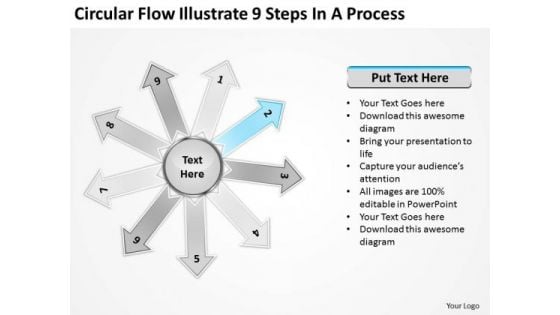
Circular Flow Illustrate 9 Steps In Process Layout Diagram PowerPoint Slides
We present our circular flow illustrate 9 steps in process Layout Diagram PowerPoint Slides.Download our Process and flows PowerPoint Templates because they are Gauranteed to focus the minds of your team. Download our Business PowerPoint Templates because your ideas too are pinpointedly focused on you goals. Download our Marketing PowerPoint Templates because networking is an imperative in todays world. You need to access the views of others. Similarly you need to give access to them of your abilities. Download our Flow charts PowerPoint Templates because it is in your DNA to analyse possible causes to the minutest detail. Present our Arrows PowerPoint Templates because you have the ideas and plans on how to achieve success.Use these PowerPoint slides for presentations relating to Circle, circular, circulation, clipart, colorful, connection, continuity, cut, cycle, cyclic, diagram, direction, flow, graph, icon, illustration, isolated, presentation, process, progress, reason, recycle, recycling, repetition, report, result, ring, rotation, round, scheme, section, step, sticker, symbol, arrows , flow charts. The prominent colors used in the PowerPoint template are Blue light, Black, White. People tell us our circular flow illustrate 9 steps in process Layout Diagram PowerPoint Slides are Upbeat. We assure you our clipart PowerPoint templates and PPT Slides are Tranquil. PowerPoint presentation experts tell us our circular flow illustrate 9 steps in process Layout Diagram PowerPoint Slides are Whimsical. You can be sure our cut PowerPoint templates and PPT Slides are Lush. Professionals tell us our circular flow illustrate 9 steps in process Layout Diagram PowerPoint Slides provide you with a vast range of viable options. Select the appropriate ones and just fill in your text. Use our continuity PowerPoint templates and PPT Slides are Quaint. Claim your prize with our Circular Flow Illustrate 9 Steps In Process Layout Diagram PowerPoint Slides. You will come out on top.
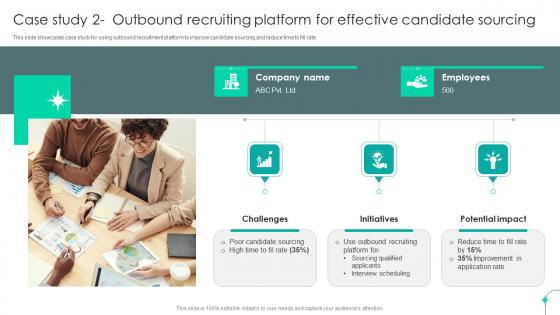
Strategic Staffing Using Data Case Study 2 Outbound Recruiting Platform For Effective CRP DK SS V
This slide showcases case study for using outbound recruitment platform to improve candidate sourcing and reduce time to fill rate. Whether you have daily or monthly meetings, a brilliant presentation is necessary. Strategic Staffing Using Data Case Study 2 Outbound Recruiting Platform For Effective CRP DK SS V can be your best option for delivering a presentation. Represent everything in detail using Strategic Staffing Using Data Case Study 2 Outbound Recruiting Platform For Effective CRP DK SS V and make yourself stand out in meetings. The template is versatile and follows a structure that will cater to your requirements. All the templates prepared by Slidegeeks are easy to download and edit. Our research experts have taken care of the corporate themes as well. So, give it a try and see the results. This slide showcases case study for using outbound recruitment platform to improve candidate sourcing and reduce time to fill rate.
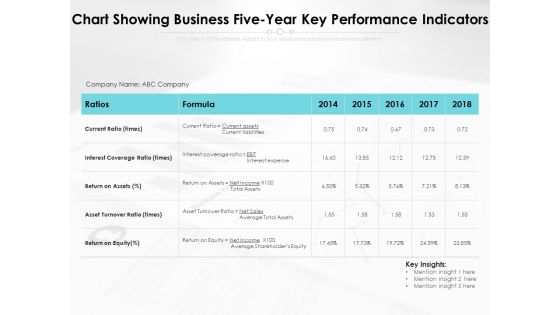
Chart Showing Business Five Year Key Performance Indicators Ppt PowerPoint Presentation File Infographics PDF
Presenting this set of slides with name chart showing business five year key performance indicators ppt powerpoint presentation file infographics pdf. The topics discussed in these slides are liabilities, equity, assets. This is a completely editable PowerPoint presentation and is available for immediate download. Download now and impress your audience.
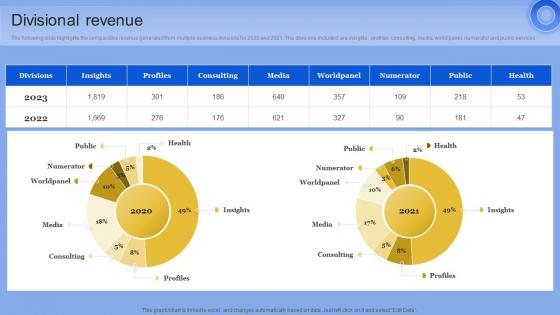
Divisional Revenue Data Analytics Company Outline Pictures PDF
The following slide highlights the comparative revenue generated from multiple business divisions for 2020 and 2021. The divisions included are insights, profiles, consulting, media, world panel, numerator and public services From laying roadmaps to briefing everything in detail, our templates are perfect for you. You can set the stage with your presentation slides. All you have to do is download these easy-to-edit and customizable templates. Divisional Revenue Data Analytics Company Outline Pictures PDF will help you deliver an outstanding performance that everyone would remember and praise you for. Do download this presentation today. The following slide highlights the comparative revenue generated from multiple business divisions for 2020 and 2021. The divisions included are insights, profiles, consulting, media, world panel, numerator and public services
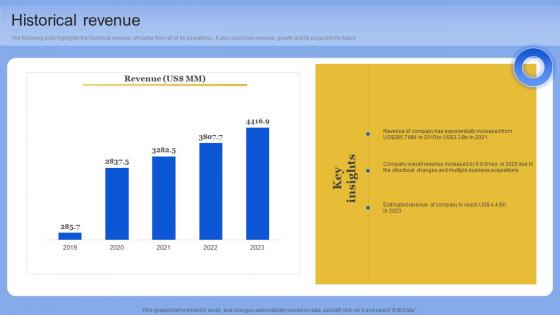
Historical Revenue Data Analytics Company Outline Information PDF
The following slide highlights the historical revenue of Kantar from all of its operations. It also describes revenue growth and its projection for future. This modern and well-arranged Historical Revenue Data Analytics Company Outline Information PDF provides lots of creative possibilities. It is very simple to customize and edit with the Powerpoint Software. Just drag and drop your pictures into the shapes. All facets of this template can be edited with Powerpoint, no extra software is necessary. Add your own material, put your images in the places assigned for them, adjust the colors, and then you can show your slides to the world, with an animated slide included. The following slide highlights the historical revenue of Kantar from all of its operations. It also describes revenue growth and its projection for future
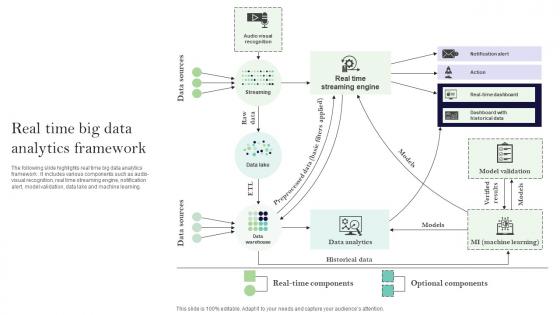
Real Time Big Data Analytics Framework Ppt Ideas Designs Download Pdf
The following slide highlights real time big data analytics framework. It includes various components such as audio-visual recognition, real time streaming engine, notification alert, model validation, data lake and machine learning. Pitch your topic with ease and precision using this Real Time Big Data Analytics Framework Ppt Ideas Designs Download Pdf. This layout presents information on Notification Alert, Model Validation, Data Lake. It is also available for immediate download and adjustment. So, changes can be made in the color, design, graphics or any other component to create a unique layout. The following slide highlights real time big data analytics framework. It includes various components such as audio-visual recognition, real time streaming engine, notification alert, model validation, data lake and machine learning.
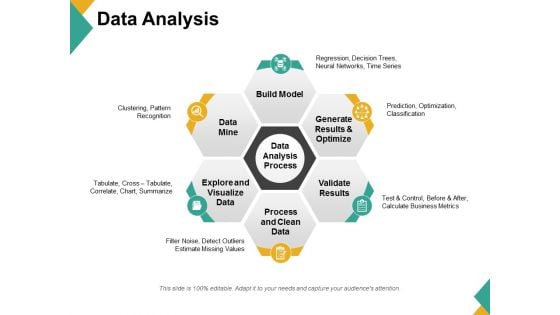
Data Analysis Ppt PowerPoint Presentation Visual Aids Diagrams
This is a data analysis ppt powerpoint presentation visual aids diagrams. This is a six stage process. The stages in this process are build model, generate results and optimize, validate results, process and clean data, explore and visualize data, data mine.
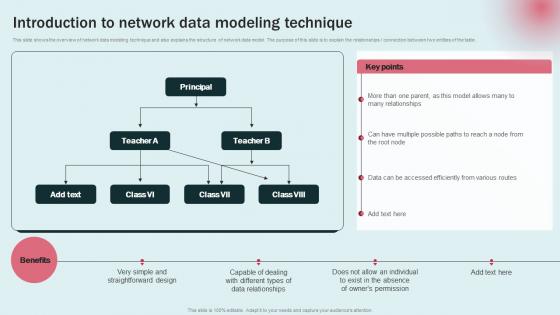
Data Modeling Approaches For Modern Analytics Introduction To Network Data Modeling Graphics Pdf
This slide shows the overview of network data modeling technique and also explains the structure of network data model. The purpose of this slide is to explain the relationships connection between two entities of the table. Slidegeeks is here to make your presentations a breeze with Data Modeling Approaches For Modern Analytics Introduction To Network Data Modeling Graphics Pdf With our easy to use and customizable templates, you can focus on delivering your ideas rather than worrying about formatting. With a variety of designs to choose from, you are sure to find one that suits your needs. And with animations and unique photos, illustrations, and fonts, you can make your presentation pop. So whether you are giving a sales pitch or presenting to the board, make sure to check out Slidegeeks first This slide shows the overview of network data modeling technique and also explains the structure of network data model. The purpose of this slide is to explain the relationships connection between two entities of the table.
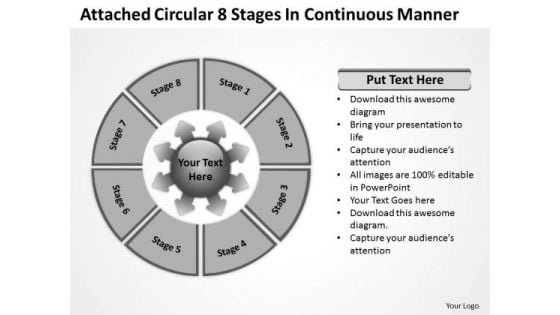
Circular 8 Stages In Continuous Manner Relative Cycle Arrow Chart PowerPoint Templates
We present our circular 8 stages in continuous manner Relative Cycle Arrow Chart PowerPoint templates.Download and present our Process and flows PowerPoint Templates because it helps to anticipate the doubts and questions in the minds of your colleagues and enlighten them with your inspired strategy to garner desired success. Download and present our Business PowerPoint Templates because the fruits of your labour are beginning to show.Enlighten them on the great plans you have for their enjoyment. Download and present our Marketing PowerPoint Templates because you can Highlight the key components of your entire manufacturing/ business process. Download our Flow charts PowerPoint Templates because they are Gauranteed to focus the minds of your team. Use our Arrows PowerPoint Templates because you understand the ailment and how to fight it.Use these PowerPoint slides for presentations relating to Circle, circular, circulation, clipart, colorful, connection, continuity, cut, cycle, cyclic, diagram, direction, empty, flow, graph, green, icon, illustration, isolated, loop, motion, pink, presentation, process, progress, reason, recycle, recycling, repetition, report, result, ring, rotation, round, scheme, section, step, sticker, symbol, arrows , flow charts. The prominent colors used in the PowerPoint template are Yellow, Black, White. People tell us our circular 8 stages in continuous manner Relative Cycle Arrow Chart PowerPoint templates are Spectacular. We assure you our continuity PowerPoint templates and PPT Slides are Tasteful. PowerPoint presentation experts tell us our circular 8 stages in continuous manner Relative Cycle Arrow Chart PowerPoint templates are Vintage. You can be sure our continuity PowerPoint templates and PPT Slides are aesthetically designed to attract attention. We guarantee that they will grab all the eyeballs you need. Professionals tell us our circular 8 stages in continuous manner Relative Cycle Arrow Chart PowerPoint templates are second to none. Use our cut PowerPoint templates and PPT Slides are Awesome. Our Circular 8 Stages In Continuous Manner Relative Cycle Arrow Chart PowerPoint Templates are fairly broadbased. They give you ample scope to address your mind.
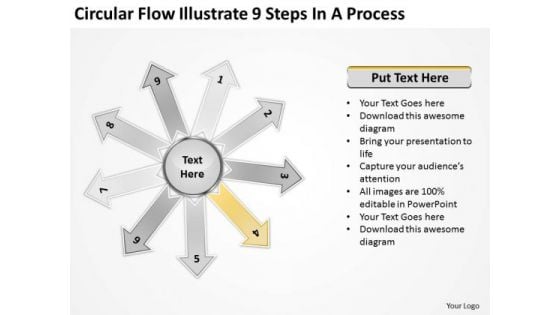
Circular Flow Illustrate 9 Steps In Process Cycle Chart PowerPoint Templates
We present our circular flow illustrate 9 steps in process Cycle Chart PowerPoint templates.Download our Process and flows PowerPoint Templates because it depicts Rolling along while gathering profits along the way is the aim. Download our Business PowerPoint Templates because this layout helps you to bring some important aspects of your business process to the notice of all concerned. Streamline the flow of information across the board. Download and present our Marketing PowerPoint Templates because you have the product you are very confident of and are very sure it will prove immensely popular with clients all over your target areas. Present our Flow charts PowerPoint Templates because they are Designed to attract the attention of your audience. Download and present our Arrows PowerPoint Templates because you have the entire picture in mind.Use these PowerPoint slides for presentations relating to Circle, circular, circulation, clipart, colorful, connection, continuity, cycle, cyclic, diagram, direction, flow, graph, icon, illustration, isolated, loop, motion, pink, presentation, process, progress, reason, recycle, recycling, repetition, report, result, ring, rotation, round, scheme, section, step,symbol, arrows , flow charts. The prominent colors used in the PowerPoint template are Yellow, Black, White. People tell us our circular flow illustrate 9 steps in process Cycle Chart PowerPoint templates are Cheerful. We assure you our colorful PowerPoint templates and PPT Slides are Festive. PowerPoint presentation experts tell us our circular flow illustrate 9 steps in process Cycle Chart PowerPoint templates are Colorful. You can be sure our colorful PowerPoint templates and PPT Slides are Zippy. Professionals tell us our circular flow illustrate 9 steps in process Cycle Chart PowerPoint templates are Bright. Use our cyclic PowerPoint templates and PPT Slides are Excellent. Emit energy with our Circular Flow Illustrate 9 Steps In Process Cycle Chart PowerPoint Templates. Bowl them over with your enthusiasm.
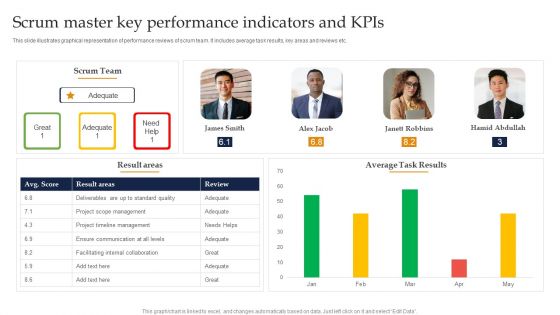
Scrum Master Key Performance Indicators And Kpis Ppt Gallery Files PDF
This slide illustrates graphical representation of performance reviews of scrum team. It includes average task results, key areas and reviews etc. Showcasing this set of slides titled Scrum Master Key Performance Indicators And Kpis Ppt Gallery Files PDF. The topics addressed in these templates are Scrum Team, Average Task Results, Project Timeline Management. All the content presented in this PPT design is completely editable. Download it and make adjustments in color, background, font etc. as per your unique business setting.
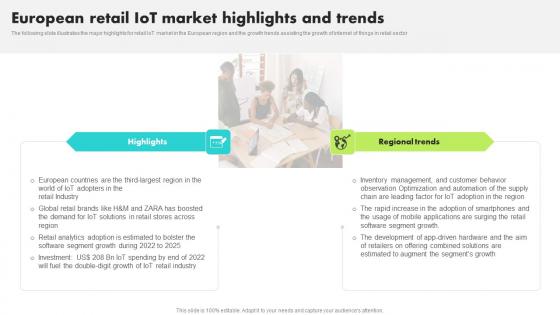
European Retail IoT Market Highlights Trends Guide For Retail IoT Solutions Analysis Diagrams Pdf
The following slide illustrates the major highlights for retail IoT market in the European region and the growth trends assisting the growth of internet of things in retail sector Create an editable European Retail IoT Market Highlights Trends Guide For Retail IoT Solutions Analysis Diagrams Pdf that communicates your idea and engages your audience. Whether you are presenting a business or an educational presentation, pre designed presentation templates help save time. European Retail IoT Market Highlights Trends Guide For Retail IoT Solutions Analysis Diagrams Pdf is highly customizable and very easy to edit, covering many different styles from creative to business presentations. Slidegeeks has creative team members who have crafted amazing templates. So, go and get them without any delay. The following slide illustrates the major highlights for retail IoT market in the European region and the growth trends assisting the growth of internet of things in retail sector
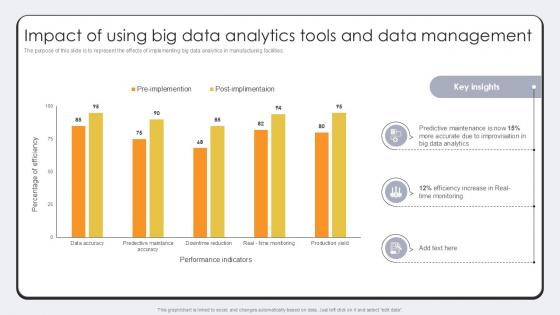
Impact Of Using Big Data Analytics Revolutionizing Production IoT Ppt Sample
The purpose of this slide is to represent the effects of implementing big data analytics in manufacturing facilities. The Impact Of Using Big Data Analytics Revolutionizing Production IoT Ppt Sample is a compilation of the most recent design trends as a series of slides. It is suitable for any subject or industry presentation, containing attractive visuals and photo spots for businesses to clearly express their messages. This template contains a variety of slides for the user to input data, such as structures to contrast two elements, bullet points, and slides for written information. Slidegeeks is prepared to create an impression. The purpose of this slide is to represent the effects of implementing big data analytics in manufacturing facilities.

Emerging Online User Acquisition Trends In Marketing Online Customer Acquisition Diagrams Pdf
Following slide provide glimpse of emerging trends that helps companies to increase online client acquisition and drive sales. It includes pointers such as rise in voice search, increase use of artificial intelligence, digital transformation etc. Get a simple yet stunning designed Emerging Online User Acquisition Trends In Marketing Online Customer Acquisition Diagrams Pdf It is the best one to establish the tone in your meetings. It is an excellent way to make your presentations highly effective. So, download this PPT today from Slidegeeks and see the positive impacts. Our easy-to-edit Emerging Online User Acquisition Trends In Marketing Online Customer Acquisition Diagrams Pdf can be your go-to option for all upcoming conferences and meetings. So, what are you waiting for Grab this template today. Following slide provide glimpse of emerging trends that helps companies to increase online client acquisition and drive sales. It includes pointers such as rise in voice search, increase use of artificial intelligence, digital transformation etc.
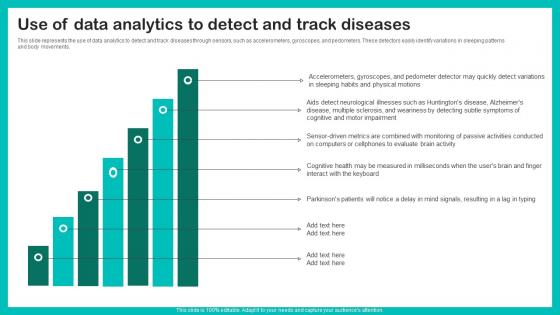
Use Of Data Analytics To Digital Biomarkers For Personalized Health Insights Professional Pdf
This slide represents the use of data analytics to detect and track diseases through sensors, such as accelerometers, gyroscopes, and pedometers. These detectors easily identify variations in sleeping patterns and body movements. Boost your pitch with our creative Use Of Data Analytics To Digital Biomarkers For Personalized Health Insights Professional Pdf. Deliver an awe inspiring pitch that will mesmerize everyone. Using these presentation templates you will surely catch everyones attention. You can browse the ppts collection on our website. We have researchers who are experts at creating the right content for the templates. So you do not have to invest time in any additional work. Just grab the template now and use them. This slide represents the use of data analytics to detect and track diseases through sensors, such as accelerometers, gyroscopes, and pedometers. These detectors easily identify variations in sleeping patterns and body movements.
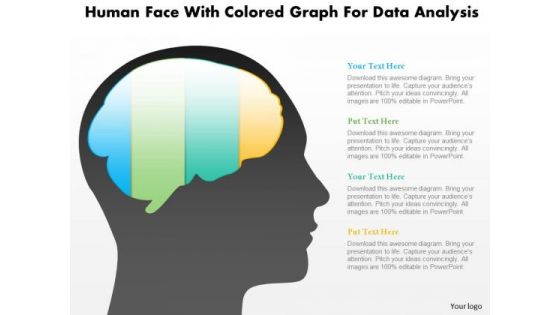
Business Diagram Human Face With Colored Graph For Data Analysis PowerPoint Slide
This diagram displays human face graphic with colored graph. This diagram can be used to represent strategy, planning, thinking of business plan. Display business options in your presentations by using this creative diagram.
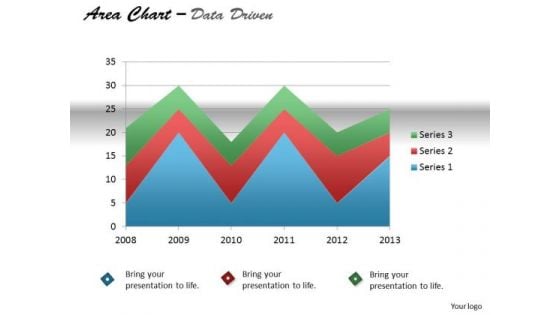
Quantitative Data Analysis Driven Display Series With Area Chart PowerPoint Slides Templates
Our quantitative data analysis driven display series with area chart powerpoint slides Templates Enjoy Drama. They Provide Entertaining Backdrops.

Give Multiple Reppt Slides Diagrams Templates Circular Flow PowerPoint
We present our give multiple reppt slides diagrams templates Circular Flow PowerPoint.Use our Marketing PowerPoint Templates because customer satisfaction is a mantra of the marketplace. Building a loyal client base is an essential element of your business. Download our Arrows PowerPoint Templates because our helpful and interactive Diagram is a wonderful tool to serve your purpose. Make interaction between groups using this seamless system. Use our Business PowerPoint Templates because this layout helps you to bring some important aspects of your business process to the notice of all concerned. Streamline the flow of information across the board. Present our Symbol PowerPoint Templates because you have a clear vision of the cake you want. Present our Process and Flows PowerPoint Templates because the basic stages are in place, you need to build upon them with our PowerPoint templates.Use these PowerPoint slides for presentations relating to 3d, Arrow, Background, Blue, Chart, Choice, Circle, Circular, Circulation, Color, Colorful, Continuity, Cycle, Cyclic, Diagram, Direction, Flow, Graph, Green, Icon, Illustration, Isolated, Isolated On White, Motion, Opportunity, Presentation, Process, Progress, Reason, Recycle, Recycling, Red, Report, Result, Rotation, Round, Scheme, Section, Step, Symbol, Teamwork, Three Dimensional. The prominent colors used in the PowerPoint template are Blue, Pink, Green. We assure you our give multiple reppt slides diagrams templates Circular Flow PowerPoint are Breathtaking. Customers tell us our Choice PowerPoint templates and PPT Slides are Attractive. The feedback we get is that our give multiple reppt slides diagrams templates Circular Flow PowerPoint look good visually. We assure you our Chart PowerPoint templates and PPT Slides are Multicolored. People tell us our give multiple reppt slides diagrams templates Circular Flow PowerPoint are Ultra. We assure you our Choice PowerPoint templates and PPT Slides are Awesome. Our Give Multiple Reppt Slides Diagrams Templates Circular Flow PowerPoint will cause a celebration. Put your audience in a festive mood.
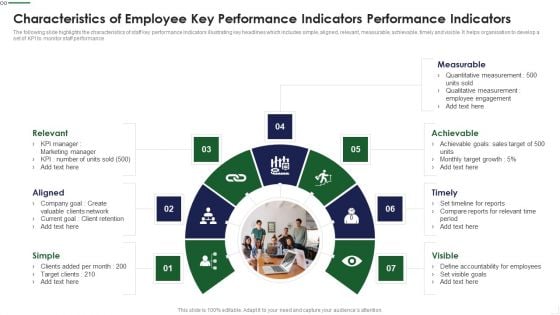
Characteristics Of Employee Key Performance Indicators Performance Indicators Guidelines PDF
The following slide highlights the characteristics of staff key performance Indicators illustrating key headlines which includes simple, aligned, relevant, measurable, achievable, timely and visible. It helps organisation to develop a set of KPI to monitor staff performance Presenting Characteristics Of Employee Key Performance Indicators Performance Indicators Guidelines PDF to dispense important information. This template comprises seven stages. It also presents valuable insights into the topics including Measurable, Achievable, Timely, Visible, Simple This is a completely customizable PowerPoint theme that can be put to use immediately. So, download it and address the topic impactfully.
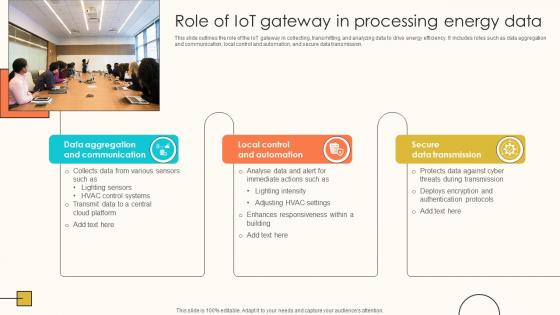
Role Of IoT Gateway In Processing Energy Data Internet Of Things Solutions To Enhance Energy IoT SS V
This slide outlines the role of the IoT gateway in collecting, transmitting, and analyzing data to drive energy efficiency. It includes roles such as data aggregation and communication, local control and automation, and secure data transmission. Do you know about Slidesgeeks Role Of IoT Gateway In Processing Energy Data Internet Of Things Solutions To Enhance Energy IoT SS V These are perfect for delivering any kind od presentation. Using it, create PowerPoint presentations that communicate your ideas and engage audiences. Save time and effort by using our pre-designed presentation templates that are perfect for a wide range of topic. Our vast selection of designs covers a range of styles, from creative to business, and are all highly customizable and easy to edit. Download as a PowerPoint template or use them as Google Slides themes. This slide outlines the role of the IoT gateway in collecting, transmitting, and analyzing data to drive energy efficiency. It includes roles such as data aggregation and communication, local control and automation, and secure data transmission.
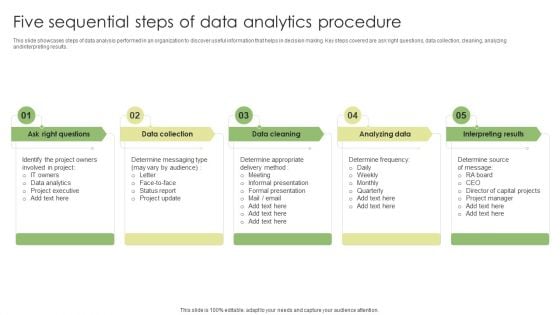
Five Sequential Steps Of Data Analytics Procedure Diagrams PDF
This slide showcases steps of data analysis performed in an organization to discover useful information that helps in decision making. Key steps covered are ask right questions, data collection, cleaning, analyzing and interpreting results. Persuade your audience using this Five Sequential Steps Of Data Analytics Procedure Diagrams PDF. This PPT design covers five stages, thus making it a great tool to use. It also caters to a variety of topics including Data Collection, Analyzing Data, Interpreting Results. Download this PPT design now to present a convincing pitch that not only emphasizes the topic but also showcases your presentation skills.

Diagram Business Data Analysis 8 Stages Ppt Annual Plan Template PowerPoint Slides
We present our diagram business data analysis 8 stages ppt annual plan template PowerPoint Slides.Download and present our Process and Flows PowerPoint Templates because Our PowerPoint Templates and Slides will weave a web of your great ideas. They are gauranteed to attract even the most critical of your colleagues. Download and present our Circle Charts PowerPoint Templates because Our PowerPoint Templates and Slides will let you Leave a lasting impression to your audiences. They possess an inherent longstanding recall factor. Use our Business PowerPoint Templates because our bewitching PowerPoint Templates and Slides will delight your audience with the magic of your words. Download and present our Marketing PowerPoint Templates because Our PowerPoint Templates and Slides will weave a web of your great ideas. They are gauranteed to attract even the most critical of your colleagues. Download our Shapes PowerPoint Templates because You can Be the star of the show with our PowerPoint Templates and Slides. Rock the stage with your ideas.Use these PowerPoint slides for presentations relating to Provider, plan, vector, diagram, circle, insurance, graphic, service, graph, wheel, illustration, chart, round, primary, specialist, clipart, care, choosing, clip, blue, text, physician, maintenance, , organization, art, preferred, point, deductible, business. The prominent colors used in the PowerPoint template are Blue, Gray, Black. Fight back gamely with our Diagram Business Data Analysis 8 Stages Ppt Annual Plan Template PowerPoint Slides. Make adversity back off with your thoughts.

Effective KPIs For Recruitment Employee Attraction And Competency Ppt Presentation
This slide shows main key performance indicators that are used to measure various aspects related to hiring. It include KPIs such as time to hire, cost per hire and attrition rate, etc. Whether you have daily or monthly meetings, a brilliant presentation is necessary. Effective KPIs For Recruitment Employee Attraction And Competency Ppt Presentation can be your best option for delivering a presentation. Represent everything in detail using Effective KPIs For Recruitment Employee Attraction And Competency Ppt Presentation and make yourself stand out in meetings. The template is versatile and follows a structure that will cater to your requirements. All the templates prepared by Slidegeeks are easy to download and edit. Our research experts have taken care of the corporate themes as well. So, give it a try and see the results. This slide shows main key performance indicators that are used to measure various aspects related to hiring. It include KPIs such as time to hire, cost per hire and attrition rate, etc.
Splunk Big Data Analytics Ppt Powerpoint Presentation Complete Deck With Slides
Share a great deal of information on the topic by deploying this Splunk Big Data Analytics Ppt Powerpoint Presentation Complete Deck With Slides Support your ideas and thought process with this prefabricated set. It includes a set of fifteen slides, all fully modifiable and editable. Each slide can be restructured and induced with the information and content of your choice. You can add or remove large content boxes as well, to make this PPT slideshow more personalized. Its high-quality graphics and visuals help in presenting a well-coordinated pitch. This PPT template is also a resourceful tool to take visual cues from and implement the best ideas to help your business grow and expand. The main attraction of this well-formulated deck is that everything is editable, giving you the freedom to adjust it to your liking and choice. Changes can be made in the background and theme as well to deliver an outstanding pitch. Therefore, click on the download button now to gain full access to this multifunctional set. Our Splunk Big Data Analytics Ppt Powerpoint Presentation Complete Deck With Slides are topically designed to provide an attractive backdrop to any subject. Use them to look like a presentation pro.

Big Data Analytics In The Manufacturing Industry Ppt Powerpoint Presentation Complete Deck With Slides
If designing a presentation takes a lot of your time and resources and you are looking for a better alternative, then this Big Data Analytics In The Manufacturing Industry Ppt Powerpoint Presentation Complete Deck With Slides is the right fit for you. This is a prefabricated set that can help you deliver a great presentation on the topic. All the twenty slides included in this sample template can be used to present a birds-eye view of the topic. These slides are also fully editable, giving you enough freedom to add specific details to make this layout more suited to your business setting. Apart from the content, all other elements like color, design, theme are also replaceable and editable. This helps in designing a variety of presentations with a single layout. Not only this, you can use this PPT design in formats like PDF, PNG, and JPG once downloaded. Therefore, without any further ado, download and utilize this sample presentation as per your liking. Our Big Data Analytics In The Manufacturing Industry Ppt Powerpoint Presentation Complete Deck With Slides are topically designed to provide an attractive backdrop to any subject. Use them to look like a presentation pro.
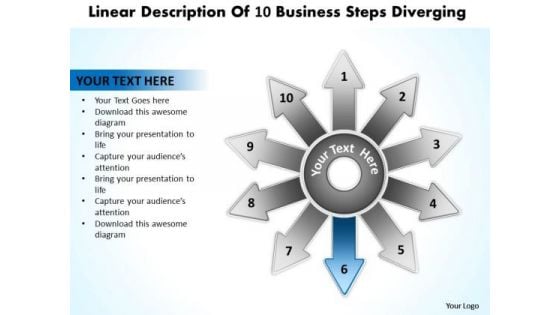
Linear Description Of 10 Business Steps Diverging Circular Motion Process PowerPoint Slides
We present our linear description of 10 business steps diverging Circular Motion Process PowerPoint Slides.Download our Communication PowerPoint Templates because the Gear train is a basic element of living and daily business. Download and present our Business PowerPoint Templates because you have analysed many global markets and come up with possibilities. Highlight the pros and cons of other likely business oppurtunities. Use our Arrows PowerPoint Templates because you can Churn the wheels of the brains of your colleagues. Download and present our Symbol PowerPoint Templates because it depicts Rolling along while gathering profits along the way is the aim. Use our Process and Flows PowerPoint Templates because this PPt slide helps you to measure key aspects of the current process and collect relevant data.Use these PowerPoint slides for presentations relating to Abstract, Arrow, Background, Buttons, Circle, Clean, Communication, Concept, Conceptual, Design, Diagram, Direction, Elements, Exchange, Flow, Flowchart, Graph, Graphic, Icon, Illustration, Internet, Precise, Process, Red, Sign, Symbol, Template. The prominent colors used in the PowerPoint template are Blue, Gray, Black. Use our linear description of 10 business steps diverging Circular Motion Process PowerPoint Slides will help them to explain complicated concepts. We assure you our Conceptual PowerPoint templates and PPT Slides effectively help you save your valuable time. People tell us our linear description of 10 business steps diverging Circular Motion Process PowerPoint Slides are Nostalgic. PowerPoint presentation experts tell us our Clean PowerPoint templates and PPT Slides are Elevated. PowerPoint presentation experts tell us our linear description of 10 business steps diverging Circular Motion Process PowerPoint Slides are Multicolored. Use our Clean PowerPoint templates and PPT Slides are Nifty. Our Linear Description Of 10 Business Steps Diverging Circular Motion Process PowerPoint Slides are exemplary contributors. They go all out to achieve the common goal.
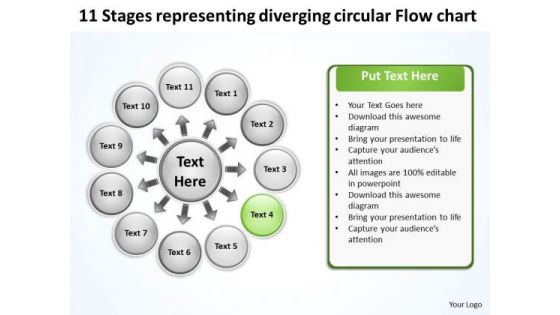
Representing Diverging Circular Flow Chart PowerPoint Templates
We present our representing diverging circular flow chart PowerPoint templates.Present our Ring charts PowerPoint Templates because this PPt slide helps you to measure key aspects of the current process and collect relevant data. Download our Circle charts PowerPoint Templates because the mind is always whirring with new ideas. Download our Process and Flows PowerPoint Templates because you have a clear vision of the cake you want. Download our Business PowerPoint Templates because you can Flutter your wings and enchant the world. Impress them with the innate attractiveness of your thoughts and words. Download our Marketing PowerPoint Templates because with the help of our Slides you can Illustrate your ideas one by one and demonstrate how each is an important cog in running the entire wheel.Use these PowerPoint slides for presentations relating to Circle, circulation, cobalt,colorful, cyan, cycle, element,emblem, grayshadow, green,icon, indicator, interface, internet, label,link, load, marker, motion, movement,navigationpanel, next, orientation, pagsite, pink, pointer, previous, process, reload, rotation, satined, sign, signpost,smooth, sticker, sticky, symbol. The prominent colors used in the PowerPoint template are Green, Black, White. Customers tell us our representing diverging circular flow chart PowerPoint templates will make the presenter successul in his career/life. We assure you our cobalt PowerPoint templates and PPT Slides are Nifty. PowerPoint presentation experts tell us our representing diverging circular flow chart PowerPoint templates are Fabulous. People tell us our grayshadow PowerPoint templates and PPT Slides will help you be quick off the draw. Just enter your specific text and see your points hit home. We assure you our representing diverging circular flow chart PowerPoint templates are Excellent. Use our cobalt PowerPoint templates and PPT Slides have awesome images to get your point across. Compile targets with our Representing Diverging Circular Flow Chart PowerPoint Templates. Download without worries with our money back guaranteee.
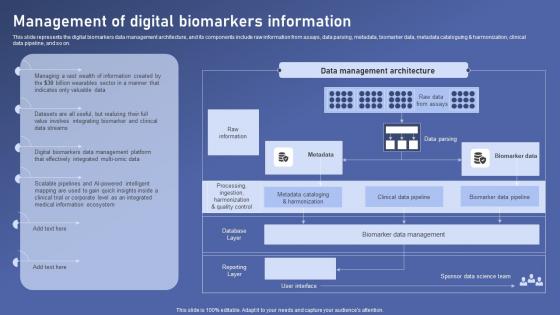
Management Digital Biomarkers Biomedical Data Science And Health Informatics Themes Pdf
This slide represents the digital biomarkers data management architecture, and its components include raw information from assays, data parsing, metadata, biomarker data, metadata cataloguing and harmonization, clinical data pipeline, and so on. Do you know about Slidesgeeks Management Digital Biomarkers Biomedical Data Science And Health Informatics Themes Pdf These are perfect for delivering any kind od presentation. Using it, create PowerPoint presentations that communicate your ideas and engage audiences. Save time and effort by using our pre designed presentation templates that are perfect for a wide range of topic. Our vast selection of designs covers a range of styles, from creative to business, and are all highly customizable and easy to edit. Download as a PowerPoint template or use them as Google Slides themes. This slide represents the digital biomarkers data management architecture, and its components include raw information from assays, data parsing, metadata, biomarker data, metadata cataloguing and harmonization, clinical data pipeline, and so on.
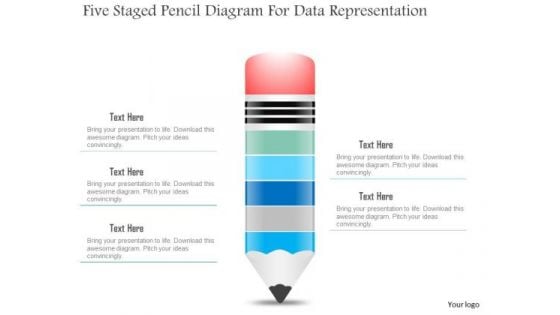
Business Diagram Five Staged Pencil Diagram For Data Representation PowerPoint Slide
This business slide displays five staged pencil diagram. It contains pencil graphic divided into five parts. This diagram slide depicts processes, stages, steps, points, options and education information display. Use this diagram, in your presentations to express your views innovatively.
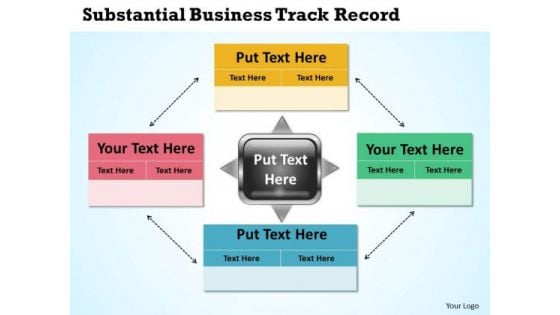
New Business PowerPoint Presentation Track Record Circular Flow Layout Network Slides
We present our new business powerpoint presentation track record Circular Flow Layout Network Slides.Present our Marketing PowerPoint Templates because customer satisfaction is a mantra of the marketplace. Building a loyal client base is an essential element of your business. Use our Boxes PowerPoint Templates because you can Show them how to churn out fresh ideas. Download our Arrows PowerPoint Templates because this is an excellent slide to detail and highlight your thought process, your views and your positive expectations.. Download and present our Business PowerPoint Templates because you can Flutter your wings and enchant the world. Impress them with the innate attractiveness of your thoughts and words. Present our Shapes PowerPoint Templates because brilliant ideas popping up all over the place.Use these PowerPoint slides for presentations relating to Arrow, Background, Ball, Business, Button, Catalog, Chart, Circle, Circular, Clipart, Company, Concept, Cross, Cycle, Development, Diagram, Edit, Editable, Element, Goals, Icon, Leader, Marketing, Model, Navigation, Organization, Parts, Pie, Plans, Presentation, Report, Representation, Retro, Six, Sphere, Stakeholder, Team. The prominent colors used in the PowerPoint template are Yellow, Red, Green. We assure you our new business powerpoint presentation track record Circular Flow Layout Network Slides are aesthetically designed to attract attention. We guarantee that they will grab all the eyeballs you need. Customers tell us our Button PowerPoint templates and PPT Slides are Pretty. The feedback we get is that our new business powerpoint presentation track record Circular Flow Layout Network Slides are Nifty. We assure you our Chart PowerPoint templates and PPT Slides are Efficacious. People tell us our new business powerpoint presentation track record Circular Flow Layout Network Slides are effectively colour coded to prioritise your plans They automatically highlight the sequence of events you desire. We assure you our Button PowerPoint templates and PPT Slides are Fabulous. Discipline is the bedrock of achievement. Advocate adherence with our New Business PowerPoint Presentation Track Record Circular Flow Layout Network Slides.
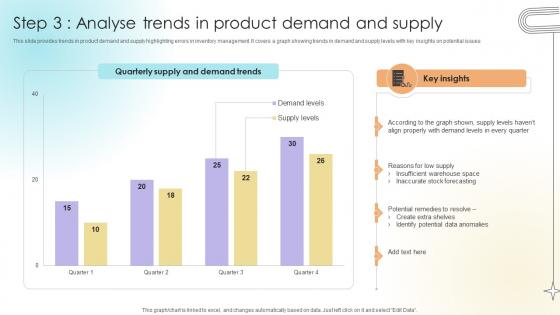
Step 3 Analyse Trends In Product Demand And Supply Data Analytics SS V
This slide provides trends in product demand and supply highlighting errors in inventory management. It covers a graph showing trends in demand and supply levels with key insights on potential issues.Formulating a presentation can take up a lot of effort and time, so the content and message should always be the primary focus. The visuals of the PowerPoint can enhance the presenters message, so our Step 3 Analyse Trends In Product Demand And Supply Data Analytics SS V was created to help save time. Instead of worrying about the design, the presenter can concentrate on the message while our designers work on creating the ideal templates for whatever situation is needed. Slidegeeks has experts for everything from amazing designs to valuable content, we have put everything into Step 3 Analyse Trends In Product Demand And Supply Data Analytics SS V. This slide provides trends in product demand and supply highlighting errors in inventory management. It covers a graph showing trends in demand and supply levels with key insights on potential issues.
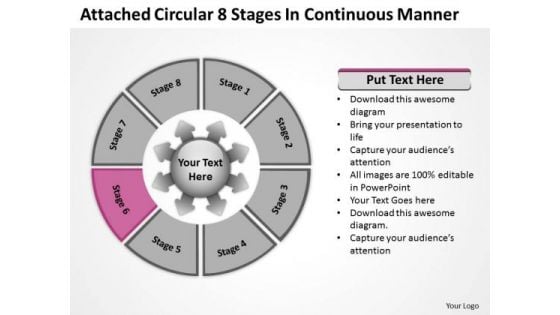
Attached Circular 8 Stages In Continuous Manner Ppt Cycle Process PowerPoint Templates
We present our attached circular 8 stages in continuous manner ppt Cycle Process PowerPoint templates.Use our Arrows PowerPoint Templates because this diagram provides multiple options for taking in and making sense of information. Use our Process and flows PowerPoint Templates because the Gear train is a basic element of living and daily business. Use our Flow charts PowerPoint Templates because They will Put your wonderful verbal artistry on display. Our PowerPoint Templates and Slides will provide you the necessary glam and glitter. Present our Marketing PowerPoint Templates because networking is an imperative in todays world. You need to access the views of others. Similarly you need to give access to them of your abilities. Use our Shapes PowerPoint Templates because it demonstrates the seeds of many of our successes.Use these PowerPoint slides for presentations relating to Arrows, chart, circle, circular, circulation, colorful, connection, continuity, cycle, cyclic, diagram, direction, flow, graph, icon, illustration, isolated, isolated on white, pink, presentation, process, progress, reason, recycle, recycling, repetition, report, result, ring, rotation, round, section, step, symbol. The prominent colors used in the PowerPoint template are Pink, Black, Gray. People tell us our attached circular 8 stages in continuous manner ppt Cycle Process PowerPoint templates are Energetic. We assure you our circulation PowerPoint templates and PPT Slides are No-nonsense. PowerPoint presentation experts tell us our attached circular 8 stages in continuous manner ppt Cycle Process PowerPoint templates are Versatile. You can be sure our cycle PowerPoint templates and PPT Slides are Amazing. Professionals tell us our attached circular 8 stages in continuous manner ppt Cycle Process PowerPoint templates are Classic. Use our circular PowerPoint templates and PPT Slides are Fantastic. Bid adieu to difficulty. Our Attached Circular 8 Stages In Continuous Manner Ppt Cycle Process PowerPoint Templates ensure you fare well.
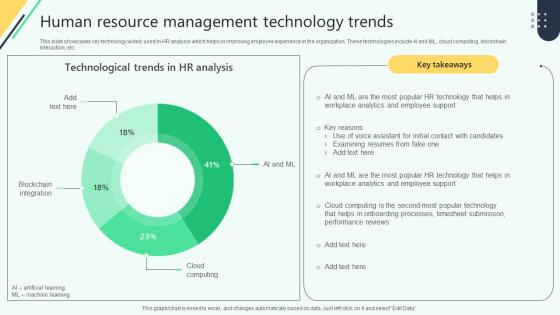
Human Resource Management Technology Trends Analysing Hr Data For Effective Decision Making
This slide showcases key technology widely used in HR analysis which helps in improving employee experience in the organization. These technologies include AI and ML, cloud computing, blockchain interaction, etc. Are you searching for a Human Resource Management Technology Trends Analysing Hr Data For Effective Decision Making that is uncluttered, straightforward, and original Its easy to edit, and you can change the colors to suit your personal or business branding. For a presentation that expresses how much effort you have put in, this template is ideal With all of its features, including tables, diagrams, statistics, and lists, its perfect for a business plan presentation. Make your ideas more appealing with these professional slides. Download Human Resource Management Technology Trends Analysing Hr Data For Effective Decision Making from Slidegeeks today. This slide showcases key technology widely used in HR analysis which helps in improving employee experience in the organization. These technologies include AI and ML, cloud computing, blockchain interaction, etc.
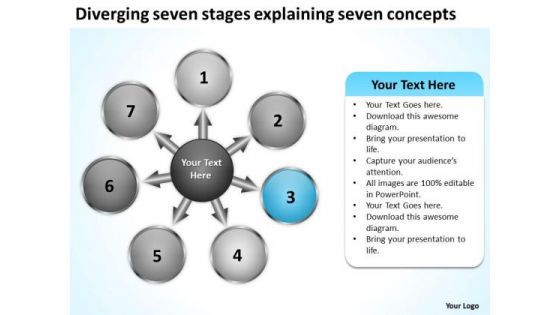
Seven Stages Explaining Concepts Circular Process PowerPoint Templates
We present our seven stages explaining concepts Circular Process PowerPoint templates.Download our Marketing PowerPoint Templates because business ethics is an essential element in your growth. Download and present our Arrows PowerPoint Templates because they enhance the essence of your viable ideas. Present our Flow charts PowerPoint Templates because your brain is always churning out ideas like cogs in a wheel. Download and present our Process and Flows PowerPoint Templates because you have some hits, you had some misses. Download and present our Business PowerPoint Templates because project your ideas to you colleagues and complete the full picture.Use these PowerPoint slides for presentations relating to Arrows, background, blue, chart, circle, circular, circulation, clipart, colorful, connection, continuity, cycle, cyclic, diagram, direction, empty, flow, graph, green, icon, illustration, isolated ,loop, motion presentation, process, progress, reason, recycle, recycling, repetition, report, result, ring, rotation, round, scheme, section, step, , symbol, teamwork . The prominent colors used in the PowerPoint template are Blue light, White, Gray. The feedback we get is that our seven stages explaining concepts Circular Process PowerPoint templates are Classic. The feedback we get is that our circulation PowerPoint templates and PPT Slides are Stylish. People tell us our seven stages explaining concepts Circular Process PowerPoint templates are Gorgeous. We assure you our circular PowerPoint templates and PPT Slides will impress their bosses and teams. We assure you our seven stages explaining concepts Circular Process PowerPoint templates are Royal. The feedback we get is that our circular PowerPoint templates and PPT Slides are Versatile. Bolster the excitement with our Seven Stages Explaining Concepts Circular Process PowerPoint Templates. They will not let the enthusiasm fade.
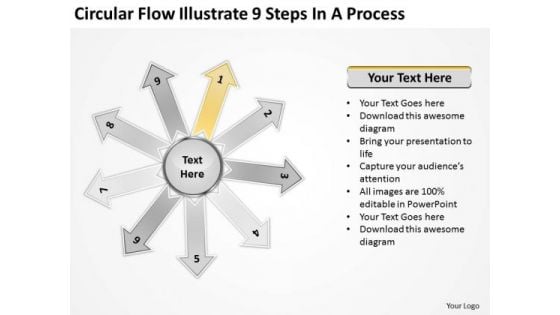
Circular Flow Illustrate 9 Steps In Process Cycle PowerPoint Templates
We present our circular flow illustrate 9 steps in process Cycle PowerPoint templates.Download our Process and flows PowerPoint Templates because our creative template will lay down your views. Download our Business PowerPoint Templates because you can spread the fruits of your efforts and elaborate your ideas on the prevention, diagnosis, control and cure of prevalent diseases. Present our Marketing PowerPoint Templates because The marketplace is the merger of your dreams and your ability. Download and present our Flow charts PowerPoint Templates because it depicts that Original thinking is the need of the hour. Present our Arrows PowerPoint Templates because readymade PowerPoint templates can prove best of your knowledge for your slides to show.Use these PowerPoint slides for presentations relating to Circle, circular, circulation, clipart, colorful, connection, continuity, cycle, cyclic, diagram, direction, flow, graph, icon, illustration, isolated,blue light, presentation, process, progress, reason, recycle, recycling, repetition, report, result, ring, rotation, round, scheme, section, step, sticker, symbol, arrows , flow charts. The prominent colors used in the PowerPoint template are Blue light, Black, White. People tell us our circular flow illustrate 9 steps in process Cycle PowerPoint templates will impress their bosses and teams. We assure you our cycle PowerPoint templates and PPT Slides are Chic. PowerPoint presentation experts tell us our circular flow illustrate 9 steps in process Cycle PowerPoint templates are Enchanting. You can be sure our circulation PowerPoint templates and PPT Slides have awesome images to get your point across. Professionals tell us our circular flow illustrate 9 steps in process Cycle PowerPoint templates will make the presenter look like a pro even if they are not computer savvy. Use our circulation PowerPoint templates and PPT Slides are Beautiful. Plan your attack with our Circular Flow Illustrate 9 Steps In Process Cycle PowerPoint Templates. You will come out on top.
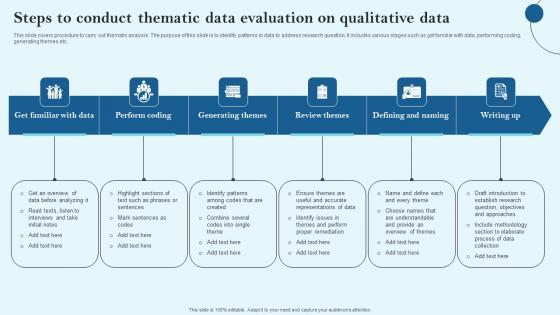
Steps To Conduct Thematic Data Evaluation On Qualitative Data Themes Pdf
This slide covers procedure to carry out thematic analysis. The purpose of this slide is to identify patterns in data to address research question. It includes various stages such as get familiar with data, performing coding, generating themes etc. Pitch your topic with ease and precision using this Steps To Conduct Thematic Data Evaluation On Qualitative Data Themes Pdf This layout presents information on Perform Coding, Generating Themes, Review Themes It is also available for immediate download and adjustment. So, changes can be made in the color, design, graphics or any other component to create a unique layout. This slide covers procedure to carry out thematic analysis. The purpose of this slide is to identify patterns in data to address research question. It includes various stages such as get familiar with data, performing coding, generating themes etc.
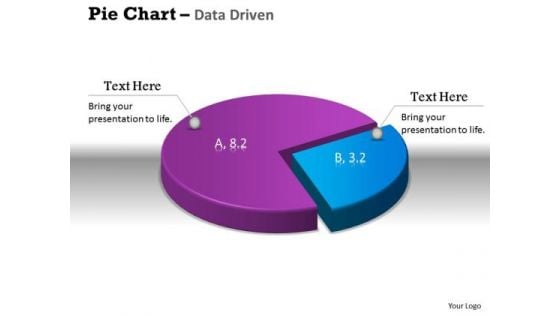
Data Analysis Excel 3d Pie Chart Shows Relative Size Of PowerPoint Templates
Get The Doers Into Action. Activate Them With Our data analysis excel 3d pie chart shows relative size of Powerpoint Templates.
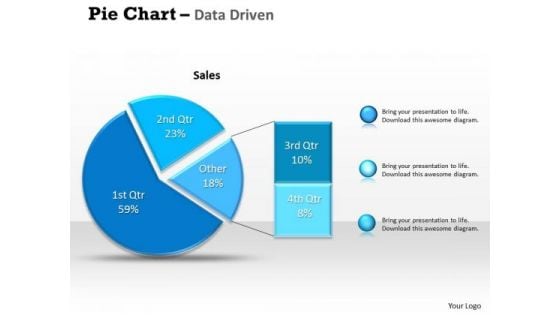
Data Analysis Excel Driven Percentage Breakdown Pie Chart PowerPoint Slides Templates
Be A Donor Of Great Ideas. Display Your Charity On Our data analysis excel driven percentage breakdown pie chart powerpoint slides Templates.
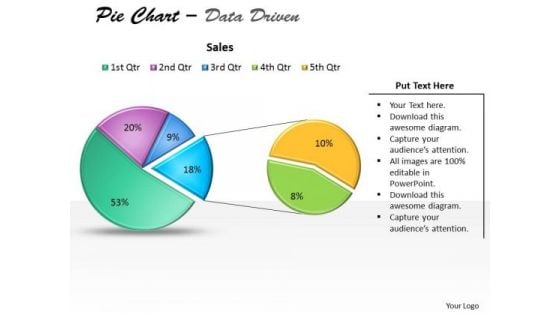
Data Analysis Excel Driven Pie Chart For Business Stratregy PowerPoint Slides Templates
Open Up Doors That Lead To Success. Our data analysis excel driven pie chart for business stratregy powerpoint slides Templates Provide The Handles.

Data Analysis Excel Driven Pie Chart For Easy Comparison PowerPoint Slides Templates
Our data analysis excel driven pie chart for easy comparison powerpoint slides Templates Abhor Doodling. They Never Let The Interest Flag.
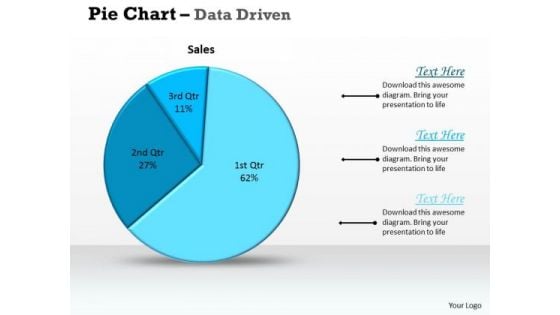
Data Analysis Excel Driven Pie Chart For Sales Process PowerPoint Slides Templates
Deliver The Right Dose With Our data analysis excel driven pie chart for sales process powerpoint slides Templates . Your Ideas Will Get The Correct Illumination.
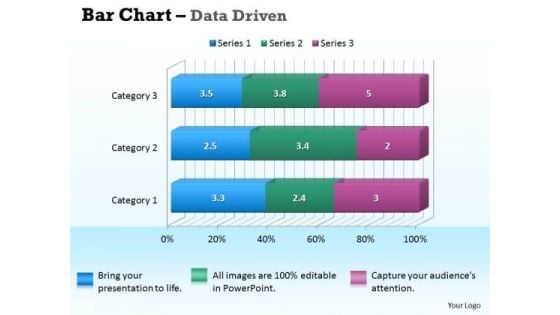
Data Analysis In Excel 3d Bar Chart For Business Information PowerPoint Templates
Our data analysis in excel 3d bar chart for business information Powerpoint Templates Deliver At Your Doorstep. Let Them In For A Wonderful Experience.
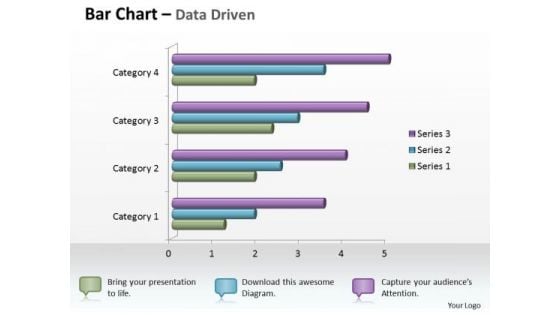
Data Analysis In Excel 3d Bar Chart For Business Statistics PowerPoint Templates
Knock On The Door To Success With Our data analysis in excel 3d bar chart for business statistics Powerpoint Templates . Be Assured Of Gaining Entry.
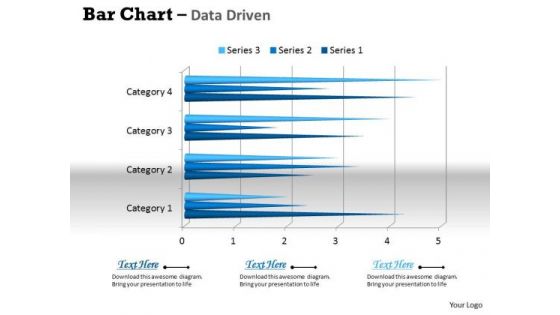
Data Analysis In Excel 3d Bar Chart For Business Trends PowerPoint Templates
Connect The Dots With Our data analysis in excel 3d bar chart for business trends Powerpoint Templates . Watch The Whole Picture Clearly Emerge.
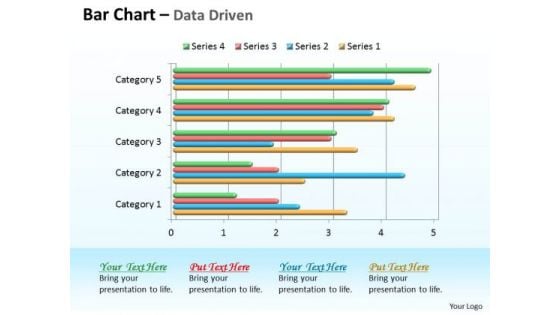
Data Analysis In Excel 3d Bar Chart For Comparison Of Time Series PowerPoint Templates
Double Your Chances With Our data analysis in excel 3d bar chart for comparison of time series Powerpoint Templates . The Value Of Your Thoughts Will Increase Two-Fold.
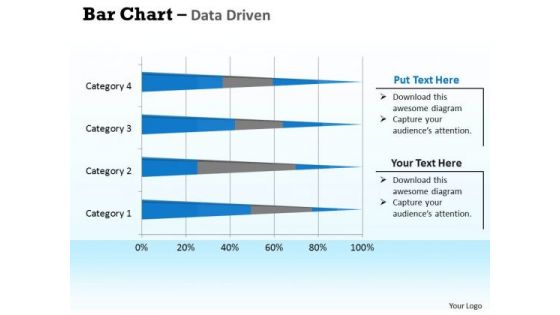
Data Analysis In Excel 3d Bar Chart For Interpretation PowerPoint Templates
Double Up Our data analysis in excel 3d bar chart for interpretation Powerpoint Templates With Your Thoughts. They Will Make An Awesome Pair.
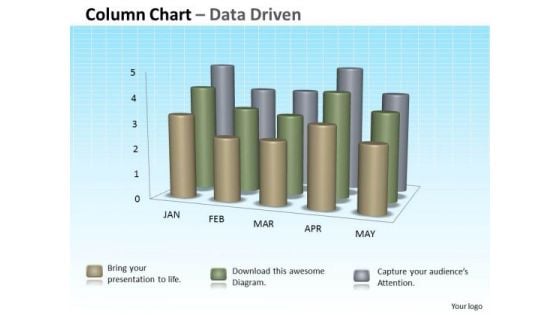
Data Analysis In Excel 3d Column Chart For Sets Of Information PowerPoint Templates
Double The Impact With Our data analysis in excel 3d column chart for sets of information Powerpoint Templates . Your Thoughts Will Have An Imposing Effect.
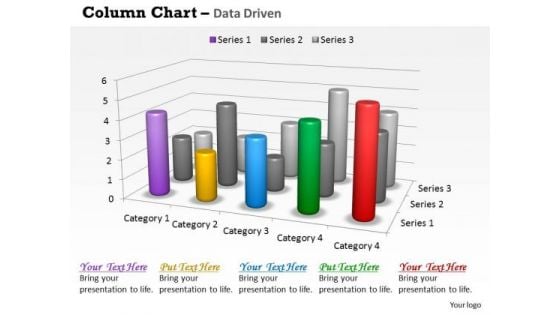
Data Analysis In Excel 3d Survey For Sales Chart PowerPoint Templates
Good Camaraderie Is A Key To Teamwork. Our data analysis in excel 3d survey for sales chart Powerpoint Templates Can Be A Cementing Force.
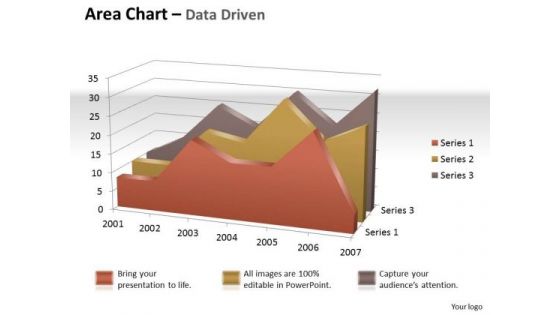
Data Analysis In Excel 3d Visual Display Of Area Chart PowerPoint Templates
Brace Yourself, Arm Your Thoughts. Prepare For The Hustle With Our data analysis in excel 3d visual display of area chart Powerpoint Templates .
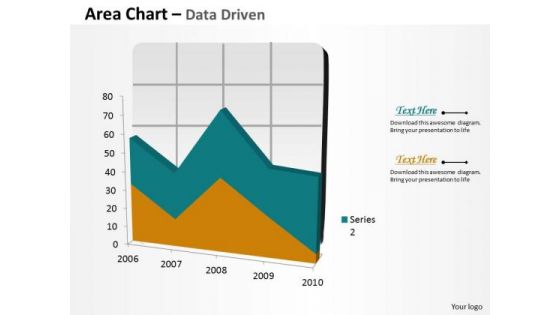
Data Analysis In Excel Area Chart For Business Process PowerPoint Templates
Your Grasp Of Economics Is Well Known. Help Your Audience Comprehend Issues With Our data analysis in excel area chart for business process Powerpoint Templates .
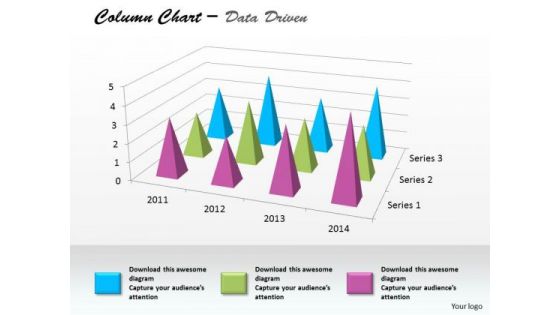
Data Analysis In Excel Column Chart For Business Project PowerPoint Templates
Edit Your Work With Our data analysis in excel column chart for business project Powerpoint Templates . They Will Help You Give The Final Form.
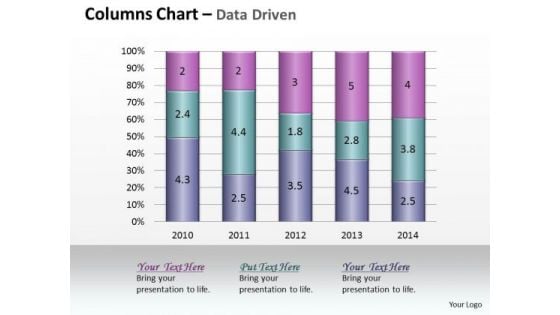
Data Analysis In Excel Column Chart Of Various Fields PowerPoint Templates
Land The Idea With Our data analysis in excel column chart of various fields Powerpoint Templates . Help It Grow With Your Thoughts.
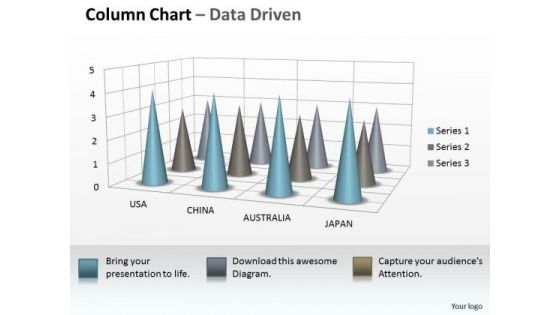
Data Analysis On Excel 3d Chart To Incorporate Business Information PowerPoint Templates
Our data analysis on excel 3d chart to incorporate business information Powerpoint Templates Allow You To Do It With Ease. Just Like Picking The Low Hanging Fruit.
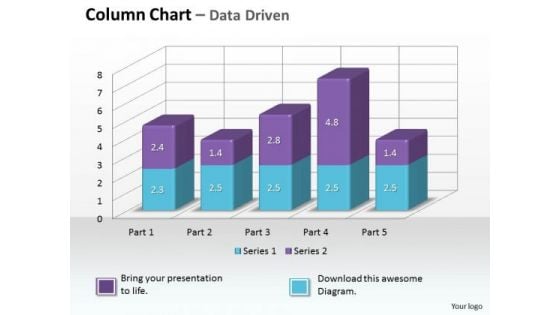
Data Analysis On Excel 3d Chart To Monitor Business Process PowerPoint Templates
Make Some Dough With Our data analysis on excel 3d chart to monitor business process Powerpoint Templates . Your Assets Will Rise Significantly.
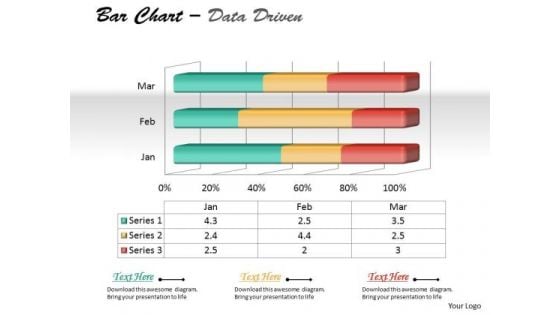
Data Analysis On Excel 3d Chart To Represent Quantitative Differences PowerPoint Templates
Draft It Out On Our data analysis on excel 3d chart to represent quantitative differences Powerpoint Templates . Give The Final Touches With Your Ideas.
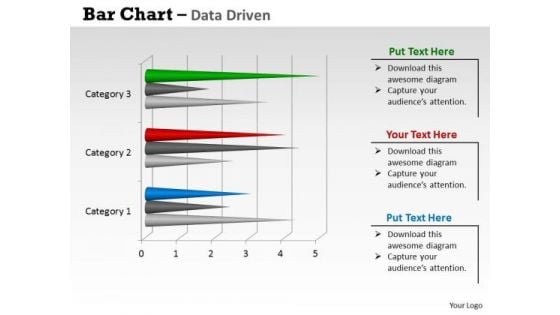
Data Analysis On Excel 3d Chart With Sets Of PowerPoint Templates
Reduce The Drag With Our data analysis on excel 3d chart with sets of Powerpoint Templates . Give More Lift To Your Thoughts.
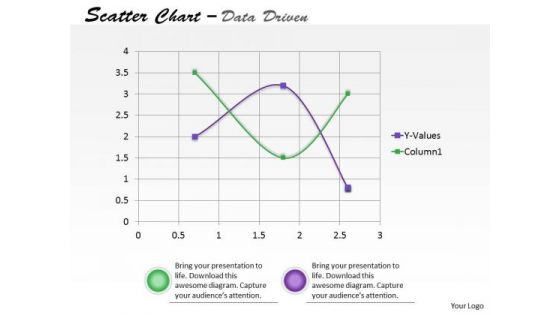
Data Analysis On Excel Driven Scatter Chart To Predict Future Movements PowerPoint Slides Templates
Our data analysis on excel driven scatter chart to predict future movements powerpoint slides Templates Enjoy Drama. They Provide Entertaining Backdrops.
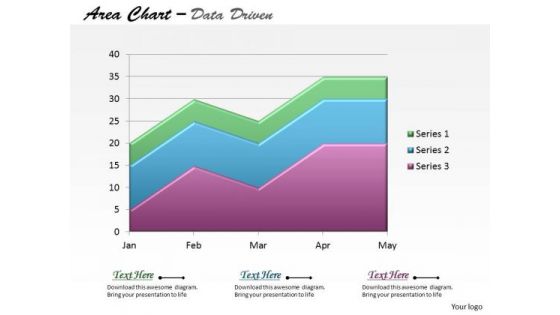
Data Analysis On Excel Driven Stacked Area Chart PowerPoint Slides Templates
Be The Dramatist With Our data analysis on excel driven stacked area chart powerpoint slides Templates . Script Out The Play Of Words.
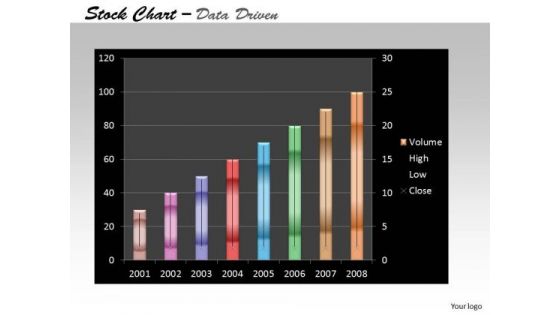
Data Analysis On Excel Driven Stock Chart For Business Growth PowerPoint Slides Templates
Add Some Dramatization To Your Thoughts. Our data analysis on excel driven stock chart for business growth powerpoint slides Templates Make Useful Props.
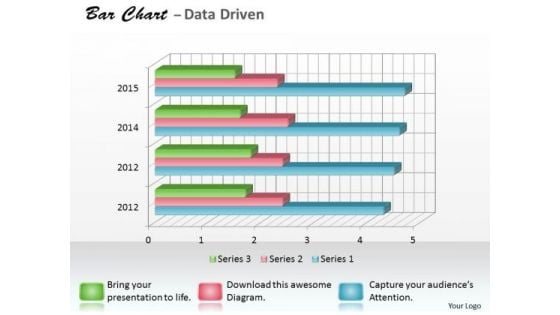
Data Analysis Programs 3d Bar Chart For Research In Statistics PowerPoint Templates
Draw It Out On Our data analysis programs 3d bar chart for research in statistics Powerpoint Templates . Provide Inspiration To Your Colleagues.

 Home
Home