Dashboard Icon
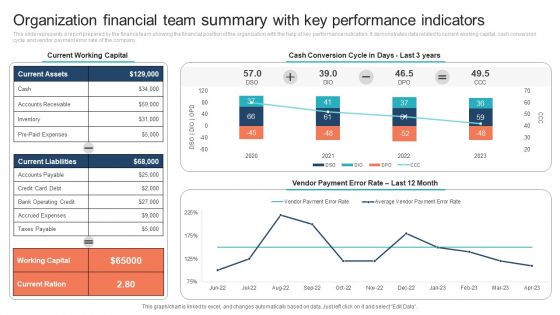
Organization Financial Team Summary With Key Performance Indicators Clipart PDF
This slide represents a report prepared by the finance team showing the financial position of the organization with the help of key performance indicators. It demonstrates data related to current working capital, cash conversion cycle and vendor payment error rate of the company. Pitch your topic with ease and precision using this Organization Financial Team Summary With Key Performance Indicators Clipart PDF. This layout presents information on Current Working Capital, Cash Conversion Cycle. It is also available for immediate download and adjustment. So, changes can be made in the color, design, graphics or any other component to create a unique layout.
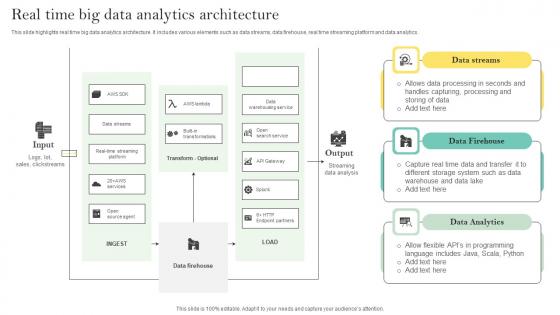
Real Time Big Data Analytics Architecture Ppt Infographics Microsoft Pdf
This slide highlights real time big data analytics architecture. It includes various elements such as data streams, data firehouse, real time streaming platform and data analytics. Showcasing this set of slides titled Real Time Big Data Analytics Architecture Ppt Infographics Microsoft Pdf. The topics addressed in these templates are Data Streams, Data Firehouse, Real Time. All the content presented in this PPT design is completely editable. Download it and make adjustments in color, background, font etc. as per your unique business setting. This slide highlights real time big data analytics architecture. It includes various elements such as data streams, data firehouse, real time streaming platform and data analytics.
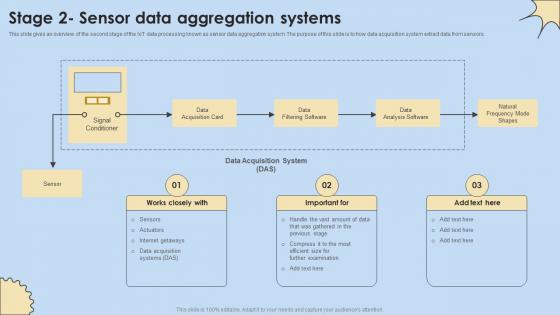
Stage 2 Sensor Data Aggregation Systems Internet Of Things Analysis Introduction Pdf
This slide gives an overview of the second stage of the IoT data processing known as sensor data aggregation system. The purpose of this slide is to how data acquisition system extract data from sensors. Do you know about Slidesgeeks Stage 2 Sensor Data Aggregation Systems Internet Of Things Analysis Introduction Pdf These are perfect for delivering any kind od presentation. Using it, create PowerPoint presentations that communicate your ideas and engage audiences. Save time and effort by using our pre-designed presentation templates that are perfect for a wide range of topic. Our vast selection of designs covers a range of styles, from creative to business, and are all highly customizable and easy to edit. Download as a PowerPoint template or use them as Google Slides themes. This slide gives an overview of the second stage of the IoT data processing known as sensor data aggregation system. The purpose of this slide is to how data acquisition system extract data from sensors.
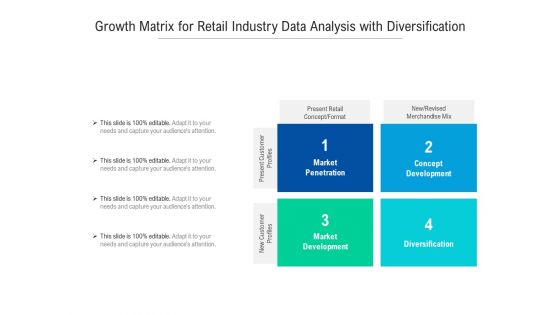
Growth Matrix For Retail Industry Data Analysis With Diversification Ppt Powerpoint Presentation Pictures Microsoft Pdf
Presenting growth matrix for retail industry data analysis with diversification ppt powerpoint presentation pictures microsoft pdf to dispense important information. This template comprises four stages. It also presents valuable insights into the topics including market penetration, concept development, diversification, market development, present retail concept format, present customer profiles, new customer profiles. This is a completely customizable PowerPoint theme that can be put to use immediately. So, download it and address the topic impactfully.
Understanding Scheduling Phase Operations Strategy Improve Business Productivity Mockup Pdf
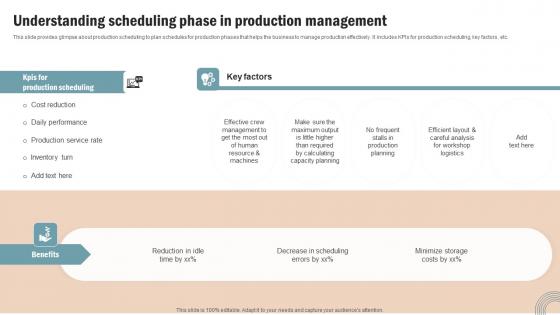
This slide provides glimpse about production scheduling to plan schedules for production phases that helps the business to manage production effectively. It includes KPIs for production scheduling, key factors, etc. Do you have an important presentation coming up Are you looking for something that will make your presentation stand out from the rest Look no further than Understanding Scheduling Phase Operations Strategy Improve Business Productivity Mockup Pdf. With our professional designs, you can trust that your presentation will pop and make delivering it a smooth process. And with Slidegeeks, you can trust that your presentation will be unique and memorable. So why wait Grab Understanding Scheduling Phase Operations Strategy Improve Business Productivity Mockup Pdf today and make your presentation stand out from the rest This slide provides glimpse about production scheduling to plan schedules for production phases that helps the business to manage production effectively. It includes KPIs for production scheduling, key factors, etc.
Agenda For Data Custodianship Professional Pdf
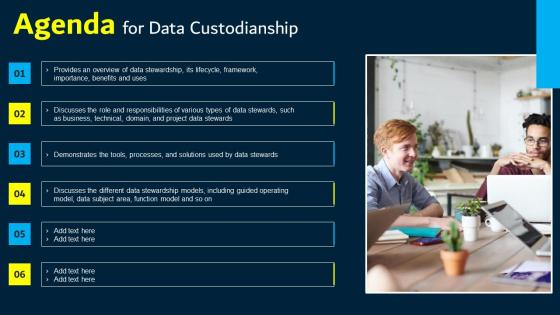
Whether you have daily or monthly meetings, a brilliant presentation is necessary. Agenda For Data Custodianship Professional Pdf can be your best option for delivering a presentation. Represent everything in detail using Agenda For Data Custodianship Professional Pdf and make yourself stand out in meetings. The template is versatile and follows a structure that will cater to your requirements. All the templates prepared by Slidegeeks are easy to download and edit. Our research experts have taken care of the corporate themes as well. So, give it a try and see the results. Our Agenda For Data Custodianship Professional Pdf are topically designed to provide an attractive backdrop to any subject. Use them to look like a presentation pro.
Business Process Data Lineage Data Lineage Based On Persona Specific Use Cases Infographics Pdf
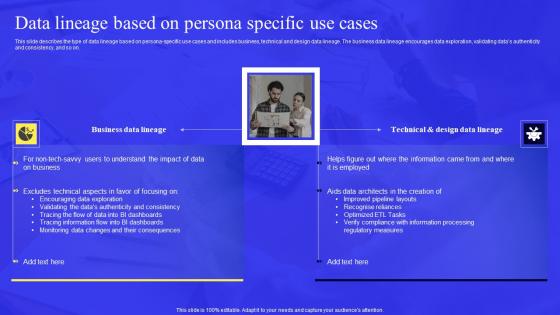
This slide describes the type of data lineage based on persona specific use cases and includes business, technical and design data lineage. The business data lineage encourages data exploration, validating datas authenticity and consistency, and so on. Whether you have daily or monthly meetings, a brilliant presentation is necessary. Business Process Data Lineage Data Lineage Based On Persona Specific Use Cases Infographics Pdf can be your best option for delivering a presentation. Represent everything in detail using Business Process Data Lineage Data Lineage Based On Persona Specific Use Cases Infographics Pdf and make yourself stand out in meetings. The template is versatile and follows a structure that will cater to your requirements. All the templates prepared by Slidegeeks are easy to download and edit. Our research experts have taken care of the corporate themes as well. So, give it a try and see the results. This slide describes the type of data lineage based on persona-specific use cases and includes business, technical and design data lineage. The business data lineage encourages data exploration, validating datas authenticity and consistency, and so on
Marketing Trends Report Diagram Ppt Infographics
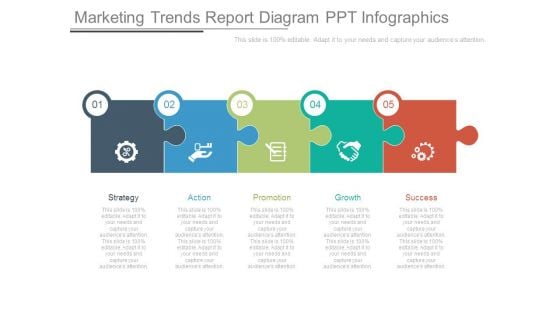
This is a marketing trends report diagram ppt infographics. This is a five stage process. The stages in this process are strategy, action, promotion, growth, success.
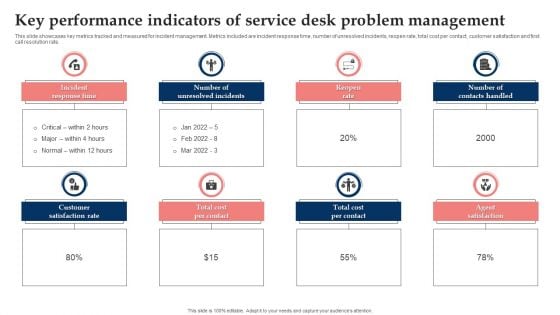
Key Performance Indicators Of Service Desk Problem Management Elements PDF
This slide showcases key metrics tracked and measured for incident management. Metrics included are incident response time, number of unresolved incidents, reopen rate, total cost per contact, customer satisfaction and first call resolution rate. Presenting Key Performance Indicators Of Service Desk Problem Management Elements PDF to dispense important information. This template comprises eight stages. It also presents valuable insights into the topics including Incident Response Time, Number Of Unresolved Incidents, Number Of Contacts Handled. This is a completely customizable PowerPoint theme that can be put to use immediately. So, download it and address the topic impactfully.
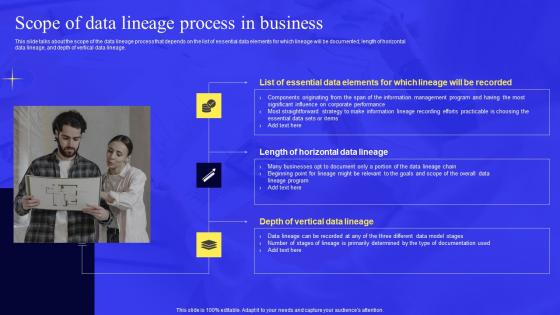
Business Process Data Lineage Scope Of Data Lineage Process In Business Guidelines Pdf
This slide talks about the scope of the data lineage process that depends on the list of essential data elements for which lineage will be documented, length of horizontal data lineage, and depth of vertical data lineage. Whether you have daily or monthly meetings, a brilliant presentation is necessary. Business Process Data Lineage Scope Of Data Lineage Process In Business Guidelines Pdf can be your best option for delivering a presentation. Represent everything in detail using Business Process Data Lineage Scope Of Data Lineage Process In Business Guidelines Pdf and make yourself stand out in meetings. The template is versatile and follows a structure that will cater to your requirements. All the templates prepared by Slidegeeks are easy to download and edit. Our research experts have taken care of the corporate themes as well. So, give it a try and see the results. This slide talks about the scope of the data lineage process that depends on the list of essential data elements for which lineage will be documented, length of horizontal data lineage, and depth of vertical data lineage.
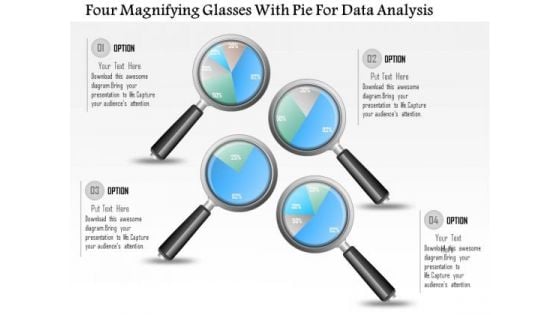
Business Diagram Four Magnifying Glasses With Pie For Data Analysis PowerPoint Slide
This business diagram displays graphic of pie charts in shape of magnifying glasses This business slide is suitable to present and compare business data. Use this diagram to build professional presentations for your viewers.
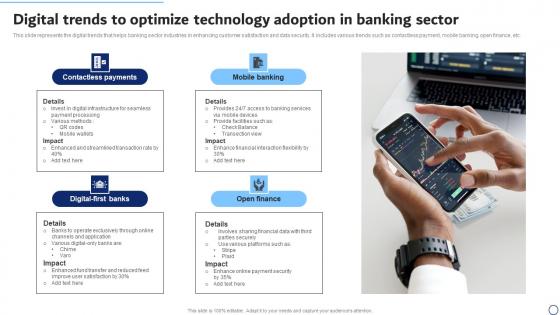
Digital Trends To Optimize Technology Adoption In Banking Sector Themes Pdf
This slide represents the digital trends that helps banking sector industries in enhancing customer satisfaction and data security. It includes various trends such as contactless payment, mobile banking, open finance, etc. Showcasing this set of slides titled Digital Trends To Optimize Technology Adoption In Banking Sector Themes Pdf. The topics addressed in these templates are Contactless Payments, Mobile Banking, Open Finance. All the content presented in this PPT design is completely editable. Download it and make adjustments in color, background, font etc. as per your unique business setting. This slide represents the digital trends that helps banking sector industries in enhancing customer satisfaction and data security. It includes various trends such as contactless payment, mobile banking, open finance, etc.
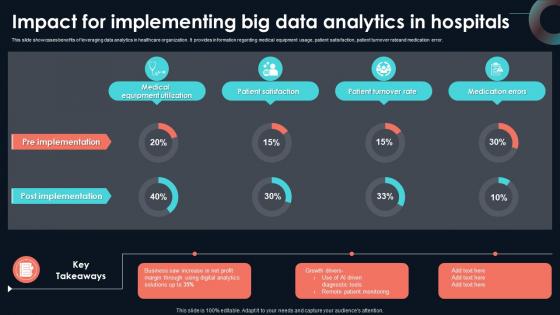
Impact For Implementing Big Data Analytics Developing Strategic Insights Using Big Data Analytics SS V
This slide showcases benefits of leveraging data analytics in healthcare organization. It provides information regarding medical equipment usage, patient satisfaction, patient turnover rateand medication error. Take your projects to the next level with our ultimate collection of Impact For Implementing Big Data Analytics Developing Strategic Insights Using Big Data Analytics SS V. Slidegeeks has designed a range of layouts that are perfect for representing task or activity duration, keeping track of all your deadlines at a glance. Tailor these designs to your exact needs and give them a truly corporate look with your own brand colors they will make your projects stand out from the rest This slide showcases benefits of leveraging data analytics in healthcare organization. It provides information regarding medical equipment usage, patient satisfaction, patient turnover rateand medication error.
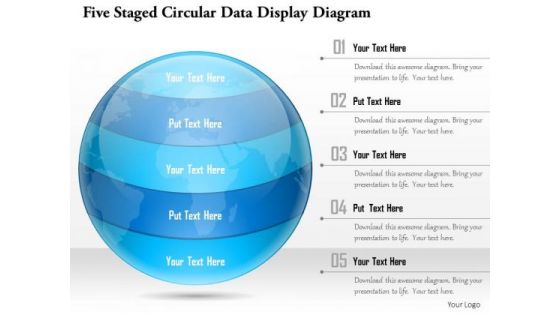
Business Diagram Five Staged Circular Data Display Diagram Presentation Template
This Power Point template slide has been crafted with graphic of five staged circular diagram. This PPT slide contains the concept of data analysis and representation. This PPT slide can be used for business data presentations.

Data Analytics For Informed Decision Making Ppt Sample

Shaping The Future With AI Pdf Word Document
This Shaping The Future With AI Pdf Word Document is designed to help you retain your audiences attention. This content-ready PowerPoint Template enables you to take your audience on a journey and share information in a way that is easier to recall. It helps you highlight the crucial parts of your work so that the audience does not get saddled with information download. This seventy three slide PPT Deck comes prepared with the graphs and charts you could need to showcase your information through visuals. You only need to enter your own data in them. Download this editable PowerPoint Theme and walk into that meeting with confidence. Our Shaping The Future With AI Pdf Word Document are topically designed to provide an attractive backdrop to any subject. Use them to look like a presentation pro.

Medical Equipments Industry Outlook Pdf Word Document
This Medical Equipments Industry Outlook Pdf Word Document is designed to help you retain your audiences attention. This content-ready PowerPoint Template enables you to take your audience on a journey and share information in a way that is easier to recall. It helps you highlight the crucial parts of your work so that the audience does not get saddled with information download. This eighty seven slide PPT Deck comes prepared with the graphs and charts you could need to showcase your information through visuals. You only need to enter your own data in them. Download this editable PowerPoint Theme and walk into that meeting with confidence. Our Medical Equipments Industry Outlook Pdf Word Document are topically designed to provide an attractive backdrop to any subject. Use them to look like a presentation pro.
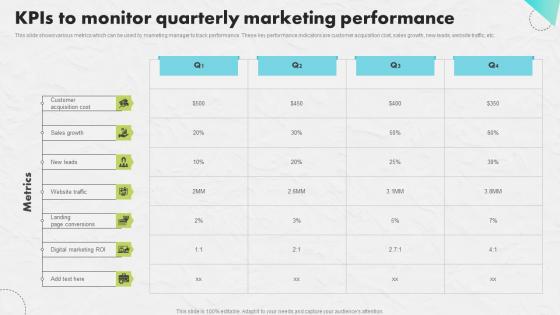
KPIs To Monitor Quarterly Developing An Impactful SEO Marketing Plan Demonstration Pdf
This slide shows various metrics which can be used by marketing manager to track performance. These key performance indicators are customer acquisition cost, sales growth, new leads, website traffic, etc. If you are looking for a format to display your unique thoughts, then the professionally designed KPIs To Monitor Quarterly Developing An Impactful SEO Marketing Plan Demonstration Pdf is the one for you. You can use it as a Google Slides template or a PowerPoint template. Incorporate impressive visuals, symbols, images, and other charts. Modify or reorganize the text boxes as you desire. Experiment with shade schemes and font pairings. Alter, share or cooperate with other people on your work. Download KPIs To Monitor Quarterly Developing An Impactful SEO Marketing Plan Demonstration Pdf and find out how to give a successful presentation. Present a perfect display to your team and make your presentation unforgettable. This slide shows various metrics which can be used by marketing manager to track performance. These key performance indicators are customer acquisition cost, sales growth, new leads, website traffic, etc.
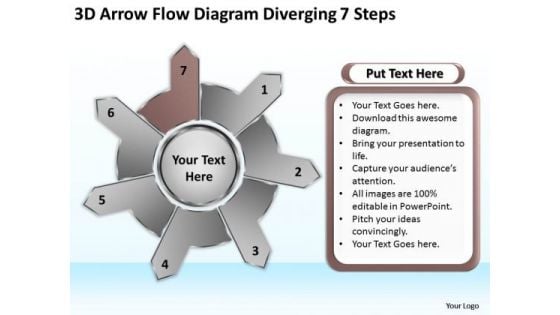
3d Arrow Flow Diagram Diverging 7 Steps Cycle Spoke Chart PowerPoint Slides
We present our 3d arrow flow diagram diverging 7 steps Cycle Spoke Chart PowerPoint Slides.Use our Process and Flows PowerPoint Templates because you have made significant headway in this field. Download our Success PowerPoint Templates because you know the path so show the way. Use our Business PowerPoint Templates because you too have got the framework of your companys growth in place. Use our Marketing PowerPoint Templates because all elements of the venture are equally critical. Download our Circle Charts PowerPoint Templates because you have the basic goal in mind.Use these PowerPoint slides for presentations relating to Abstract, arrow, art, background, ball,blue, business, button, chart, circle,circular, clip, company, concept, cycle,diagram, edit, editable, element, green,guide, icon, leader, management,marketing, model, numbers,organization, plans, point, presentation, report, representation. The prominent colors used in the PowerPoint template are Brown, Gray, Black. The feedback we get is that our 3d arrow flow diagram diverging 7 steps Cycle Spoke Chart PowerPoint Slides are Whimsical. The feedback we get is that our art PowerPoint templates and PPT Slides are Precious. Presenters tell us our 3d arrow flow diagram diverging 7 steps Cycle Spoke Chart PowerPoint Slides are Wonderful. The feedback we get is that our business PowerPoint templates and PPT Slides are Handsome. PowerPoint presentation experts tell us our 3d arrow flow diagram diverging 7 steps Cycle Spoke Chart PowerPoint Slides are Pretty. Customers tell us our business PowerPoint templates and PPT Slides are designed to make your presentations professional. Soak in the luxury our 3d Arrow Flow Diagram Diverging 7 Steps Cycle Spoke Chart PowerPoint Slides provide. They offer top class and exclusive service.

Ebitda Data Analytics Company Outline Topics PDF
This slide illustrates a graph of EBITDA for Kantar company showing growth trend in from 2021. It also showcases key insights for EBITDA highlighting estimated EBITDA for 2022 and 2023. Present like a pro with Ebitda Data Analytics Company Outline Topics PDF Create beautiful presentations together with your team, using our easy-to-use presentation slides. Share your ideas in real-time and make changes on the fly by downloading our templates. So whether you are in the office, on the go, or in a remote location, you can stay in sync with your team and present your ideas with confidence. With Slidegeeks presentation got a whole lot easier. Grab these presentations today. This slide illustrates a graph of EBITDA for Kantar company showing growth trend in from 2021. It also showcases key insights for EBITDA highlighting estimated EBITDA for 2022 and 2023
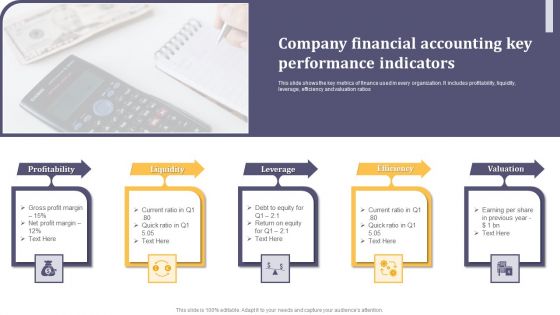
Company Financial Accounting Key Performance Indicators Ppt Slides PDF
This slide shows the key metrics of finance used in every organization. It includes profitability, liquidity, leverage, efficiency and valuation ratios. Presenting Company Financial Accounting Key Performance Indicators Ppt Slides PDF to dispense important information. This template comprises five stages. It also presents valuable insights into the topics including Profitability, Liquidity, Leverage. This is a completely customizable PowerPoint theme that can be put to use immediately. So, download it and address the topic impactfully.
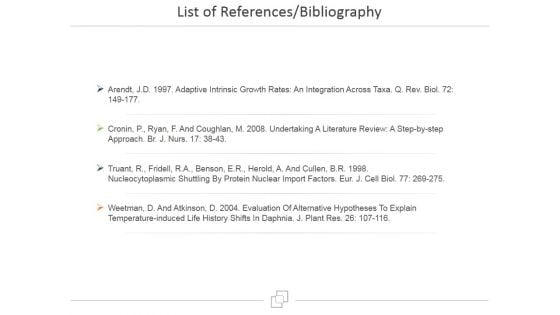
List Of References Bibliography Ppt PowerPoint Presentation Themes
This is a list of references bibliography ppt powerpoint presentation themes. This is a four stage process. The stages in this process are business, list, marketing, knowledge, information.
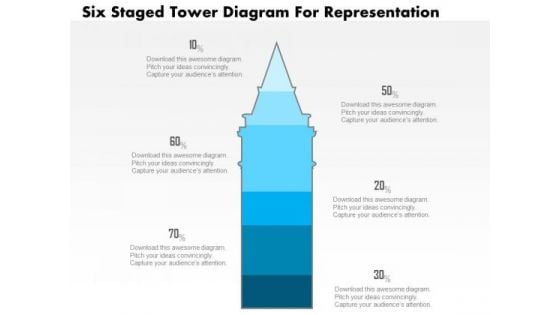
Business Diagram Five Staged Tower Diagram For Representation PowerPoint Slide
This business slide displays five staged tower diagram. It contains blue tower graphic divided into five parts. This diagram slide depicts processes, stages, steps, points, options information display. Use this diagram, in your presentations to express your views innovatively.
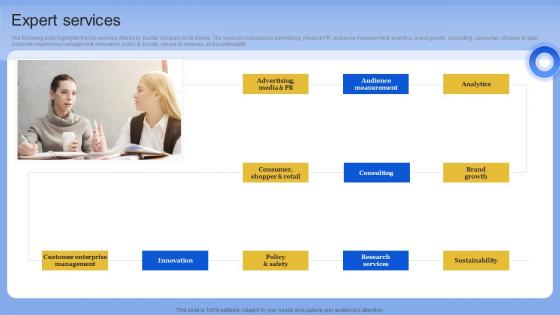
Expert Services Data Analytics Company Outline Elements PDF
The following slide highlights the top services offered by Kantar company to its clients. The services included are advertising, media and PR, audience measurement, analytics, brand growth, consulting, consumer, shopper and retail, customer experience management, innovation, policy and society, research services, and sustainability. Whether you have daily or monthly meetings, a brilliant presentation is necessary. Expert Services Data Analytics Company Outline Elements PDF can be your best option for delivering a presentation. Represent everything in detail using Expert Services Data Analytics Company Outline Elements PDF and make yourself stand out in meetings. The template is versatile and follows a structure that will cater to your requirements. All the templates prepared by Slidegeeks are easy to download and edit. Our research experts have taken care of the corporate themes as well. So, give it a try and see the results. The following slide highlights the top services offered by Kantar company to its clients. The services included are advertising, media and PR, audience measurement, analytics, brand growth, consulting, consumer, shopper and retail, customer experience management, innovation, policy and society, research services, and sustainability
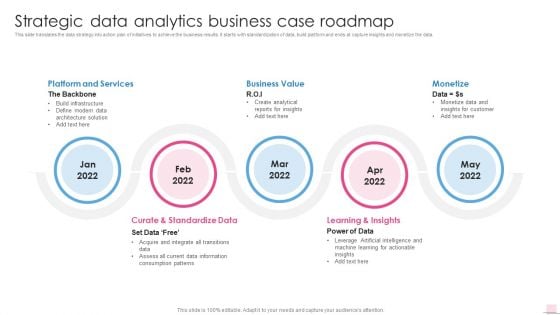
Strategic Data Analytics Business Case Roadmap Business Analysis Modification Toolkit Themes PDF
This slide translates the data strategy into action plan of initiatives to achieve the business results. It starts with standardization of data, build platform and ends at capture insights and monetize the data. This is a Strategic Data Analytics Business Case Roadmap Business Analysis Modification Toolkit Themes PDF template with various stages. Focus and dispense information on five stages using this creative set, that comes with editable features. It contains large content boxes to add your information on topics like Platform Services, Curate Standardize, Learning Insights. You can also showcase facts, figures, and other relevant content using this PPT layout. Grab it now.
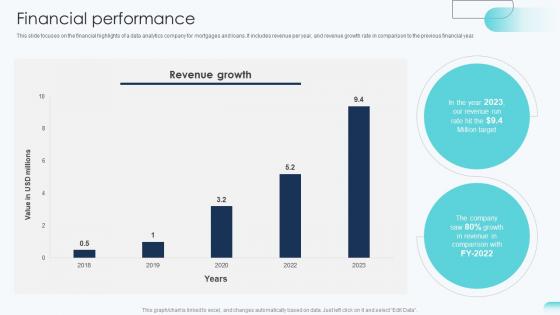
Financial Performance Big Data Analytics Investor Funding Elevator Pitch Deck
This slide focuses on the financial highlights of a data analytics company for mortgages and loans. It includes revenue per year, and revenue growth rate in comparison to the previous financial year. Present like a pro with Financial Performance Big Data Analytics Investor Funding Elevator Pitch Deck. Create beautiful presentations together with your team, using our easy-to-use presentation slides. Share your ideas in real-time and make changes on the fly by downloading our templates. So whether you are in the office, on the go, or in a remote location, you can stay in sync with your team and present your ideas with confidence. With Slidegeeks presentation got a whole lot easier. Grab these presentations today. This slide focuses on the financial highlights of a data analytics company for mortgages and loans. It includes revenue per year, and revenue growth rate in comparison to the previous financial year.
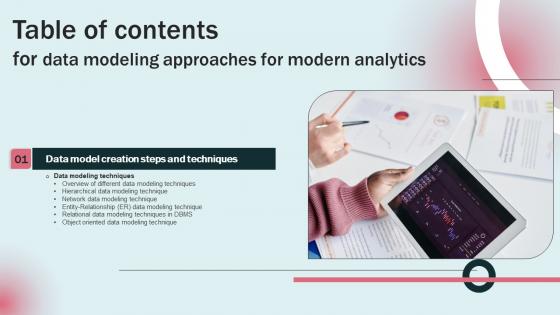
Data Modeling Approaches For Modern Analytics Table Of Contents Structure Pdf
Whether you have daily or monthly meetings, a brilliant presentation is necessary. Data Modeling Approaches For Modern Analytics Table Of Contents Structure Pdf can be your best option for delivering a presentation. Represent everything in detail using Data Modeling Approaches For Modern Analytics Table Of Contents Structure Pdf and make yourself stand out in meetings. The template is versatile and follows a structure that will cater to your requirements. All the templates prepared by Slidegeeks are easy to download and edit. Our research experts have taken care of the corporate themes as well. So, give it a try and see the results. Our Data Modeling Approaches For Modern Analytics Table Of Contents Structure Pdf are topically designed to provide an attractive backdrop to any subject. Use them to look like a presentation pro.
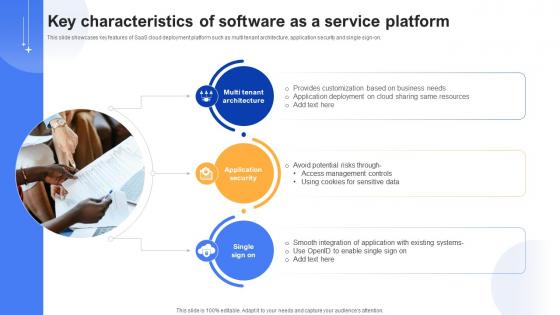
Effective Data Migration Key Characteristics Of Software As A Service Platform
This slide showcases key features of SaaS cloud deployment platform such as multi tenant architecture, application security and single sign-on. Are you searching for a Effective Data Migration Key Characteristics Of Software As A Service Platform that is uncluttered, straightforward, and original Its easy to edit, and you can change the colors to suit your personal or business branding. For a presentation that expresses how much effort you have put in, this template is ideal With all of its features, including tables, diagrams, statistics, and lists, its perfect for a business plan presentation. Make your ideas more appealing with these professional slides. Download Effective Data Migration Key Characteristics Of Software As A Service Platform from Slidegeeks today. This slide showcases key features of SaaS cloud deployment platform such as multi tenant architecture, application security and single sign-on.
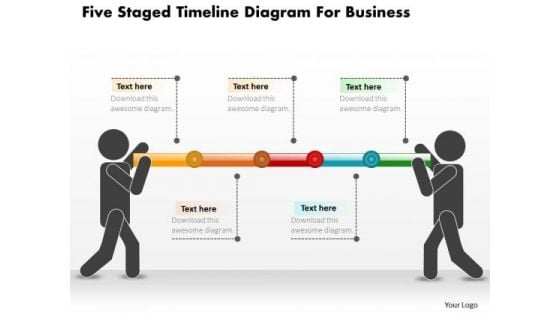
Business Diagram Five Staged Timeline Diagram For Business PowerPoint Slide
This PowerPoint template displays five points timeline diagram. This business diagram has been designed with graphic of timeline with five points, text space and start, end points. Use this diagram, in your presentations to display process steps, stages, timelines and business management. Make wonderful presentations using this business slide.
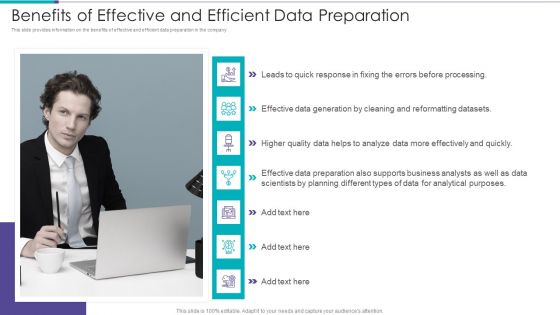
Data Preparation Infrastructure And Phases Benefits Of Effective And Efficient Data Preparation Topics PDF
This slide provides information on the benefits of effective and efficient data preparation in the company.This is a Data Preparation Infrastructure And Phases Benefits Of Effective And Efficient Data Preparation Topics PDF template with various stages. Focus and dispense information on seven stages using this creative set, that comes with editable features. It contains large content boxes to add your information on topics like Univariate Analysis, Variable Identification, Predictor Variables You can also showcase facts, figures, and other relevant content using this PPT layout. Grab it now.

Data Evaluation And Processing Toolkit Value Stream Information Data Analytics Structure Themes PDF
The slides shows the stages of data analytics with reactive and proactive approach. In includes four steps collection, analysis, predictive and actions. This modern and well-arranged Data Evaluation And Processing Toolkit Value Stream Information Data Analytics Structure Themes PDF provides lots of creative possibilities. It is very simple to customize and edit with the Powerpoint Software. Just drag and drop your pictures into the shapes. All facets of this template can be edited with Powerpoint, no extra software is necessary. Add your own material, put your images in the places assigned for them, adjust the colors, and then you can show your slides to the world, with an animated slide included.
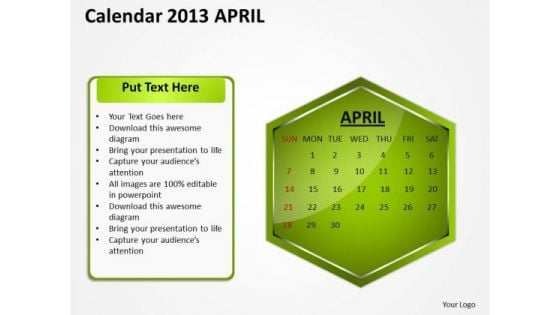
2013 April Calendar PowerPoint Slides Ppt Templates
We present our 2013 April Calendar PowerPoint Slides PPT templates.Download and present our Calendars PowerPoint Templates because strengthen your relationship with your present customers and likely future ones as the occasion has an intrinsic business potential. Download and present our New Year PowerPoint Templates because this slide imprint them on the minds of your audience via our slides. Present our Timelines PowerPoint Templates because different people with differing ideas and priorities perform together to score. Use our Targets PowerPoint Templates because this slide depicts the occasion for gifting and giving. Use our Time Planning PowerPoint Templates because your marketing strategies can funnel down to the cone, stage by stage, refining as you go along.Use these PowerPoint slides for presentations relating to 2013, Abstract, Agenda, Annual, April, Background, Book, Business, Calendar, Calendar, Content, Date, Day, Design, Desk, Diary, Document, Editable, Element, Eps10, Graphic, Green, Icon, Illustration, Layout, Monday, Month, Monthly, New, Note, Notepaper, Number, Old, Organizer, Paper, Plan, Planner. The prominent colors used in the PowerPoint template are Green, Red, Black. PowerPoint presentation experts tell us our 2013 April Calendar PowerPoint Slides PPT templates are Versatile. You can be sure our Annual PowerPoint templates and PPT Slides are Gorgeous. Presenters tell us our 2013 April Calendar PowerPoint Slides PPT templates will make the presenter look like a pro even if they are not computer savvy. We assure you our Book PowerPoint templates and PPT Slides are Graceful. Professionals tell us our 2013 April Calendar PowerPoint Slides PPT templates will get their audience's attention. The feedback we get is that our Background PowerPoint templates and PPT Slides are Attractive. Thwart problems with our 2013 April Calendar PowerPoint Slides Ppt Templates. Download without worries with our money back guaranteee.
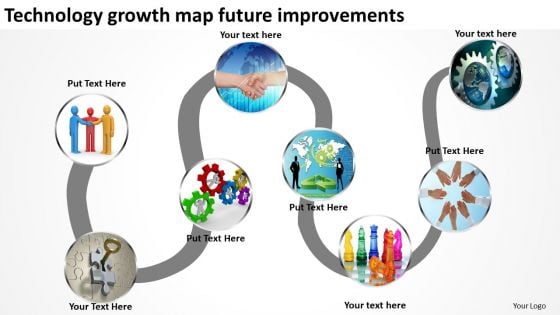
Technology Growth Map Future Improvements PowerPoint Templates Ppt Slides Graphics
We present our Technology growth map future improvements PowerPoint Templates PPT Slides Graphics.Use our Marketing PowerPoint Templates because The marketplace is the merger of your dreams and your ability. Present our Timelines PowerPoint Templates because Our PowerPoint Templates and Slides has conjured up a web of all you need with the help of our great team. Use them to string together your glistening ideas. Use our Business PowerPoint Templates because The foundation of the structure of your business is resilient and dependable. Convey this confidence to your colleagues and assure them of a great and enduring future. Use our Arrows PowerPoint Templates because if making a mark is your obsession, then let others get Obsessed with you. Download and present our Time planning PowerPoint Templates because you have the ability to think out of the box. It helps you maintain your unique identity.Use these PowerPoint slides for presentations relating to Art, Background, Button, Call, City, Colorful, Concept, Country, Destination, Editable, Flag, Fuel, Geography, Graphic, Home, Icon, Illustration, Journey, Land, Locate, Location, Macro, Map, Mapping, Mark, Navigate, Needle, Petrol, Pin, Pinpoint, Place, Pointing, Pump, Push, Pushpin, Restaurant, Road, Roadmap, Service, Set, Shiny, Space, Symbol, Town, Travel, Trip. The prominent colors used in the PowerPoint template are Red, Green, Gray. PowerPoint presentation experts tell us our Technology growth map future improvements PowerPoint Templates PPT Slides Graphics are Dynamic. Customers tell us our Call PowerPoint templates and PPT Slides are Lush. Customers tell us our Technology growth map future improvements PowerPoint Templates PPT Slides Graphics are Stunning. Customers tell us our Call PowerPoint templates and PPT Slides are visually appealing. PowerPoint presentation experts tell us our Technology growth map future improvements PowerPoint Templates PPT Slides Graphics are Second to none. People tell us our Call PowerPoint templates and PPT Slides are Efficacious. Exhibit distinguished performance with our Technology Growth Map Future Improvements PowerPoint Templates Ppt Slides Graphics. They will make you look good.
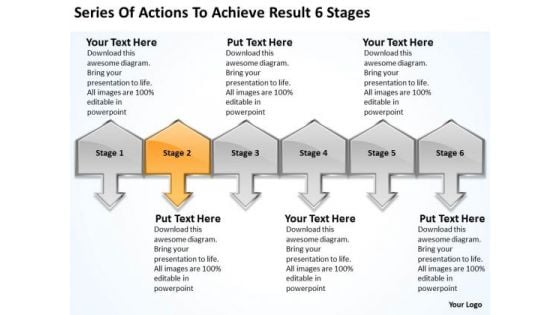
Series Of Actions To Achieve Result 6 Stages Business Plans How PowerPoint Slides
We present our series of actions to achieve result 6 stages business plans how PowerPoint Slides.Use our Communication PowerPoint Templates because you have some excellent plans to spread some more of it across your community. Download and present our Business PowerPoint Templates because you too have got the framework of your companys growth in place. Download our Arrows PowerPoint Templates because you have good reasons to back up the strength of your belief. Use our Success PowerPoint Templates because the success of your venture depends on the performance of every team member. Download and present our Symbol PowerPoint Templates because spreading the light of knowledge around you will clear the doubts and enlighten the questioning minds with your brilliance and ability.Use these PowerPoint slides for presentations relating to 3d, Achievement, Action, Aim, Arrows, Black, Business, Color, Communication, Competition, Concept, Connection, Creative, Design, Different, Direction, Element, First, Forward, Graph, Graphic, Group, Growth, Higher, Icon, Illustration, Image, Isolated, Leader, Leadership, Line, Menu, Motion, Orange, Progress, Series, Seven, Sign, Slew, Solution, Success, Swerve, Symbol, Team, Teamwork, Turn, Up. The prominent colors used in the PowerPoint template are Yellow, Gray, Black. Customers tell us our series of actions to achieve result 6 stages business plans how PowerPoint Slides are Dazzling. Use our Arrows PowerPoint templates and PPT Slides provide you with a vast range of viable options. Select the appropriate ones and just fill in your text. PowerPoint presentation experts tell us our series of actions to achieve result 6 stages business plans how PowerPoint Slides are Perfect. People tell us our Black PowerPoint templates and PPT Slides are Stunning. We assure you our series of actions to achieve result 6 stages business plans how PowerPoint Slides are Multicolored. People tell us our Color PowerPoint templates and PPT Slides are Energetic. Get your approach right with our Series Of Actions To Achieve Result 6 Stages Business Plans How PowerPoint Slides. They will make a definite difference.
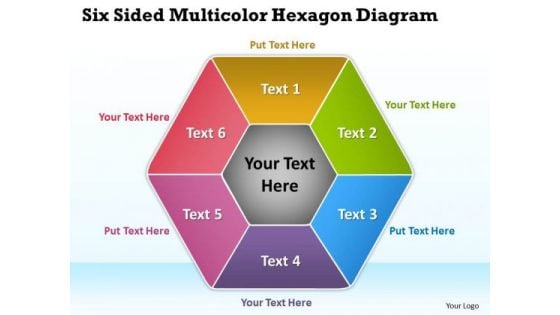
Six Sided Multicolor Hexagon Diagram Radial Process PowerPoint Templates
We present our six sided multicolor hexagon diagram Radial Process PowerPoint templates.Use our Business PowerPoint Templates because a lot of dissimilar elements needing to gel to strike the deal. Use our Marketing PowerPoint Templates because we provide the means to project your views. Use our Shapes PowerPoint Templates because getting it done may not be enough. Download our Finance PowerPoint Templates because let this slide illustrates others piggyback on you to see well over the horizon. Download our Symbol PowerPoint Templates because using our templates for your colleagues will impart knowledge to feed.Use these PowerPoint slides for presentations relating to Arrow, Background, Ball, Business, Button, Catalog, Chart, Circle, Circular, Clipart, Company, Concept, Cross, Cycle, Development, Diagram, Edit, Editable, Element, Goals, Icon, Leader, Marketing, Model, Navigation, Organization, Parts, Pie, Plans, Presentation, Report, Representation, Retro, Six, Sphere, Stakeholder, Team. The prominent colors used in the PowerPoint template are Red, Green, Blue. We assure you our six sided multicolor hexagon diagram Radial Process PowerPoint templates are Sparkling. Customers tell us our Ball PowerPoint templates and PPT Slides are designed to make your presentations professional. The feedback we get is that our six sided multicolor hexagon diagram Radial Process PowerPoint templates are Fantastic. We assure you our Circle PowerPoint templates and PPT Slides are Excellent. People tell us our six sided multicolor hexagon diagram Radial Process PowerPoint templates are designed by a team of presentation professionals. We assure you our Ball PowerPoint templates and PPT Slides are Fancy. Filter out ideas with our Six Sided Multicolor Hexagon Diagram Radial Process PowerPoint Templates. They get actionable ones to emerge.
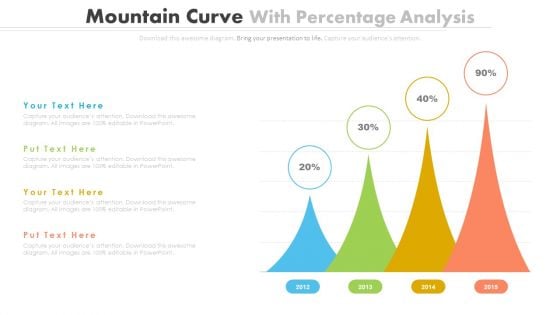
Percentage Data Growth Chart Powerpoint Slides
This PowerPoint template has been designed with percentage data growth chart. Download this PPT chart to depict financial ratio analysis. This PowerPoint slide is of great help in the business sector to make realistic presentations and provides effective way of presenting your newer thoughts.
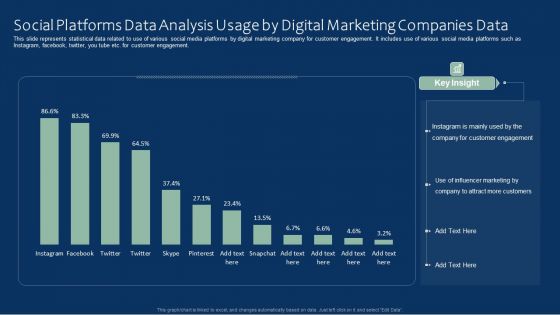
Social Platforms Data Analysis Usage By Digital Marketing Companies Data Clipart PDF
This slide represents statistical data related to use of various social media platforms by digital marketing company for customer engagement. It includes use of various social media platforms such as Instagram, facebook, twitter, you tube etc. for customer engagement. Pitch your topic with ease and precision using this Social Platforms Data Analysis Usage By Digital Marketing Companies Data Clipart PDF. This layout presents information on Social Platforms Data Analysis, Digital Marketing Companies Data. It is also available for immediate download and adjustment. So, changes can be made in the color, design, graphics or any other component to create a unique layout.
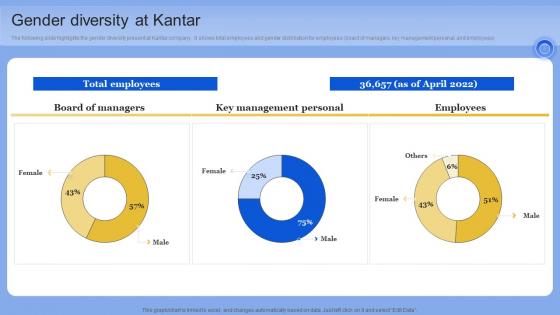
Gender Diversity At Kantar Data Analytics Company Outline Portrait PDF
The following slide highlights the gender diversity present at Kantar company. It shows total employees and gender distribution for employees board of managers, key management personal, and employees. If you are looking for a format to display your unique thoughts, then the professionally designed Gender Diversity At Kantar Data Analytics Company Outline Portrait PDF is the one for you. You can use it as a Google Slides template or a PowerPoint template. Incorporate impressive visuals, symbols, images, and other charts. Modify or reorganize the text boxes as you desire. Experiment with shade schemes and font pairings. Alter, share or cooperate with other people on your work. Download Gender Diversity At Kantar Data Analytics Company Outline Portrait PDF and find out how to give a successful presentation. Present a perfect display to your team and make your presentation unforgettable. The following slide highlights the gender diversity present at Kantar company. It shows total employees and gender distribution for employees board of managers, key management personal, and employees
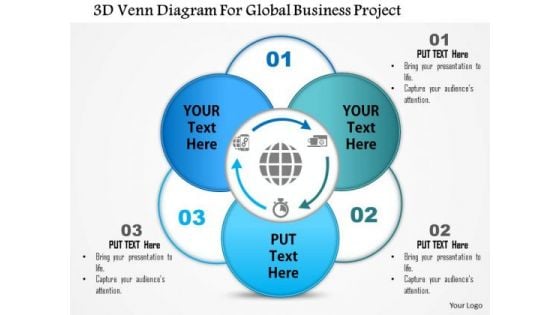
Business Diagram 3d Venn Diagram For Global Business Project Presentation Template
This business diagram displays 3d Venn diagram. This editable slide is suitable to present business reports. Use this diagram for business and finance related topics and display complete data analysis in your presentation.

Product Data Analytics Ppt PowerPoint Presentation Complete Deck With Slides
If designing a presentation takes a lot of your time and resources and you are looking for a better alternative, then this Product Data Analytics Ppt PowerPoint Presentation Complete Deck With Slides is the right fit for you. This is a prefabricated set that can help you deliver a great presentation on the topic. All the twenty slides included in this sample template can be used to present a birds eye view of the topic. These slides are also fully editable, giving you enough freedom to add specific details to make this layout more suited to your business setting. Apart from the content, all other elements like color, design, theme are also replaceable and editable. This helps in designing a variety of presentations with a single layout. Not only this, you can use this PPT design in formats like PDF, PNG, and JPG once downloaded. Therefore, without any further ado, download and utilize this sample presentation as per your liking. Our Product Data Analytics Ppt PowerPoint Presentation Complete Deck With Slides are topically designed to provide an attractive backdrop to any subject. Use them to look like a presentation pro.

Technology And Skills Matrix For Data Interpretation And Evaluation Lifecycle Phases Slides PDF
This slide covers the matrix representing technology and skills required for each phase of data analytics and assessment infrastructure lifecycle. It includes four phases of analytics infrastructure lifecycle such as ingestion, data quality and governance, data lake administration and analytics. Presenting Technology And Skills Matrix For Data Interpretation And Evaluation Lifecycle Phases Slides PDF to dispense important information. This template comprises four stages. It also presents valuable insights into the topics including Ingestion, Data Lake Administration, Data Quality And Governance. This is a completely customizable PowerPoint theme that can be put to use immediately. So, download it and address the topic impactfully.
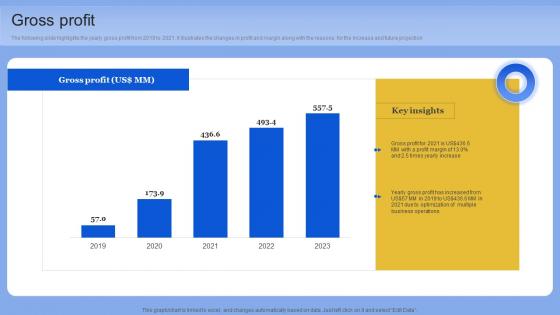
Gross Profit Data Analytics Company Outline Pictures PDF
The following slide highlights the yearly gross profit from 2019 to 2021. it illustrates the changes in profit and margin along with the reasons for the increase and future projection. Formulating a presentation can take up a lot of effort and time, so the content and message should always be the primary focus. The visuals of the PowerPoint can enhance the presenters message, so our Gross Profit Data Analytics Company Outline Pictures PDF was created to help save time. Instead of worrying about the design, the presenter can concentrate on the message while our designers work on creating the ideal templates for whatever situation is needed. Slidegeeks has experts for everything from amazing designs to valuable content, we have put everything into Gross Profit Data Analytics Company Outline Pictures PDF The following slide highlights the yearly gross profit from 2019 to 2021. it illustrates the changes in profit and margin along with the reasons for the increase and future projection
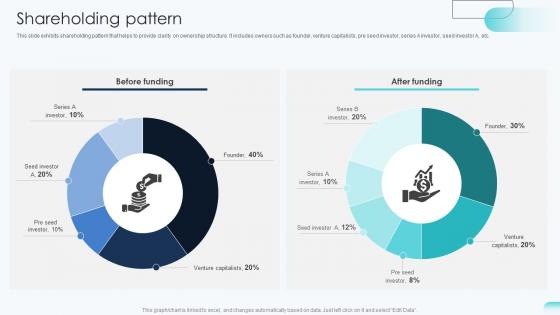
Shareholding Pattern Big Data Analytics Investor Funding Elevator Pitch Deck
This slide exhibits shareholding pattern that helps to provide clarity on ownership structure. It includes owners such as founder, venture capitalists, pre seed investor, series A investor, seed investor A, etc. This Shareholding Pattern Big Data Analytics Investor Funding Elevator Pitch Deck is perfect for any presentation, be it in front of clients or colleagues. It is a versatile and stylish solution for organizing your meetings. The Shareholding Pattern Big Data Analytics Investor Funding Elevator Pitch Deck features a modern design for your presentation meetings. The adjustable and customizable slides provide unlimited possibilities for acing up your presentation. Slidegeeks has done all the homework before launching the product for you. So, do not wait, grab the presentation templates today This slide exhibits shareholding pattern that helps to provide clarity on ownership structure. It includes owners such as founder, venture capitalists, pre seed investor, series A investor, seed investor A, etc.
Data Stewardship By Function Model For Business Data Custodianship Themes Pdf
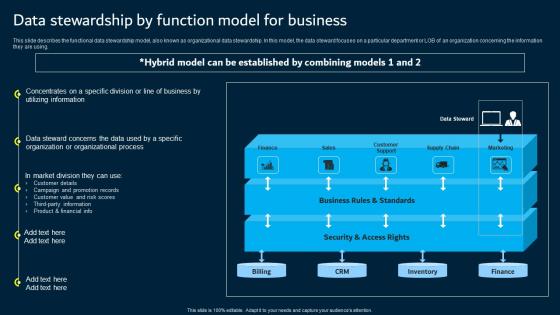
This slide describes the functional data stewardship model, also known as organizational data stewardship. In this model, the data steward focuses on a particular department or LOB of an organization concerning the information they are using. This Data Stewardship By Function Model For Business Data Custodianship Themes Pdf from Slidegeeks makes it easy to present information on your topic with precision. It provides customization options, so you can make changes to the colors, design, graphics, or any other component to create a unique layout. It is also available for immediate download, so you can begin using it right away. Slidegeeks has done good research to ensure that you have everything you need to make your presentation stand out. Make a name out there for a brilliant performance. This slide describes the functional data stewardship model, also known as organizational data stewardship. In this model, the data steward focuses on a particular department or LOB of an organization concerning the information they are using.
Data Analytics Company Outline Ppt PowerPoint Presentation Complete Deck With Slides
You will save yourself your energy and hours of time when you choose to use this impactful PowerPoint Deck. This Data Analytics Company Outline Ppt PowerPoint Presentation Complete Deck With Slides has been tailor-made to your business needs which ensures that you will always be prepared for that next meeting. Worry can not touch you when you present in your area of expertise using this PPT Template Bundle. With a modern design and easy to follow structure, this PowerPoint Presentation has Fourty five slides, which ensures that you can cover you need to without much work. Create your next presentation using this PPT Theme to deliver a memorable performance. Our Data Analytics Company Outline Ppt PowerPoint Presentation Complete Deck With Slides are topically designed to provide an attractive backdrop to any subject. Use them to look like a presentation pro.
Organisation Structure Big Data Analytics Investor Funding Elevator Pitch Deck
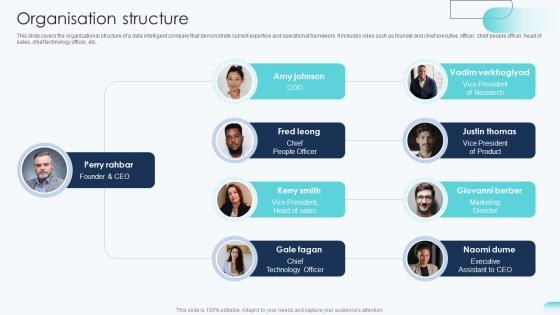
This slide covers the organizational structure of a data intelligent company that demonstrate current expertise and operational framework. It includes roles such as founder and chief executive officer, chief people officer, head of sales, chief technology officer, etc. Crafting an eye-catching presentation has never been more straightforward. Let your presentation shine with this tasteful yet straightforward Organisation Structure Big Data Analytics Investor Funding Elevator Pitch Deck template. It offers a minimalistic and classy look that is great for making a statement. The colors have been employed intelligently to add a bit of playfulness while still remaining professional. Construct the ideal Organisation Structure Big Data Analytics Investor Funding Elevator Pitch Deck that effortlessly grabs the attention of your audience Begin now and be certain to wow your customers This slide covers the organizational structure of a data intelligent company that demonstrate current expertise and operational framework. It includes roles such as founder and chief executive officer, chief people officer, head of sales, chief technology officer, etc.
Operational Profit Data Analytics Company Outline Pictures PDF
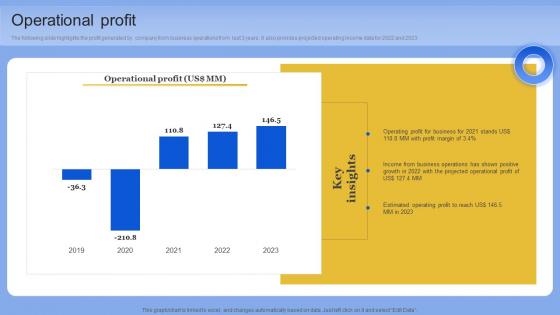
The following slide highlights the profit generated by company from business operations from last 3 years. It also provides projected operating income data for 2022 and 2023. Slidegeeks has constructed Operational Profit Data Analytics Company Outline Pictures PDF after conducting extensive research and examination. These presentation templates are constantly being generated and modified based on user preferences and critiques from editors. Here, you will find the most attractive templates for a range of purposes while taking into account ratings and remarks from users regarding the content. This is an excellent jumping-off point to explore our content and will give new users an insight into our top-notch PowerPoint Templates. The following slide highlights the profit generated by company from business operations from last 3 years. It also provides projected operating income data for 2022 and 2023
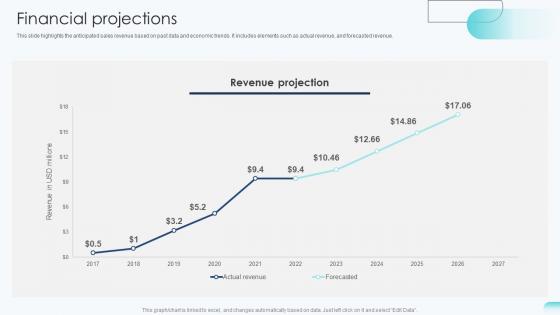
Financial Projections Big Data Analytics Investor Funding Elevator Pitch Deck
This slide highlights the anticipated sales revenue based on past data and economic trends. It includes elements such as actual revenue, and forecasted revenue. Slidegeeks is here to make your presentations a breeze with Financial Projections Big Data Analytics Investor Funding Elevator Pitch Deck With our easy-to-use and customizable templates, you can focus on delivering your ideas rather than worrying about formatting. With a variety of designs to choose from, you are sure to find one that suits your needs. And with animations and unique photos, illustrations, and fonts, you can make your presentation pop. So whether you are giving a sales pitch or presenting to the board, make sure to check out Slidegeeks first This slide highlights the anticipated sales revenue based on past data and economic trends. It includes elements such as actual revenue, and forecasted revenue.

Stock Photo Ball With Big Data Text For Data Protection Concept PowerPoint Slide
Graphic of ball with big data text has been used to craft this power point template. This image template contains the concept of data protection. Use this image for data security related topics in any presentation.
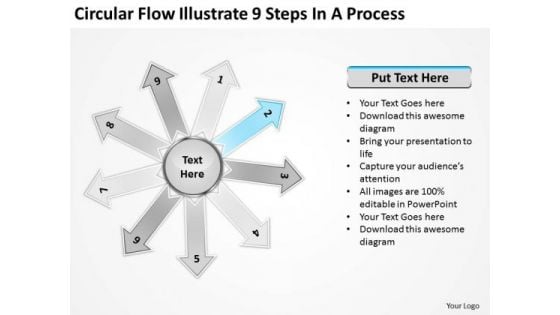
Circular Flow Illustrate 9 Steps In Process Layout Diagram PowerPoint Slides
We present our circular flow illustrate 9 steps in process Layout Diagram PowerPoint Slides.Download our Process and flows PowerPoint Templates because they are Gauranteed to focus the minds of your team. Download our Business PowerPoint Templates because your ideas too are pinpointedly focused on you goals. Download our Marketing PowerPoint Templates because networking is an imperative in todays world. You need to access the views of others. Similarly you need to give access to them of your abilities. Download our Flow charts PowerPoint Templates because it is in your DNA to analyse possible causes to the minutest detail. Present our Arrows PowerPoint Templates because you have the ideas and plans on how to achieve success.Use these PowerPoint slides for presentations relating to Circle, circular, circulation, clipart, colorful, connection, continuity, cut, cycle, cyclic, diagram, direction, flow, graph, icon, illustration, isolated, presentation, process, progress, reason, recycle, recycling, repetition, report, result, ring, rotation, round, scheme, section, step, sticker, symbol, arrows , flow charts. The prominent colors used in the PowerPoint template are Blue light, Black, White. People tell us our circular flow illustrate 9 steps in process Layout Diagram PowerPoint Slides are Upbeat. We assure you our clipart PowerPoint templates and PPT Slides are Tranquil. PowerPoint presentation experts tell us our circular flow illustrate 9 steps in process Layout Diagram PowerPoint Slides are Whimsical. You can be sure our cut PowerPoint templates and PPT Slides are Lush. Professionals tell us our circular flow illustrate 9 steps in process Layout Diagram PowerPoint Slides provide you with a vast range of viable options. Select the appropriate ones and just fill in your text. Use our continuity PowerPoint templates and PPT Slides are Quaint. Claim your prize with our Circular Flow Illustrate 9 Steps In Process Layout Diagram PowerPoint Slides. You will come out on top.
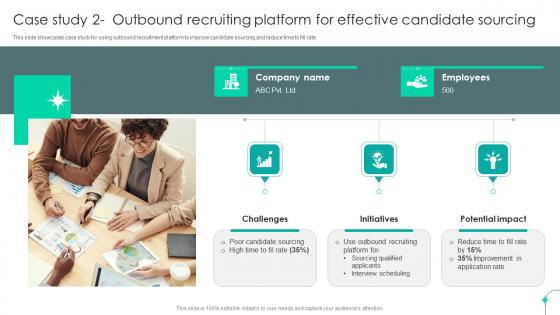
Strategic Staffing Using Data Case Study 2 Outbound Recruiting Platform For Effective CRP DK SS V
This slide showcases case study for using outbound recruitment platform to improve candidate sourcing and reduce time to fill rate. Whether you have daily or monthly meetings, a brilliant presentation is necessary. Strategic Staffing Using Data Case Study 2 Outbound Recruiting Platform For Effective CRP DK SS V can be your best option for delivering a presentation. Represent everything in detail using Strategic Staffing Using Data Case Study 2 Outbound Recruiting Platform For Effective CRP DK SS V and make yourself stand out in meetings. The template is versatile and follows a structure that will cater to your requirements. All the templates prepared by Slidegeeks are easy to download and edit. Our research experts have taken care of the corporate themes as well. So, give it a try and see the results. This slide showcases case study for using outbound recruitment platform to improve candidate sourcing and reduce time to fill rate.
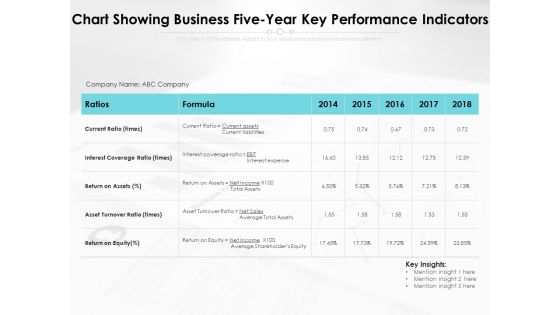
Chart Showing Business Five Year Key Performance Indicators Ppt PowerPoint Presentation File Infographics PDF
Presenting this set of slides with name chart showing business five year key performance indicators ppt powerpoint presentation file infographics pdf. The topics discussed in these slides are liabilities, equity, assets. This is a completely editable PowerPoint presentation and is available for immediate download. Download now and impress your audience.
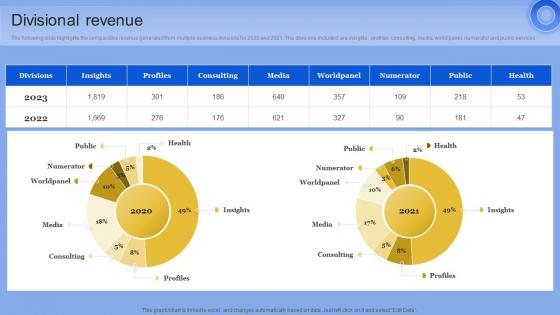
Divisional Revenue Data Analytics Company Outline Pictures PDF
The following slide highlights the comparative revenue generated from multiple business divisions for 2020 and 2021. The divisions included are insights, profiles, consulting, media, world panel, numerator and public services From laying roadmaps to briefing everything in detail, our templates are perfect for you. You can set the stage with your presentation slides. All you have to do is download these easy-to-edit and customizable templates. Divisional Revenue Data Analytics Company Outline Pictures PDF will help you deliver an outstanding performance that everyone would remember and praise you for. Do download this presentation today. The following slide highlights the comparative revenue generated from multiple business divisions for 2020 and 2021. The divisions included are insights, profiles, consulting, media, world panel, numerator and public services
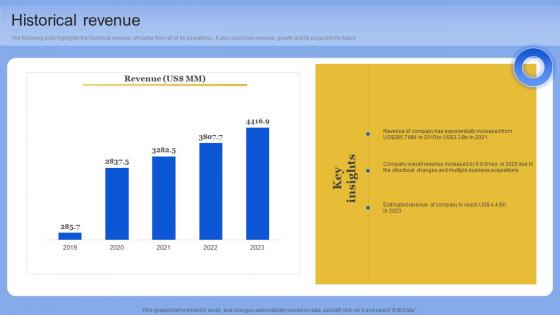
Historical Revenue Data Analytics Company Outline Information PDF
The following slide highlights the historical revenue of Kantar from all of its operations. It also describes revenue growth and its projection for future. This modern and well-arranged Historical Revenue Data Analytics Company Outline Information PDF provides lots of creative possibilities. It is very simple to customize and edit with the Powerpoint Software. Just drag and drop your pictures into the shapes. All facets of this template can be edited with Powerpoint, no extra software is necessary. Add your own material, put your images in the places assigned for them, adjust the colors, and then you can show your slides to the world, with an animated slide included. The following slide highlights the historical revenue of Kantar from all of its operations. It also describes revenue growth and its projection for future
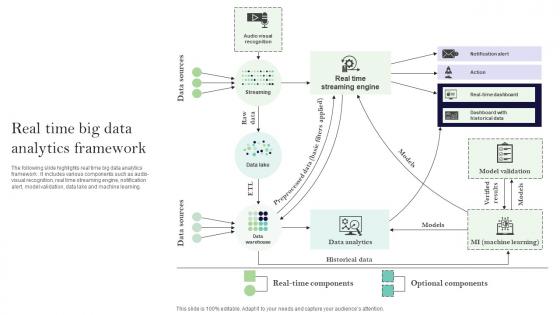
Real Time Big Data Analytics Framework Ppt Ideas Designs Download Pdf
The following slide highlights real time big data analytics framework. It includes various components such as audio-visual recognition, real time streaming engine, notification alert, model validation, data lake and machine learning. Pitch your topic with ease and precision using this Real Time Big Data Analytics Framework Ppt Ideas Designs Download Pdf. This layout presents information on Notification Alert, Model Validation, Data Lake. It is also available for immediate download and adjustment. So, changes can be made in the color, design, graphics or any other component to create a unique layout. The following slide highlights real time big data analytics framework. It includes various components such as audio-visual recognition, real time streaming engine, notification alert, model validation, data lake and machine learning.
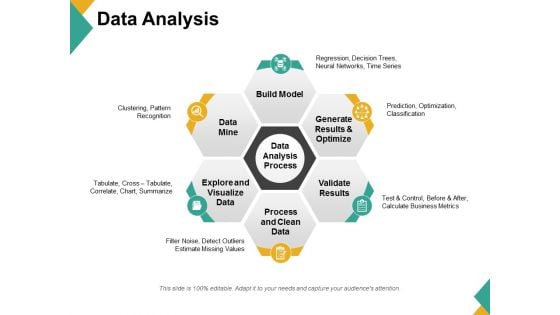
Data Analysis Ppt PowerPoint Presentation Visual Aids Diagrams
This is a data analysis ppt powerpoint presentation visual aids diagrams. This is a six stage process. The stages in this process are build model, generate results and optimize, validate results, process and clean data, explore and visualize data, data mine.
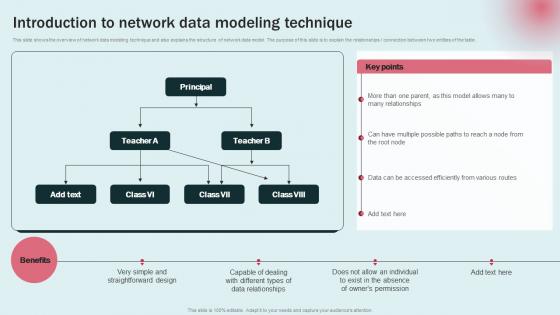
Data Modeling Approaches For Modern Analytics Introduction To Network Data Modeling Graphics Pdf
This slide shows the overview of network data modeling technique and also explains the structure of network data model. The purpose of this slide is to explain the relationships connection between two entities of the table. Slidegeeks is here to make your presentations a breeze with Data Modeling Approaches For Modern Analytics Introduction To Network Data Modeling Graphics Pdf With our easy to use and customizable templates, you can focus on delivering your ideas rather than worrying about formatting. With a variety of designs to choose from, you are sure to find one that suits your needs. And with animations and unique photos, illustrations, and fonts, you can make your presentation pop. So whether you are giving a sales pitch or presenting to the board, make sure to check out Slidegeeks first This slide shows the overview of network data modeling technique and also explains the structure of network data model. The purpose of this slide is to explain the relationships connection between two entities of the table.
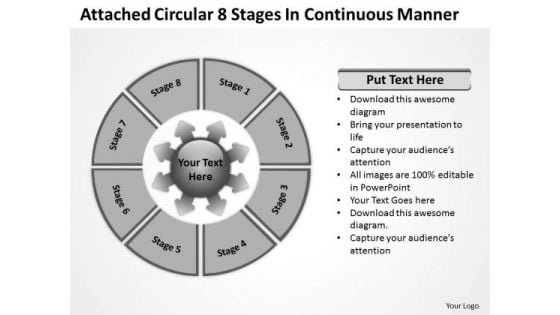
Circular 8 Stages In Continuous Manner Relative Cycle Arrow Chart PowerPoint Templates
We present our circular 8 stages in continuous manner Relative Cycle Arrow Chart PowerPoint templates.Download and present our Process and flows PowerPoint Templates because it helps to anticipate the doubts and questions in the minds of your colleagues and enlighten them with your inspired strategy to garner desired success. Download and present our Business PowerPoint Templates because the fruits of your labour are beginning to show.Enlighten them on the great plans you have for their enjoyment. Download and present our Marketing PowerPoint Templates because you can Highlight the key components of your entire manufacturing/ business process. Download our Flow charts PowerPoint Templates because they are Gauranteed to focus the minds of your team. Use our Arrows PowerPoint Templates because you understand the ailment and how to fight it.Use these PowerPoint slides for presentations relating to Circle, circular, circulation, clipart, colorful, connection, continuity, cut, cycle, cyclic, diagram, direction, empty, flow, graph, green, icon, illustration, isolated, loop, motion, pink, presentation, process, progress, reason, recycle, recycling, repetition, report, result, ring, rotation, round, scheme, section, step, sticker, symbol, arrows , flow charts. The prominent colors used in the PowerPoint template are Yellow, Black, White. People tell us our circular 8 stages in continuous manner Relative Cycle Arrow Chart PowerPoint templates are Spectacular. We assure you our continuity PowerPoint templates and PPT Slides are Tasteful. PowerPoint presentation experts tell us our circular 8 stages in continuous manner Relative Cycle Arrow Chart PowerPoint templates are Vintage. You can be sure our continuity PowerPoint templates and PPT Slides are aesthetically designed to attract attention. We guarantee that they will grab all the eyeballs you need. Professionals tell us our circular 8 stages in continuous manner Relative Cycle Arrow Chart PowerPoint templates are second to none. Use our cut PowerPoint templates and PPT Slides are Awesome. Our Circular 8 Stages In Continuous Manner Relative Cycle Arrow Chart PowerPoint Templates are fairly broadbased. They give you ample scope to address your mind.
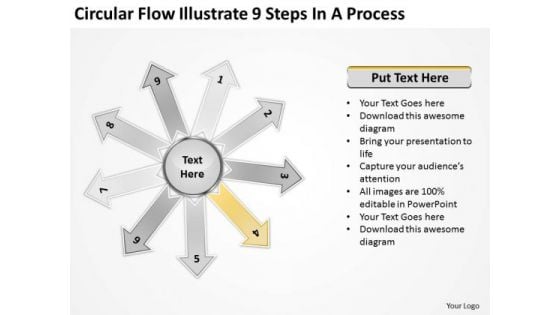
Circular Flow Illustrate 9 Steps In Process Cycle Chart PowerPoint Templates
We present our circular flow illustrate 9 steps in process Cycle Chart PowerPoint templates.Download our Process and flows PowerPoint Templates because it depicts Rolling along while gathering profits along the way is the aim. Download our Business PowerPoint Templates because this layout helps you to bring some important aspects of your business process to the notice of all concerned. Streamline the flow of information across the board. Download and present our Marketing PowerPoint Templates because you have the product you are very confident of and are very sure it will prove immensely popular with clients all over your target areas. Present our Flow charts PowerPoint Templates because they are Designed to attract the attention of your audience. Download and present our Arrows PowerPoint Templates because you have the entire picture in mind.Use these PowerPoint slides for presentations relating to Circle, circular, circulation, clipart, colorful, connection, continuity, cycle, cyclic, diagram, direction, flow, graph, icon, illustration, isolated, loop, motion, pink, presentation, process, progress, reason, recycle, recycling, repetition, report, result, ring, rotation, round, scheme, section, step,symbol, arrows , flow charts. The prominent colors used in the PowerPoint template are Yellow, Black, White. People tell us our circular flow illustrate 9 steps in process Cycle Chart PowerPoint templates are Cheerful. We assure you our colorful PowerPoint templates and PPT Slides are Festive. PowerPoint presentation experts tell us our circular flow illustrate 9 steps in process Cycle Chart PowerPoint templates are Colorful. You can be sure our colorful PowerPoint templates and PPT Slides are Zippy. Professionals tell us our circular flow illustrate 9 steps in process Cycle Chart PowerPoint templates are Bright. Use our cyclic PowerPoint templates and PPT Slides are Excellent. Emit energy with our Circular Flow Illustrate 9 Steps In Process Cycle Chart PowerPoint Templates. Bowl them over with your enthusiasm.
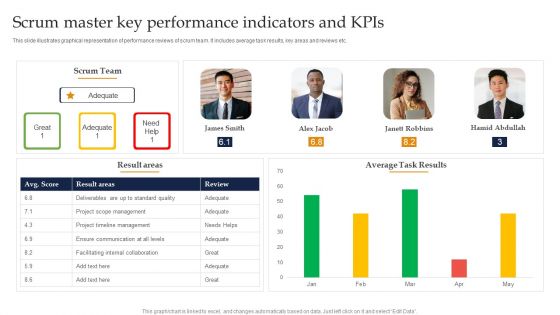
Scrum Master Key Performance Indicators And Kpis Ppt Gallery Files PDF
This slide illustrates graphical representation of performance reviews of scrum team. It includes average task results, key areas and reviews etc. Showcasing this set of slides titled Scrum Master Key Performance Indicators And Kpis Ppt Gallery Files PDF. The topics addressed in these templates are Scrum Team, Average Task Results, Project Timeline Management. All the content presented in this PPT design is completely editable. Download it and make adjustments in color, background, font etc. as per your unique business setting.

 Home
Home