Dashboard Icon
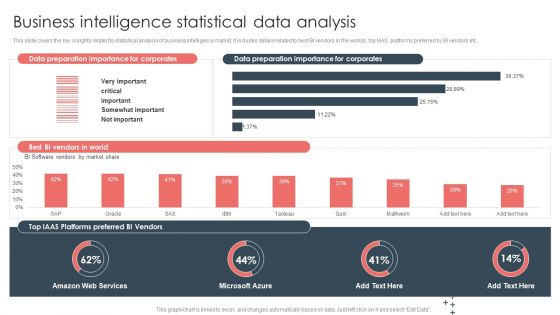
Overview Of BI For Enhanced Decision Making Business Intelligence Statistical Data Analysis Guidelines PDF
This slide covers the key insights related to statistical analysis of business intelligence market. It includes details related to best BI vendors in the worlds, top IAAS platforms preferred by BI vendors etc. There are so many reasons you need a Overview Of BI For Enhanced Decision Making Business Intelligence Statistical Data Analysis Guidelines PDF. The first reason is you cannot spend time making everything from scratch, Thus, Slidegeeks has made presentation templates for you too. You can easily download these templates from our website easily.
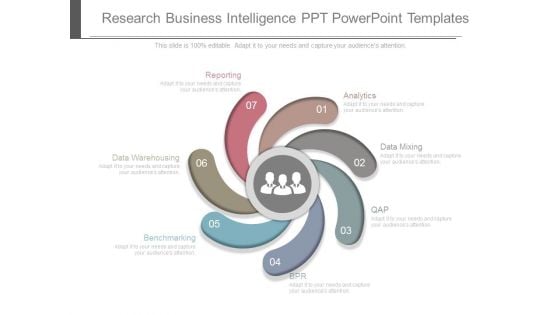
Research Business Intelligence Ppt Powerpoint Templates
This is a research business intelligence ppt powerpoint templates. This is a seven stage process. The stages in this process are data warehousing, reporting, analytics, datamining, qap, epr, benchmarking.
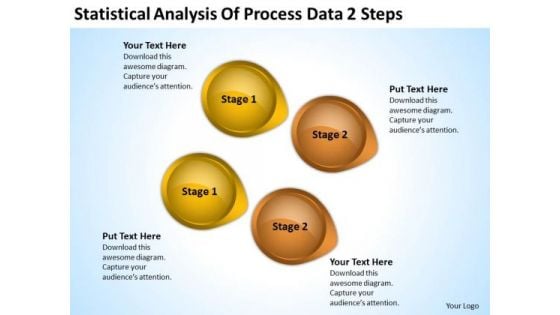
Power Point Arrows Statistical Analysis Of Process Data 2 Steps PowerPoint Templates
We present our power point arrows statistical analysis of process data 2 steps PowerPoint templates.Download and present our Business PowerPoint Templates because It is Aesthetically crafted by artistic young minds. Our PowerPoint Templates and Slides are designed to display your dexterity. Present our Arrows PowerPoint Templates because You can Rise to the occasion with our PowerPoint Templates and Slides. You will bring your audience on their feet in no time. Download and present our Circle Charts PowerPoint Templates because Our PowerPoint Templates and Slides help you pinpoint your timelines. Highlight the reasons for your deadlines with their use. Present our Shapes PowerPoint Templates because You aspire to touch the sky with glory. Let our PowerPoint Templates and Slides provide the fuel for your ascent. Present our Symbol PowerPoint Templates because You have gained great respect for your brilliant ideas. Use our PowerPoint Templates and Slides to strengthen and enhance your reputation.Use these PowerPoint slides for presentations relating to abstract, arrow, art, background, banner, blue, bright, business, circle, color, colorful, concept, conceptual, connection, creative, cycle, design, different, element, empty, flower, form, frame, graphic, green, group, idea, illustration, match, message, order, part, petal, piece, place, red, ring, shape, solution, special, speech, strategy, symbol, template, text, usable, vector, web, website. The prominent colors used in the PowerPoint template are Yellow, Brown, Black. People tell us our power point arrows statistical analysis of process data 2 steps PowerPoint templates will impress their bosses and teams. People tell us our circle PowerPoint templates and PPT Slides are designed by professionals Presenters tell us our power point arrows statistical analysis of process data 2 steps PowerPoint templates are second to none. We assure you our banner PowerPoint templates and PPT Slides will make the presenter successul in his career/life. Presenters tell us our power point arrows statistical analysis of process data 2 steps PowerPoint templates will help you be quick off the draw. Just enter your specific text and see your points hit home. Professionals tell us our background PowerPoint templates and PPT Slides will make the presenter look like a pro even if they are not computer savvy. File it down with our Power Point Arrows Statistical Analysis Of Process Data 2 Steps PowerPoint Templates. Get your thoughts into the shape you desire.
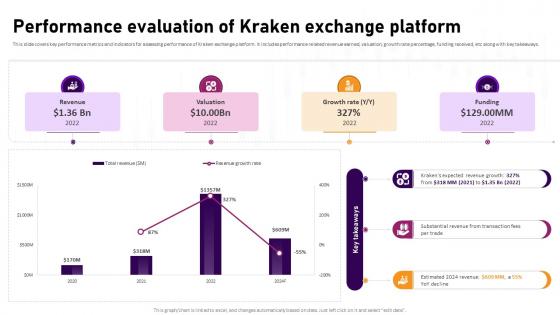
Performance Evaluation Of Kraken Exchange Platform Complete Roadmap To Blockchain BCT SS V
This slide covers key performance metrics and indicators for assessing performance of Kraken exchange platform. It includes performance related revenue earned, valuation, growth rate percentage, funding received, etc along with key takeaways. Find highly impressive Performance Evaluation Of Kraken Exchange Platform Complete Roadmap To Blockchain BCT SS V on Slidegeeks to deliver a meaningful presentation. You can save an ample amount of time using these presentation templates. No need to worry to prepare everything from scratch because Slidegeeks experts have already done a huge research and work for you. You need to download Performance Evaluation Of Kraken Exchange Platform Complete Roadmap To Blockchain BCT SS V for your upcoming presentation. All the presentation templates are 100 percent editable and you can change the color and personalize the content accordingly. Download now This slide covers key performance metrics and indicators for assessing performance of Kraken exchange platform. It includes performance related revenue earned, valuation, growth rate percentage, funding received, etc along with key takeaways.
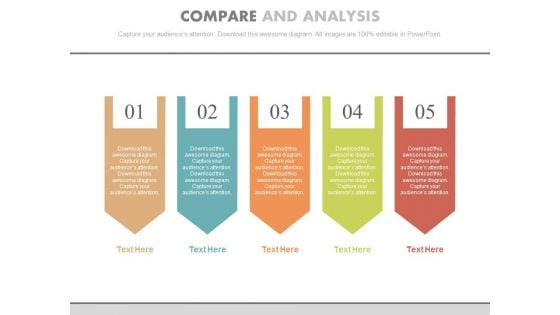
Five Steps For Data Compare And Analysis Powerpoint Template
Our above slide contains graphics of five steps chart. This PowerPoint template is useful for data compare and analysis. Use this diagram to impart more clarity to subject and to create more sound impact on viewers.
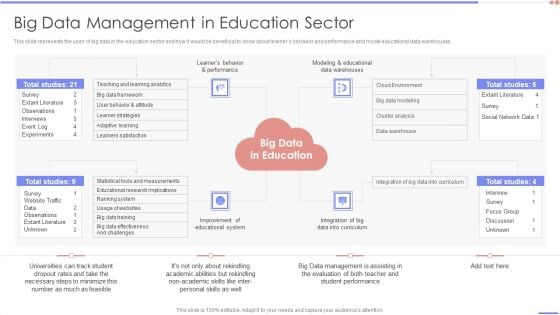
Data Analytics Management Big Data Management In Education Sector Diagrams PDF
This slide represents the uses of big data in the education sector and how it would be beneficial to know about learners behavior and performance and model educational data warehouses.This is a Data Analytics Management Big Data Management In Education Sector Diagrams PDF template with various stages. Focus and dispense information on four stages using this creative set, that comes with editable features. It contains large content boxes to add your information on topics like Extant Literature, Observations, Experiments . You can also showcase facts, figures, and other relevant content using this PPT layout. Grab it now.
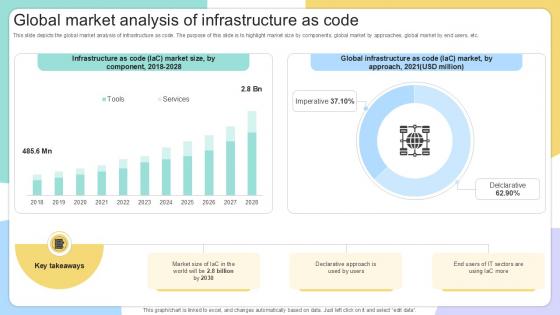
Global Market Analysis Of Infrastructure IAC Tools For Performance Analysis PPT Presentation
This slide depicts the global market analysis of infrastructure as code. The purpose of this slide is to highlight market size by components, global market by approaches, global market by end users, etc. The Global Market Analysis Of Infrastructure IAC Tools For Performance Analysis PPT Presentation is a compilation of the most recent design trends as a series of slides. It is suitable for any subject or industry presentation, containing attractive visuals and photo spots for businesses to clearly express their messages. This template contains a variety of slides for the user to input data, such as structures to contrast two elements, bullet points, and slides for written information. Slidegeeks is prepared to create an impression. This slide depicts the global market analysis of infrastructure as code. The purpose of this slide is to highlight market size by components, global market by approaches, global market by end users, etc.
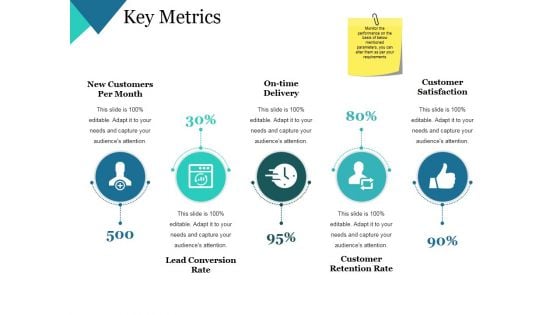
Key Metrics Ppt PowerPoint Presentation Themes
This is a key metrics ppt powerpoint presentation themes. This is a five stage process. The stages in this process are new customers per month, on time delivery, customer satisfaction, customer retention rate, lead conversion rate.
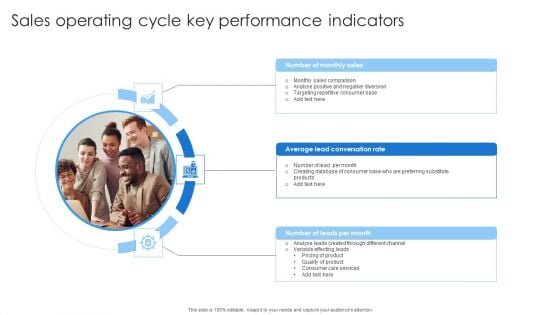
Sales Operating Cycle Key Performance Indicators Professional PDF
Presenting Sales Operating Cycle Key Performance Indicators Professional PDF to dispense important information. This template comprises three stages. It also presents valuable insights into the topics including Sales Comparison, Lead Conversation, Quality Product. This is a completely customizable PowerPoint theme that can be put to use immediately. So, download it and address the topic impactfully.
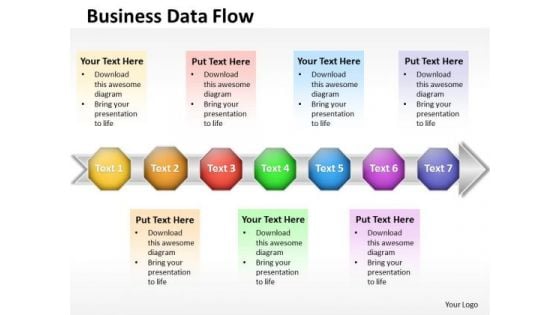
Ppt 7 Stages Self Concept PowerPoint Presentation Download Data Flow Diagram Templates
PPT 7 stages self concept powerpoint presentation download data flow diagram Templates-Use this 3D PowerPoint Diagram to describe seven stages of Linear Process through text boxes on Arrow. PowerPoint text boxes diagram templates are designed to help you place your text in a professional layout.-PPT 7 stages self concept powerpoint presentation download data flow diagram Templates-Achievement, Actualization, Basic, Belonging, Blue, Chart, Confidence, Diagram, Elements, Essential, Fundamental, Glossy, Goals, Gradient, Health, Hierarchical, Hierarchy, Human, Illustration, Isolated, Layer, Level, Love, Morality, Motivation, Needs, Person, Psychological, Psychology, Pyramid Inform teams with our Ppt 7 Stages Self Concept PowerPoint Presentation Download Data Flow Diagram Templates. Download without worries with our money back guaranteee.
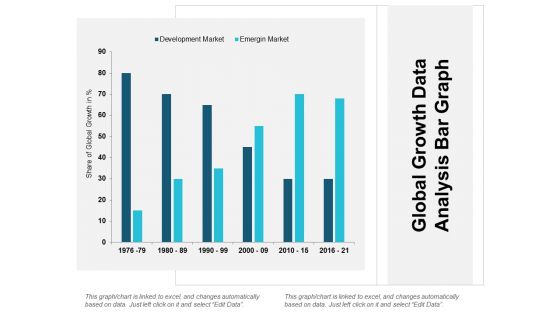
Global Growth Data Analysis Bar Graph Ppt Powerpoint Presentation Infographic Template Outfit
This is a global growth data analysis bar graph ppt powerpoint presentation infographic template outfit. The topics discussed in this diagram are market growth, market opportunity, market profitability. This is a completely editable PowerPoint presentation, and is available for immediate download.
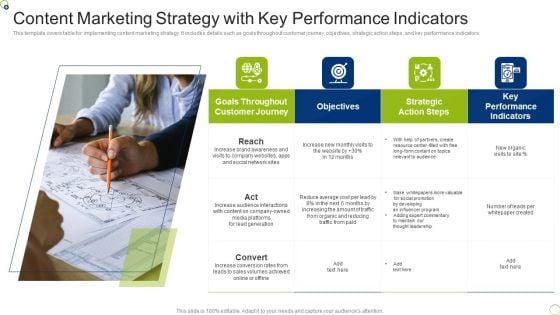
Content Marketing Strategy With Key Performance Indicators Microsoft PDF
This template covers table for implementing content marketing strategy. It includes details such as goals throughout customer journey, objectives, strategic action steps, and key performance indicators. Presenting Content Marketing Strategy With Key Performance Indicators Microsoft PDF to dispense important information. This template comprises four stages. It also presents valuable insights into the topics including Resource, Strategic, Cost. This is a completely customizable PowerPoint theme that can be put to use immediately. So, download it and address the topic impactfully.
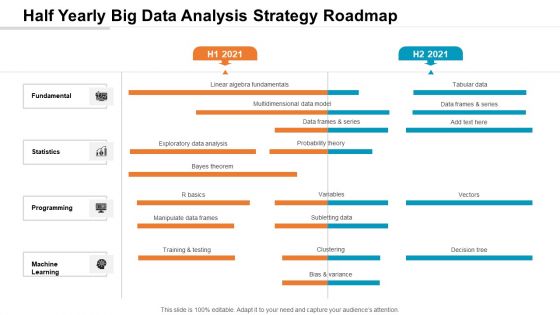
Half Yearly Big Data Analysis Strategy Roadmap Infographics
We present our half yearly big data analysis strategy roadmap infographics. This PowerPoint layout is easy-to-edit so you can change the font size, font type, color, and shape conveniently. In addition to this, the PowerPoint layout is Google Slides compatible, so you can share it with your audience and give them access to edit it. Therefore, download and save this well-researched half yearly big data analysis strategy roadmap infographics in different formats like PDF, PNG, and JPG to smoothly execute your business plan.
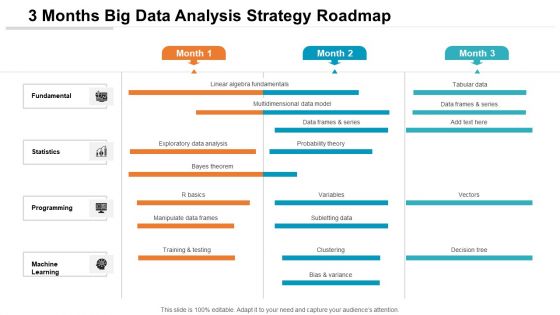
3 Months Big Data Analysis Strategy Roadmap Sample
We present our 3 months big data analysis strategy roadmap sample. This PowerPoint layout is easy-to-edit so you can change the font size, font type, color, and shape conveniently. In addition to this, the PowerPoint layout is Google Slides compatible, so you can share it with your audience and give them access to edit it. Therefore, download and save this well-researched 3 months big data analysis strategy roadmap sample in different formats like PDF, PNG, and JPG to smoothly execute your business plan.
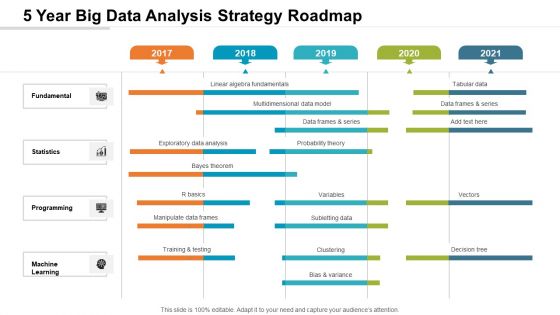
5 Year Big Data Analysis Strategy Roadmap Brochure
We present our 5 year big data analysis strategy roadmap brochure. This PowerPoint layout is easy-to-edit so you can change the font size, font type, color, and shape conveniently. In addition to this, the PowerPoint layout is Google Slides compatible, so you can share it with your audience and give them access to edit it. Therefore, download and save this well-researched 5 year big data analysis strategy roadmap brochure in different formats like PDF, PNG, and JPG to smoothly execute your business plan.
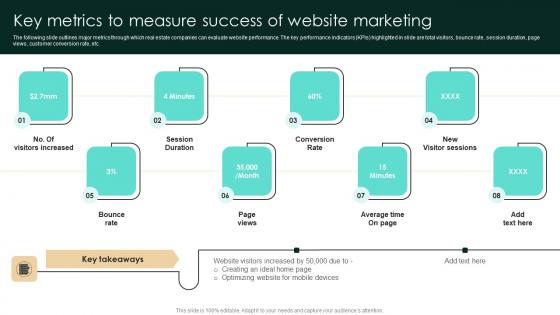
Key Metrics To Measure Success Of Website Marketing Strategic Real Estate Themes Pdf
The following slide outlines major metrics through which real estate companies can evaluate website performance. The key performance indicators KPIs highlighted in slide are total visitors, bounce rate, session duration, page views, customer conversion rate, etc. Presenting this PowerPoint presentation, titled Key Metrics To Measure Success Of Website Marketing Strategic Real Estate Themes Pdf with topics curated by our researchers after extensive research. This editable presentation is available for immediate download and provides attractive features when used. Download now and captivate your audience. Presenting this Key Metrics To Measure Success Of Website Marketing Strategic Real Estate Themes Pdf Our researchers have carefully researched and created these slides with all aspects taken into consideration. This is a completely customizable Key Metrics To Measure Success Of Website Marketing Strategic Real Estate Themes Pdf that is available for immediate downloading. Download now and make an impact on your audience. Highlight the attractive features available with our PPTs. The following slide outlines major metrics through which real estate companies can evaluate website performance. The key performance indicators KPIs highlighted in slide are total visitors, bounce rate, session duration, page views, customer conversion rate, etc.
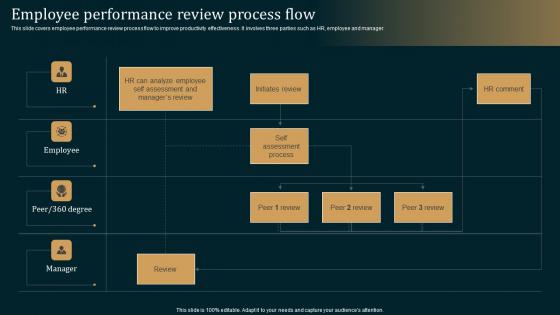
Employee Performance Review Employee Performance Improvement Strategies Infographics Pdf
This slide covers employee performance review process flow to improve productivity effectiveness. It involves three parties such as HR, employee and manager. If your project calls for a presentation, then Slidegeeks is your go to partner because we have professionally designed, easy to edit templates that are perfect for any presentation. After downloading, you can easily edit Employee Performance Review Employee Performance Improvement Strategies Infographics Pdf and make the changes accordingly. You can rearrange slides or fill them with different images. Check out all the handy templates This slide covers employee performance review process flow to improve productivity effectiveness. It involves three parties such as HR, employee and manager.
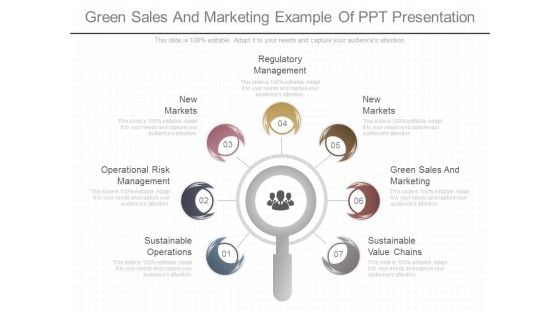
Green Sales And Marketing Example Of Ppt Presentation
This is a green sales and marketing example of ppt presentation. This is a seven stage process. The stages in this process are sustainable operations, operational risk management, markets new, regulatory management, markets markets new, green sales and marketing, sustainable value chains.
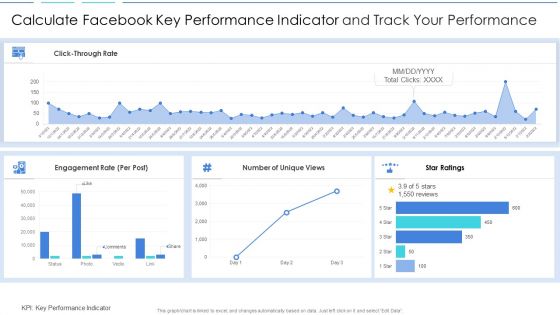
Calculate Facebook Key Performance Indicator And Track Your Performance Information PDF
Showcasing this set of slides titled calculate facebook key performance indicator and track your performance information pdf. The topics addressed in these templates are calculate facebook key performance indicator and track your performance. All the content presented in this PPT design is completely editable. Download it and make adjustments in color, background, font etc. as per your unique business setting.
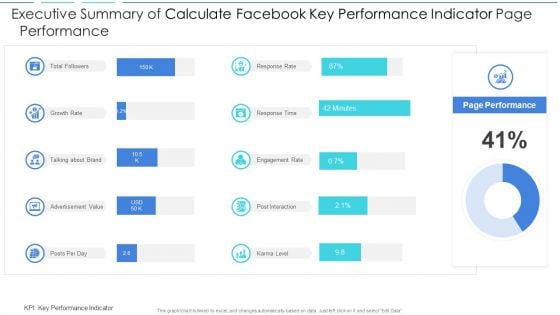
Executive Summary Of Calculate Facebook Key Performance Indicator Page Performance Download PDF
Showcasing this set of slides titled executive summary of calculate facebook key performance indicator page performance download pdf. The topics addressed in these templates are executive summary of calculate facebook key performance indicator page performance. All the content presented in this PPT design is completely editable. Download it and make adjustments in color, background, font etc. as per your unique business setting.
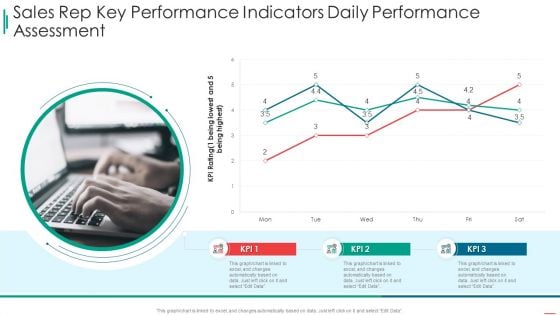
Sales Rep Scorecard Sales Rep Key Performance Indicators Daily Performance Assessment Sample PDF
Deliver and pitch your topic in the best possible manner with this sales rep scorecard sales rep key performance indicators daily performance assessment sample pdf. Use them to share invaluable insights on sales rep key performance indicators daily performance assessment and impress your audience. This template can be altered and modified as per your expectations. So, grab it now.
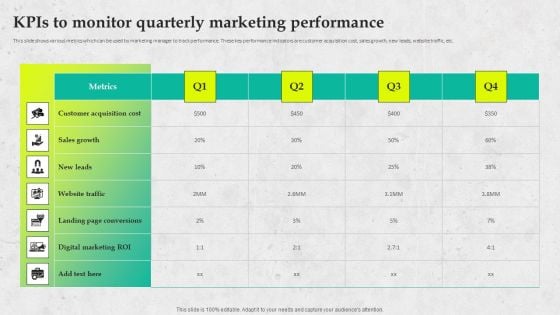
Service Promotion Plan Kpis To Monitor Quarterly Marketing Performance Diagrams PDF
This slide shows various metrics which can be used by marketing manager to track performance. These key performance indicators are customer acquisition cost, sales growth, new leads, website traffic, etc. Make sure to capture your audiences attention in your business displays with our gratis customizable Service Promotion Plan Kpis To Monitor Quarterly Marketing Performance Diagrams PDF. These are great for business strategies, office conferences, capital raising or task suggestions. If you desire to acquire more customers for your tech business and ensure they stay satisfied, create your own sales presentation with these plain slides.
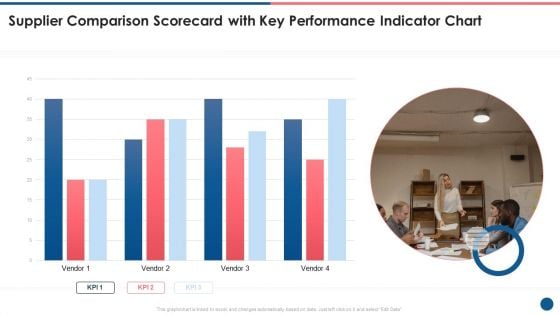
Supplier Scorecard Supplier Comparison Scorecard With Key Performance Indicator Chart Formats PDF
This is a supplier scorecard supplier comparison scorecard with key performance indicator chart formats pdf template with various stages. Focus and dispense information on one stages using this creative set, that comes with editable features. It contains large content boxes to add your information on topics like supplier comparison scorecard, key performance, indicator chart. You can also showcase facts, figures, and other relevant content using this PPT layout. Grab it now.
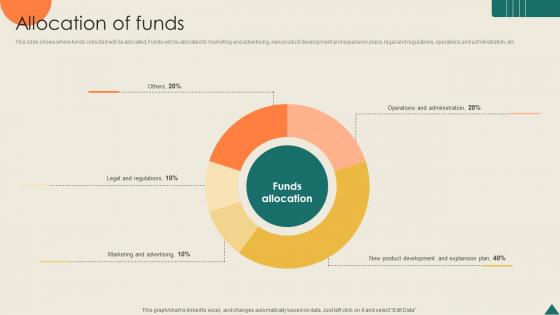
Allocation Of Funds Financial Analytics Platform Investor Elevator Pitch Deck
This slide shows where funds collected will be allocated. Funds will be allocated to marketing and advertising, new product development and expansion plans, legal and regulations, operations and administration, etc. The Allocation Of Funds Financial Analytics Platform Investor Elevator Pitch Deck is a compilation of the most recent design trends as a series of slides. It is suitable for any subject or industry presentation, containing attractive visuals and photo spots for businesses to clearly express their messages. This template contains a variety of slides for the user to input data, such as structures to contrast two elements, bullet points, and slides for written information. Slidegeeks is prepared to create an impression. This slide shows where funds collected will be allocated. Funds will be allocated to marketing and advertising, new product development and expansion plans, legal and regulations, operations and administration, etc.
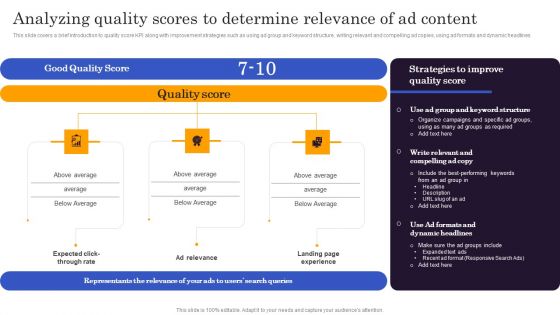
Marketers Guide To Data Analysis Optimization Analyzing Quality Scores To Determine Relevance Of Ad Content Diagrams PDF
This slide covers a brief introduction to quality score KPI along with improvement strategies such as using ad group and keyword structure, writing relevant and compelling ad copies, using ad formats and dynamic headlines. If you are looking for a format to display your unique thoughts, then the professionally designed Marketers Guide To Data Analysis Optimization Analyzing Quality Scores To Determine Relevance Of Ad Content Diagrams PDF is the one for you. You can use it as a Google Slides template or a PowerPoint template. Incorporate impressive visuals, symbols, images, and other charts. Modify or reorganize the text boxes as you desire. Experiment with shade schemes and font pairings. Alter, share or cooperate with other people on your work. Download Marketers Guide To Data Analysis Optimization Analyzing Quality Scores To Determine Relevance Of Ad Content Diagrams PDF and find out how to give a successful presentation. Present a perfect display to your team and make your presentation unforgettable.
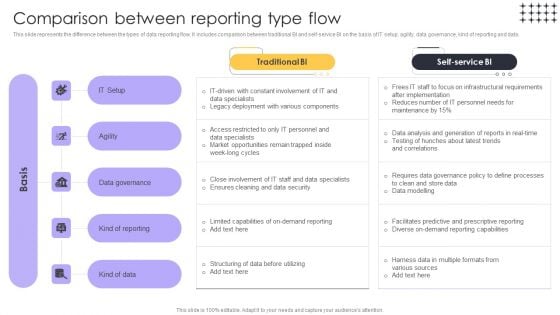
Tools For HR Business Analytics Comparison Between Reporting Type Flow Inspiration PDF
This slide represents the difference between the types of data reporting flow. It includes comparison between traditional BI and self-service BI on the basis of IT setup, agility, data governance, kind of reporting and data. If you are looking for a format to display your unique thoughts, then the professionally designed Tools For HR Business Analytics Comparison Between Reporting Type Flow Inspiration PDF is the one for you. You can use it as a Google Slides template or a PowerPoint template. Incorporate impressive visuals, symbols, images, and other charts. Modify or reorganize the text boxes as you desire. Experiment with shade schemes and font pairings. Alter, share or cooperate with other people on your work. Download Tools For HR Business Analytics Comparison Between Reporting Type Flow Inspiration PDF and find out how to give a successful presentation. Present a perfect display to your team and make your presentation unforgettable.
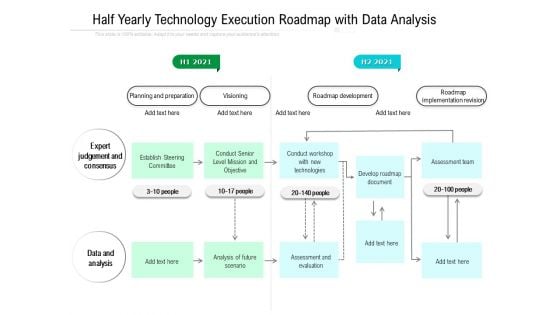
Half Yearly Technology Execution Roadmap With Data Analysis Mockup Elements
We present our half yearly technology execution roadmap with data analysis mockup elements. This PowerPoint layout is easy-to-edit so you can change the font size, font type, color, and shape conveniently. In addition to this, the PowerPoint layout is Google Slides compatible, so you can share it with your audience and give them access to edit it. Therefore, download and save this well-researched half yearly technology execution roadmap with data analysis mockup elements in different formats like PDF, PNG, and JPG to smoothly execute your business plan.
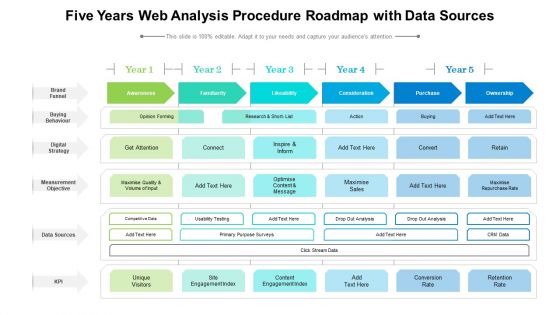
Five Years Web Analysis Procedure Roadmap With Data Designs
We present our five years web analysis procedure roadmap with data designs. This PowerPoint layout is easy to edit so you can change the font size, font type, color, and shape conveniently. In addition to this, the PowerPoint layout is Google Slides compatible, so you can share it with your audience and give them access to edit it. Therefore, download and save this well researched five years web analysis procedure roadmap with data designs in different formats like PDF, PNG, and JPG to smoothly execute your business plan.
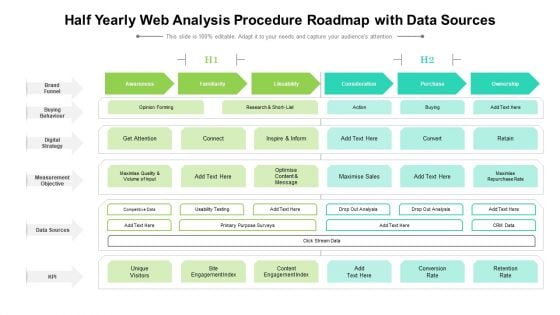
Half Yearly Web Analysis Procedure Roadmap With Data Sources Elements
We present our half yearly web analysis procedure roadmap with data sources elements. This PowerPoint layout is easy to edit so you can change the font size, font type, color, and shape conveniently. In addition to this, the PowerPoint layout is Google Slides compatible, so you can share it with your audience and give them access to edit it. Therefore, download and save this well researched half yearly web analysis procedure roadmap with data sources elements in different formats like PDF, PNG, and JPG to smoothly execute your business plan.
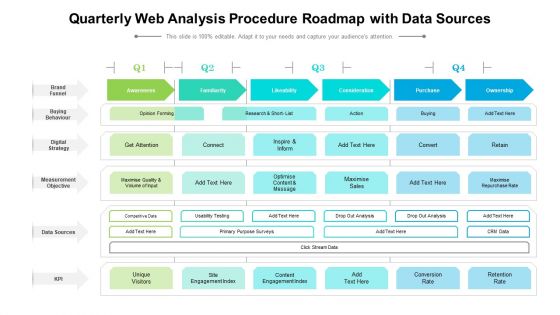
Quarterly Web Analysis Procedure Roadmap With Data Sources Guidelines
We present our quarterly web analysis procedure roadmap with data sources guidelines. This PowerPoint layout is easy to edit so you can change the font size, font type, color, and shape conveniently. In addition to this, the PowerPoint layout is Google Slides compatible, so you can share it with your audience and give them access to edit it. Therefore, download and save this well researched quarterly web analysis procedure roadmap with data sources guidelines in different formats like PDF, PNG, and JPG to smoothly execute your business plan.
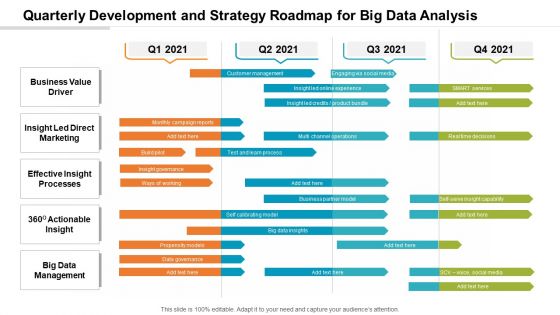
Quarterly Development And Strategy Roadmap For Big Data Analysis Designs
We present our quarterly development and strategy roadmap for big data analysis designs. This PowerPoint layout is easy-to-edit so you can change the font size, font type, color, and shape conveniently. In addition to this, the PowerPoint layout is Google Slides compatible, so you can share it with your audience and give them access to edit it. Therefore, download and save this well-researched quarterly development and strategy roadmap for big data analysis designs in different formats like PDF, PNG, and JPG to smoothly execute your business plan.
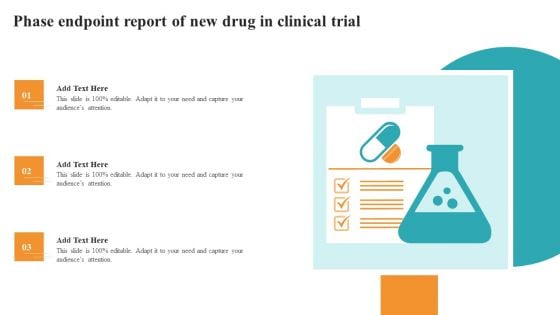
Phase Endpoint Report Of New Drug In Clinical Trial Medical Research Phases For Clinical Tests Designs PDF
The Phase Endpoint Report Of New Drug In Clinical Trial Medical Research Phases For Clinical Tests Designs PDF is a compilation of the most recent design trends as a series of slides. It is suitable for any subject or industry presentation, containing attractive visuals and photo spots for businesses to clearly express their messages. This template contains a variety of slides for the user to input data, such as structures to contrast two elements, bullet points, and slides for written information. Slidegeeks is prepared to create an impression.
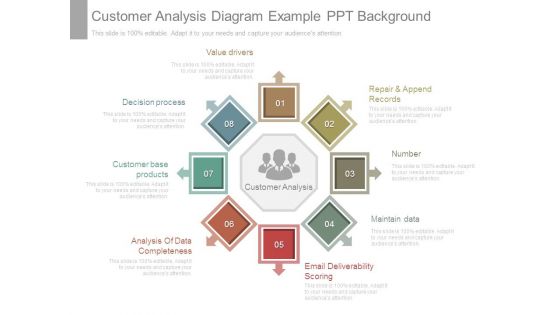
Customer Analysis Diagram Example Ppt Background
This is a customer analysis diagram example ppt background. This is a eight stage process. The stages in this process are repair and append records, number, maintain data, email deliverability scoring, analysis of data completeness, customer base products, decision process, value drivers, customer analysis.
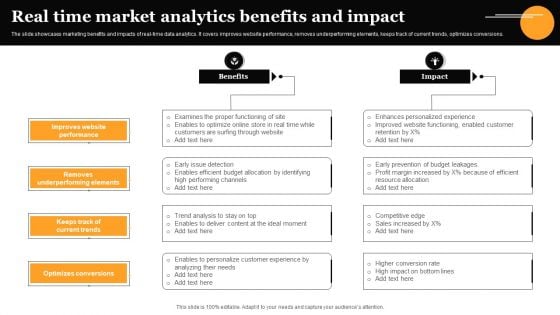
Real Time Market Analytics Benefits And Impact Infographics PDF
The slide showcases marketing benefits and impacts of real-time data analytics. It covers improves website performance, removes underperforming elements, keeps track of current trends, optimizes conversions. Presenting Real Time Market Analytics Benefits And Impact Infographics PDF to dispense important information. This template comprises four stages. It also presents valuable insights into the topics including Improves Website Performance, Removes Underperforming Elements, Optimizes Conversions. This is a completely customizable PowerPoint theme that can be put to use immediately. So, download it and address the topic impactfully.

Introducing CRM Framework Within Organization CRM Data Analysis Period Ppt Ideas Themes PDF
Presenting this set of slides with name introducing crm framework within organization crm data analysis period ppt ideas themes pdf. The topics discussed in these slides are entities by rep, completed activities, biz notes month, phone calls last 3 months, activity last 3 months, sales last 3 months, profit last 3 months. This is a completely editable PowerPoint presentation and is available for immediate download. Download now and impress your audience.
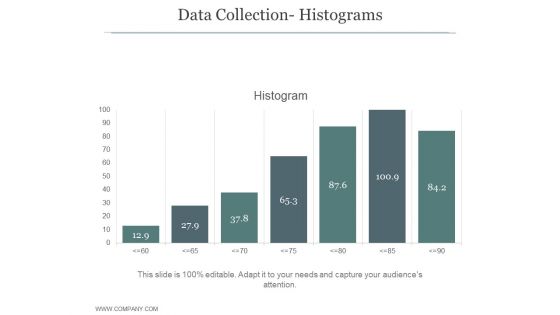
Data Collection Histograms Ppt PowerPoint Presentation Diagrams
This is a data collection histograms ppt powerpoint presentation diagrams. This is a seven stage process. The stages in this process are business, strategy, growth strategy, marketing, histogram, finance.
Business Diagram Metrics For Performance Measurement Presentation Template
This diagram slide has been designed with graphic of matrix. You may use this matrix for performance management. Download this diagram to make interactive presentations.
Pie Chart Data Comparisons 5 Stages How To Develop Business Plan PowerPoint Templates
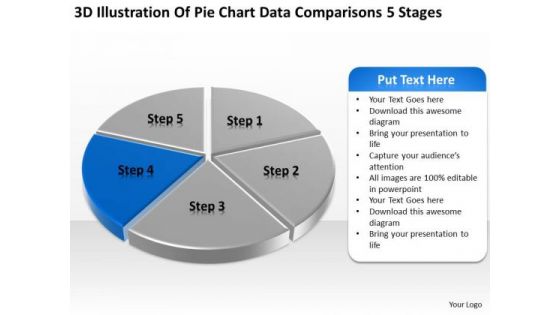
We present our pie chart data comparisons 5 stages how to develop business plan PowerPoint templates.Present our Marketing PowerPoint Templates because You can Be the star of the show with our PowerPoint Templates and Slides. Rock the stage with your ideas. Download and present our Finance PowerPoint Templates because Timeline crunches are a fact of life. Meet all deadlines using our PowerPoint Templates and Slides. Use our Business PowerPoint Templates because You can Be the puppeteer with our PowerPoint Templates and Slides as your strings. Lead your team through the steps of your script. Download and present our Sales PowerPoint Templates because Our PowerPoint Templates and Slides are a sure bet. Gauranteed to win against all odds. Download our Success PowerPoint Templates because Our PowerPoint Templates and Slides will provide weight to your words. They will bring out the depth of your thought process.Use these PowerPoint slides for presentations relating to Analysis, Analyzing, Brands, Business, Chart, Colorful, Commerce, Compare, Comparison, Data, Economical, Finance, Financial, Grow, Growth, Market, Market Share, Marketing, Measure, Pen, Pie, Pie Chart, Presentation, Profit, Revenue, Sales, Sales Chat, Sales Increase, Share, Statistical, Success, Successful. The prominent colors used in the PowerPoint template are Blue, Gray, White. Motivate your team to excellent performances. Nurture their abilities through our Pie Chart Data Comparisons 5 Stages How To Develop Business Plan PowerPoint Templates.
Key Performance Indicators Of Office Work Culture Inspiration PDF
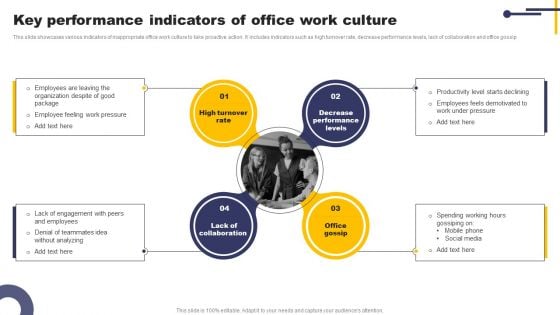
This slide showcases various indicators of inappropriate office work culture to take proactive action. It includes indicators such as high turnover rate, decrease performance levels, lack of collaboration and office gossip. Presenting Key Performance Indicators Of Office Work Culture Inspiration PDF to dispense important information. This template comprises four stages. It also presents valuable insights into the topics including High Turnover Rate, Decrease Performance Levels, Office Gossip. This is a completely customizable PowerPoint theme that can be put to use immediately. So, download it and address the topic impactfully.
Quarterly Data Analysis Procedure Roadmap For Business Elements
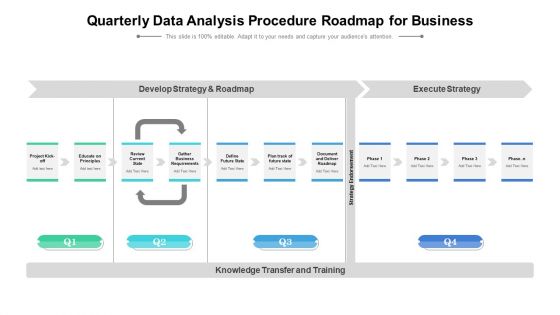
Presenting our innovatively structured quarterly data analysis procedure roadmap for business elements Template. Showcase your roadmap process in different formats like PDF, PNG, and JPG by clicking the download button below. This PPT design is available in both Standard Screen and Widescreen aspect ratios. It can also be easily personalized and presented with modified font size, font type, color, and shapes to measure your progress in a clear way.
Project Key Performance Indicators For Cost Performance Ppt PowerPoint Presentation File Visuals PDF
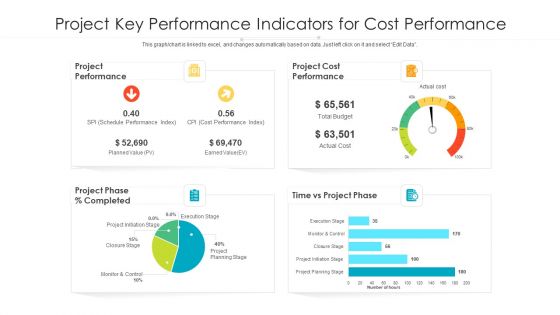
Pitch your topic with ease and precision using this project key performance indicators for cost performance ppt powerpoint presentation file rules pdf. This layout presents information on project performance, project cost performance, schedule performance, closure stage. It is also available for immediate download and adjustment. So, changes can be made in the color, design, graphics or any other component to create a unique layout.

Key Trends Of Global Cosmetic Industry Successful Launch Ppt Template
The following slide outlines various trends in global beauty and cosmetic industry that are leading to market growth and expansion. It showcases elements such as male grooming, awareness and hormones, beauty subscription services and diversity. Retrieve professionally designed Key Trends Of Global Cosmetic Industry Successful Launch Ppt Template to effectively convey your message and captivate your listeners. Save time by selecting pre-made slideshows that are appropriate for various topics, from business to educational purposes. These themes come in many different styles, from creative to corporate, and all of them are easily adjustable and can be edited quickly. Access them as PowerPoint templates or as Google Slides themes. You do not have to go on a hunt for the perfect presentation because Slidegeeks got you covered from everywhere. The following slide outlines various trends in global beauty and cosmetic industry that are leading to market growth and expansion. It showcases elements such as male grooming, awareness and hormones, beauty subscription services and diversity.
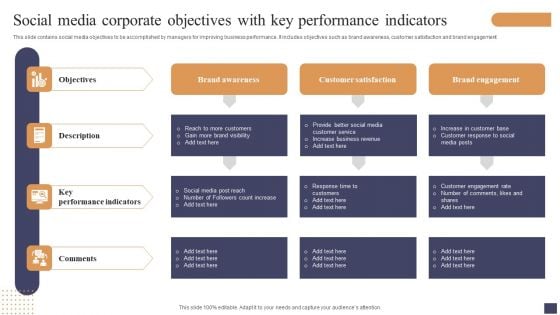
Social Media Corporate Objectives With Key Performance Indicators Pictures PDF
This slide contains social media objectives to be accomplished by managers for improving business performance. It includes objectives such as brand awareness, customer satisfaction and brand engagement. Presenting Social Media Corporate Objectives With Key Performance Indicators Pictures PDF to dispense important information. This template comprises four stages. It also presents valuable insights into the topics including Objectives, Description, Key Performance Indicators . This is a completely customizable PowerPoint theme that can be put to use immediately. So, download it and address the topic impactfully.
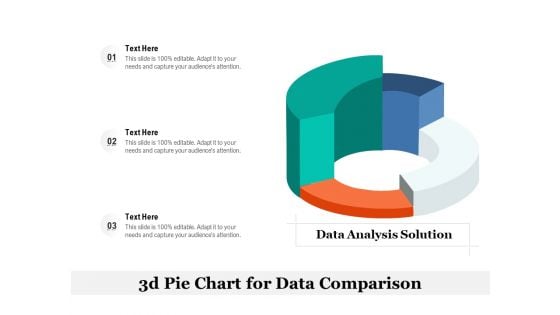
3D Pie Chart For Data Comparison Ppt Infographic Template Vector PDF
Presenting 3d pie chart for data comparison ppt infographic template vector pdf. to dispense important information. This template comprises three stages. It also presents valuable insights into the topics including data analysis solution, 3d pie chart for data comparison. This is a completely customizable PowerPoint theme that can be put to use immediately. So, download it and address the topic impactfully.
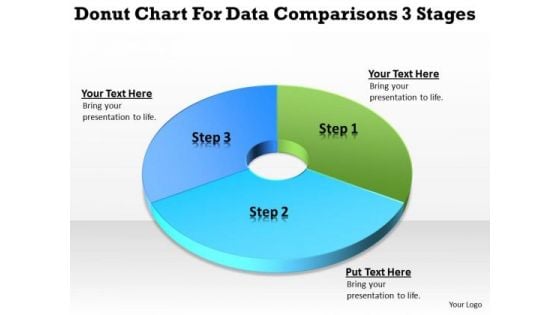
Donut Chart For Data Comparisons 3 Stages Business Planning PowerPoint Slides
We present our donut chart for data comparisons 3 stages business planning PowerPoint Slides.Present our Business PowerPoint Templates because It will Strengthen your hand with your thoughts. They have all the aces you need to win the day. Use our Finance PowerPoint Templates because You will get more than you ever bargained for. Use our Circle Charts PowerPoint Templates because It will Give impetus to the hopes of your colleagues. Our PowerPoint Templates and Slides will aid you in winning their trust. Present our Shapes PowerPoint Templates because You can Raise a toast with our PowerPoint Templates and Slides. Spread good cheer amongst your audience. Download our Process and Flows PowerPoint Templates because Our PowerPoint Templates and Slides help you meet the demand of the Market. Just browse and pick the slides that appeal to your intuitive senses.Use these PowerPoint slides for presentations relating to chart, donut, market, isolated, diminishing, rate, downtrend, business, three-dimensional, success, presentation, diagram, circle, uptrend, percentage, graphic, finance, data, stock, holdings, report, marketing, analyzing, trading, graph, illustration, pie, sale, up, money, design, currency, growth, descriptive, representing, painting, moving, progress, part, increases, background, investment, index, financial, multi, counter, portion, exchange. The prominent colors used in the PowerPoint template are Blue , Blue light, Green. Upgrade your presentation with our Donut Chart For Data Comparisons 3 Stages Business Planning PowerPoint Slides. Download without worries with our money back guaranteee.
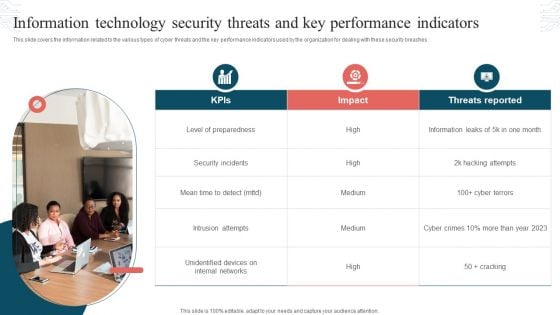
Information Technology Security Threats And Key Performance Indicators Formats PDF
This slide covers the information related to the various types of cyber threats and the key performance indicators used by the organization for dealing with these security breaches. Presenting Information Technology Security Threats And Key Performance Indicators Formats PDF to dispense important information. This template comprises three stages. It also presents valuable insights into the topics including Threats Reported, Security Incidents, Intrusion Attempts. This is a completely customizable PowerPoint theme that can be put to use immediately. So, download it and address the topic impactfully.
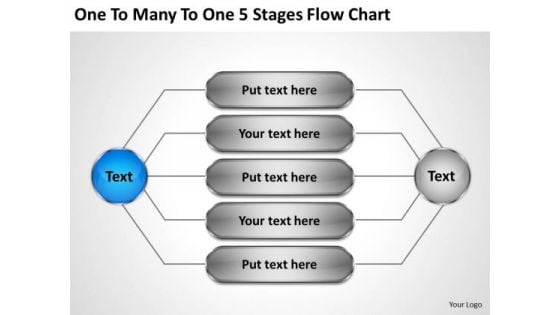
Total Marketing Concepts Many 5 Stages Flow Chart Business Strategy Plan Template
We present our total marketing concepts many 5 stages flow chart business strategy plan template.Use our Business PowerPoint Templates because You are well armed with penetrative ideas. Our PowerPoint Templates and Slides will provide the gunpowder you need. Use our Marketing PowerPoint Templates because Our PowerPoint Templates and Slides provide you with a vast range of viable options. Select the appropriate ones and just fill in your text. Present our Circle Charts PowerPoint Templates because our PowerPoint Templates and Slides will give your ideas the shape. Use our Communication PowerPoint Templates because These PowerPoint Templates and Slides will give the updraft to your ideas. See them soar to great heights with ease. Use our Process and Flows PowerPoint Templates because Our PowerPoint Templates and Slides are focused like a searchlight beam. They highlight your ideas for your target audience.Use these PowerPoint slides for presentations relating to chart, options, flow, arrow, diagram, circular, isolated, sequence, numbers, square, choose, statement, corporate, order, business, sequential, vector, consecutive, presentation, template, circle, data, description, cog, report, marketing, work-flow, illustration, connection, strategy, registry, catalog, segments, web, text, banner, five, progress, information, demonstration, navigation, 4, structure, button, goals, communication. The prominent colors used in the PowerPoint template are Blue, Gray, Black. Exhibit high fibre with our Total Marketing Concepts Many 5 Stages Flow Chart Business Strategy Plan Template. They display your fearless character.
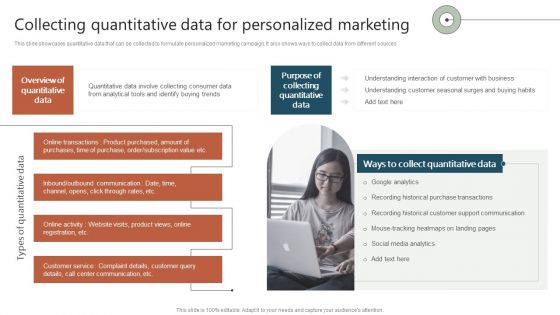
Collecting Quantitative Data For Personalized Marketing Ppt Ideas Sample PDF
This slide showcases quantitative data that can be collected to formulate personalized marketing campaign. It also shows ways to collect data from different sources. Retrieve professionally designed Collecting Quantitative Data For Personalized Marketing Ppt Ideas Sample PDF to effectively convey your message and captivate your listeners. Save time by selecting pre made slideshows that are appropriate for various topics, from business to educational purposes. These themes come in many different styles, from creative to corporate, and all of them are easily adjustable and can be edited quickly. Access them as PowerPoint templates or as Google Slides themes. You do not have to go on a hunt for the perfect presentation because Slidegeeks got you covered from everywhere.
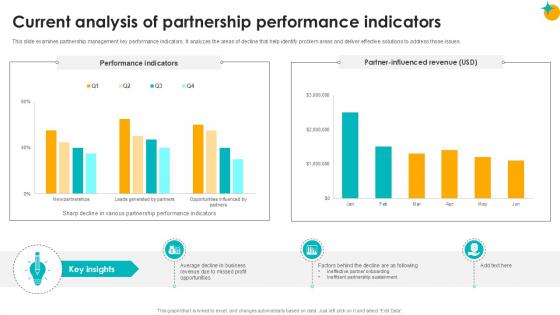
Current Analysis Of Partnership Performance Partner Relationship Ppt Template
This slide examines partnership management key performance indicators. It analyzes the areas of decline that help identify problem areas and deliver effective solutions to address those issues. Create an editable Current Analysis Of Partnership Performance Partner Relationship Ppt Template that communicates your idea and engages your audience. Whether you are presenting a business or an educational presentation, pre-designed presentation templates help save time. Current Analysis Of Partnership Performance Partner Relationship Ppt Template is highly customizable and very easy to edit, covering many different styles from creative to business presentations. Slidegeeks has creative team members who have crafted amazing templates. So, go and get them without any delay. This slide examines partnership management key performance indicators. It analyzes the areas of decline that help identify problem areas and deliver effective solutions to address those issues.
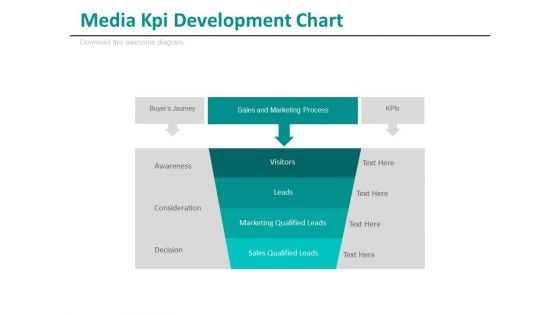
Media Kpi Development Chart Ppt Slides
This is a media KPI development chart ppt slides. This is a one stage process. The stages in this process are business, media, success.
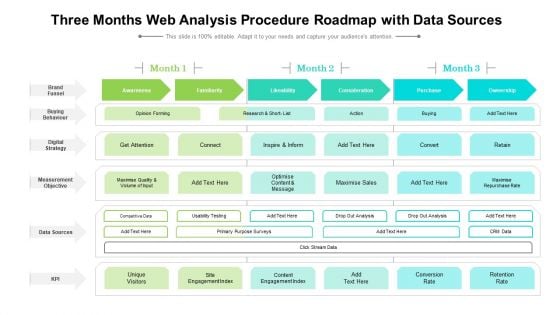
Three Months Web Analysis Procedure Roadmap With Data Sources Guidelines
Presenting our jaw dropping three months web analysis procedure roadmap with data sources guidelines. You can alternate the color, font size, font type, and shapes of this PPT layout according to your strategic process. This PPT presentation is compatible with Google Slides and is available in both standard screen and widescreen aspect ratios. You can also download this well researched PowerPoint template design in different formats like PDF, JPG, and PNG. So utilize this visually appealing design by clicking the download button given below.
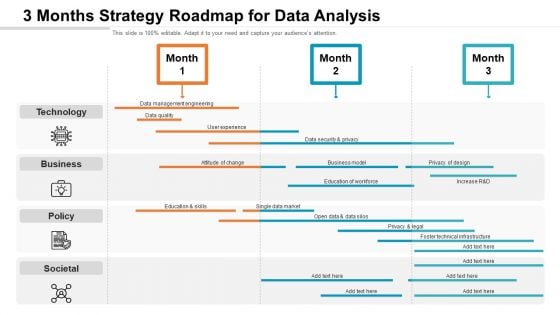
3 Months Strategy Roadmap For Data Analysis Pictures
Presenting the 3 months strategy roadmap for data analysis pictures. The template includes a roadmap that can be used to initiate a strategic plan. Not only this, the PowerPoint slideshow is completely editable and you can effortlessly modify the font size, font type, and shapes according to your needs. This PPT slide can be easily reached in standard screen and widescreen aspect ratios. The set is also available in various formats like PDF, PNG, and JPG. So download and use it multiple times as per your knowledge.
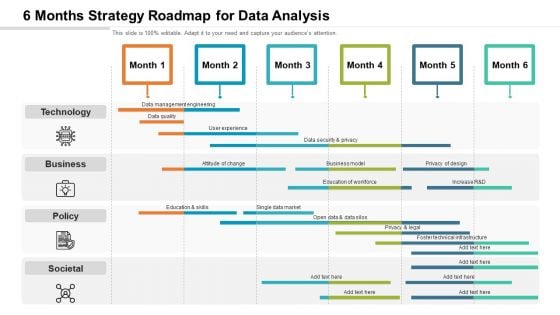
6 Months Strategy Roadmap For Data Analysis Demonstration
Presenting the 6 months strategy roadmap for data analysis demonstration. The template includes a roadmap that can be used to initiate a strategic plan. Not only this, the PowerPoint slideshow is completely editable and you can effortlessly modify the font size, font type, and shapes according to your needs. This PPT slide can be easily reached in standard screen and widescreen aspect ratios. The set is also available in various formats like PDF, PNG, and JPG. So download and use it multiple times as per your knowledge.
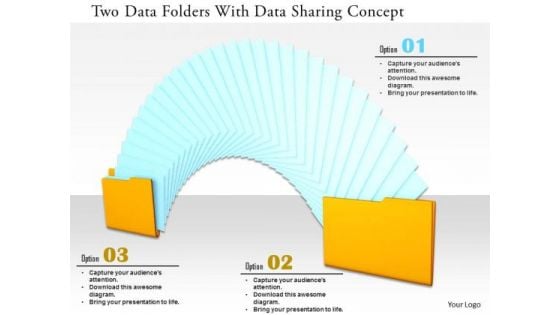
Stock Photo Two Data Folders With Data Sharing Concept PowerPoint Slide
This power point image template has been designed with graphic of two data folders. This PPT contains the concept of data sharing. This PPT can be used for data and technology related presentations.

Consumption Metrics Sharing Metrics Ppt Example
This is a consumption metrics sharing metrics ppt example. This is a four stage process. The stages in this process are circle charts, business, marketing.
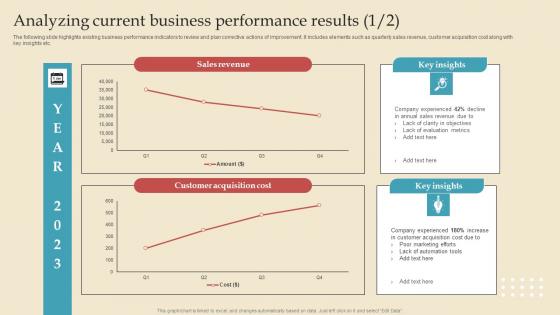
Analyzing Current Describing Business Performance Administration Goals Microsoft Pdf
The following slide highlights existing business performance indicators to review and plan corrective actions of improvement. It includes elements such as quarterly sales revenue, customer acquisition cost along with key insights etc. This modern and well arranged Analyzing Current Describing Business Performance Administration Goals Microsoft Pdf provides lots of creative possibilities. It is very simple to customize and edit with the Powerpoint Software. Just drag and drop your pictures into the shapes. All facets of this template can be edited with Powerpoint, no extra software is necessary. Add your own material, put your images in the places assigned for them, adjust the colors, and then you can show your slides to the world, with an animated slide included. The following slide highlights existing business performance indicators to review and plan corrective actions of improvement. It includes elements such as quarterly sales revenue, customer acquisition cost along with key insights etc.
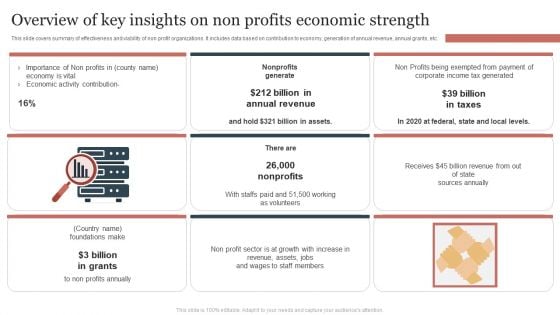
Overview Of Key Insights On Non Profits Economic Strength Summary PDF
This slide covers summary of effectiveness and viability of non profit organizations. It includes data based on contribution to economy, generation of annual revenue, annual grants, etc. Presenting Overview Of Key Insights On Non Profits Economic Strength Summary PDF to dispense important information. This template comprises threestages. It also presents valuable insights into the topics including Annual Revenue, Billion In Taxes, Non Profits. This is a completely customizable PowerPoint theme that can be put to use immediately. So, download it and address the topic impactfully.
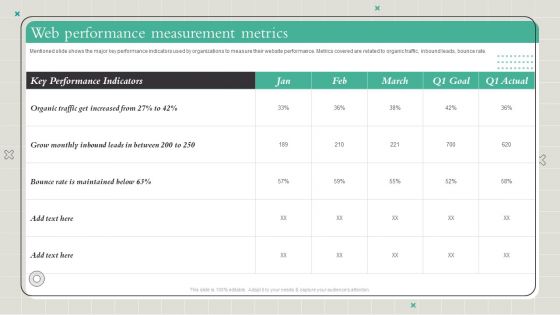
Playbook To Formulate Efficient Web Performance Measurement Metrics Diagrams PDF
Mentioned slide shows the major key performance indicators used by organizations to measure their website performance. Metrics covered are related to organic traffic, inbound leads, bounce rate. Slidegeeks has constructed Playbook To Formulate Efficient Web Performance Measurement Metrics Diagrams PDF after conducting extensive research and examination. These presentation templates are constantly being generated and modified based on user preferences and critiques from editors. Here, you will find the most attractive templates for a range of purposes while taking into account ratings and remarks from users regarding the content. This is an excellent jumping-off point to explore our content and will give new users an insight into our top-notch PowerPoint Templates.
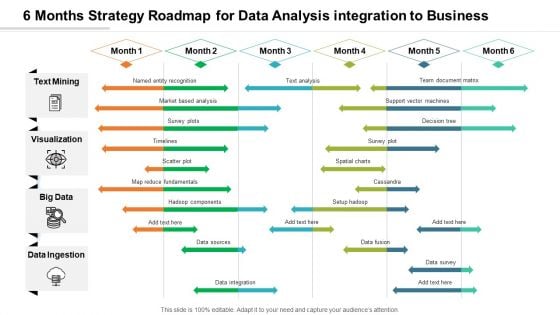
6 Months Strategy Roadmap For Data Analysis Integration To Business Diagrams
Introducing our 6 months strategy roadmap for data analysis integration to business diagrams. This PPT presentation is Google Slides compatible, therefore, you can share it easily with the collaborators for measuring the progress. Also, the presentation is available in both standard screen and widescreen aspect ratios. So edit the template design by modifying the font size, font type, color, and shapes as per your requirements. As this PPT design is fully editable it can be presented in PDF, JPG and PNG formats.
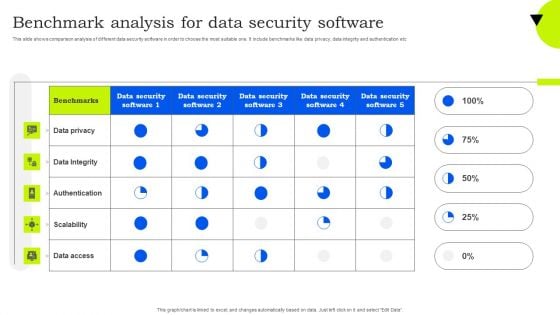
Benchmark Analysis For Data Security Software Mockup PDF
This slide shows comparison analysis of different data security software in order to choose the most suitable one. It include benchmarks like data privacy, data integrity and authentication etc. Showcasing this set of slides titled Benchmark Analysis For Data Security Software Mockup PDF. The topics addressed in these templates are Data Privacy, Data Integrity, Authentication. All the content presented in this PPT design is completely editable. Download it and make adjustments in color, background, font etc. as per your unique business setting.

 Home
Home