Dashboard Icon
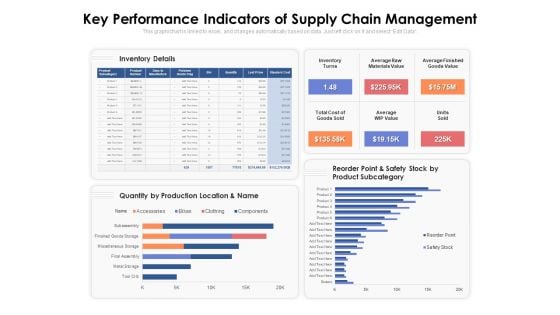
Key Performance Indicators Of Supply Chain Management Ppt PowerPoint Presentation Model Portfolio PDF
Presenting this set of slides with name key performance indicators of supply chain management ppt powerpoint presentation model portfolio pdf. The topics discussed in these slides are inventory details, inventory turns, average raw materials value, average finished goods value, total cost of goods sold, average wip value, units sold. This is a completely editable PowerPoint presentation and is available for immediate download. Download now and impress your audience.
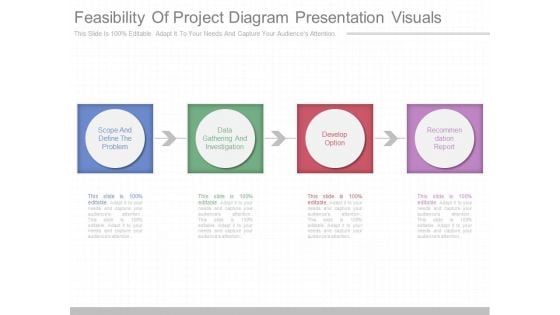
Feasibility Of Project Diagram Presentation Visuals
This is a feasibility of project diagram presentation visuals. This is a four stage process. The stages in this process are scope and define the problem, data gathering and investigation, develop option, recommendation report.
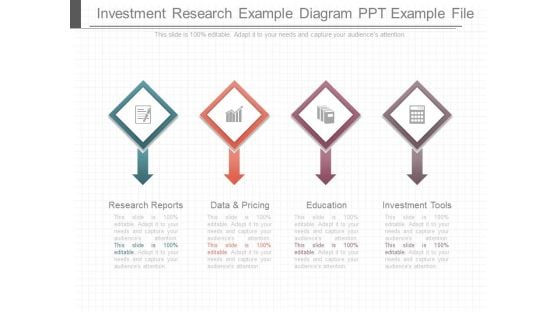
Investment Research Example Diagram Ppt Example File
This is a investment research example diagram ppt example file. This is a four stage process. The stages in this process are research reports, data and pricing, education, investment tools.
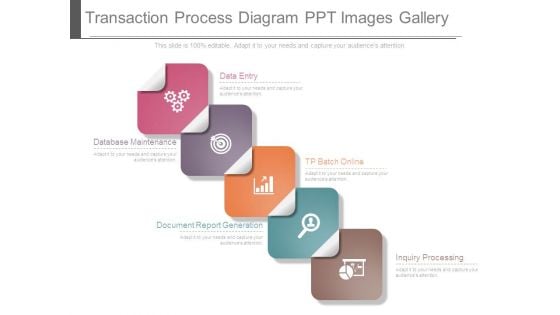
Transaction Process Diagram Ppt Images Gallery
This is a transaction process diagram ppt images gallery. This is a five stage process. The stages in this process are data entry, tp batch online, database maintenance, document report generation, inquiry processing.
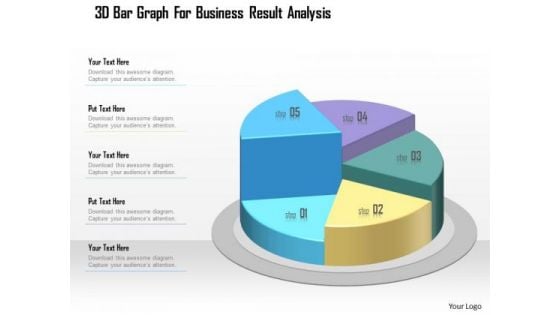
Business Diagram 3d Bar Graph For Business Result Analysis Presentation Template
This business slide displays five staged pie chart. This diagram is a data visualization tool that gives you a simple way to present statistical information. This slide helps your audience examine and interpret the data you present.
Global Food And Grocery Retail Market Size Report Ppt PowerPoint
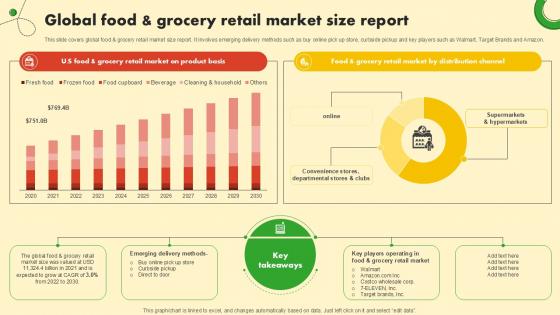
This slide covers global food and grocery retail market size report. It involves emerging delivery methods such as buy online pick up store, curbside pickup and key players such as Walmart, Target Brands and Amazon. If you are looking for a format to display your unique thoughts, then the professionally designed Global Food And Grocery Retail Market Size Report Ppt PowerPoint is the one for you. You can use it as a Google Slides template or a PowerPoint template. Incorporate impressive visuals, symbols, images, and other charts. Modify or reorganize the text boxes as you desire. Experiment with shade schemes and font pairings. Alter, share or cooperate with other people on your work. Download Global Food And Grocery Retail Market Size Report Ppt PowerPoint and find out how to give a successful presentation. Present a perfect display to your team and make your presentation unforgettable. This slide covers global food and grocery retail market size report. It involves emerging delivery methods such as buy online pick up store, curbside pickup and key players such as Walmart, Target Brands and Amazon.
Intelligent Process Automation Technology Global Market Report Mockup Pdf
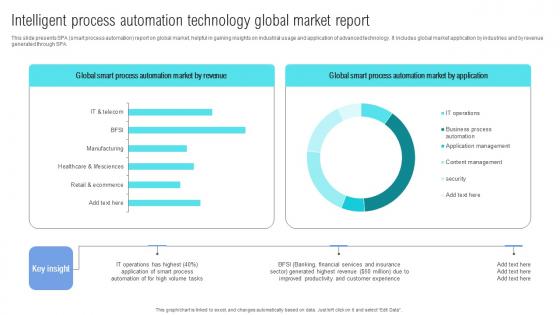
This slide presents SPA smart process automation report on global market, helpful in gaining insights on industrial usage and application of advanced technology. It includes global market application by industries and by revenue generated through SPA. Pitch your topic with ease and precision using this Intelligent Process Automation Technology Global Market Report Mockup Pdf. This layout presents information on Intelligent Process, Automation Technology, Global Market Report. It is also available for immediate download and adjustment. So, changes can be made in the color, design, graphics or any other component to create a unique layout. This slide presents SPA smart process automation report on global market, helpful in gaining insights on industrial usage and application of advanced technology. It includes global market application by industries and by revenue generated through SPA.
Interactive Marketing Trends Example Ppt Samples Download
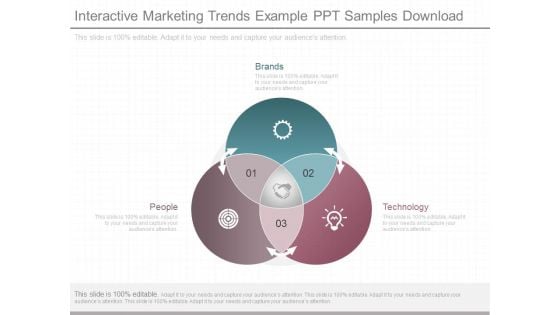
This is a interactive marketing trends example ppt samples download. This is a three stage process. The stages in this process are brands, people, technology.
Business Diagram Three Horizontal Data Columns For Business Presentation Template
Three staged gear diagram has been used to craft this power point template. This PPT contains the concept of business process control. Use this PPT diagram for business and marketing related presentations.

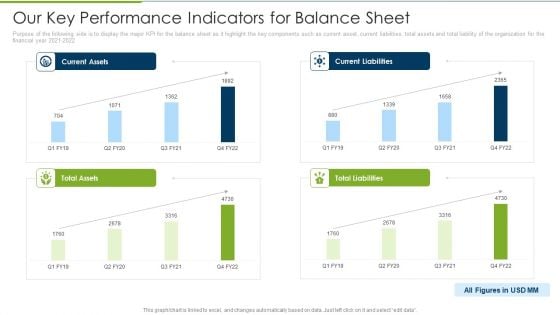
Debt Retrieval Techniques Our Key Performance Indicators For Balance Sheet Ppt Pictures Gallery PDF
Purpose of the following side is to display the major KPI for the balance sheet as it highlight the key components such as current asset, current liabilities, total assets and total liability of the organization for the financial year 2020 2021 Deliver and pitch your topic in the best possible manner with this debt retrieval techniques our key performance indicators for balance sheet ppt pictures gallery pdf. Use them to share invaluable insights on current assets, current liabilities, total assets, total liabilities and impress your audience. This template can be altered and modified as per your expectations. So, grab it now.
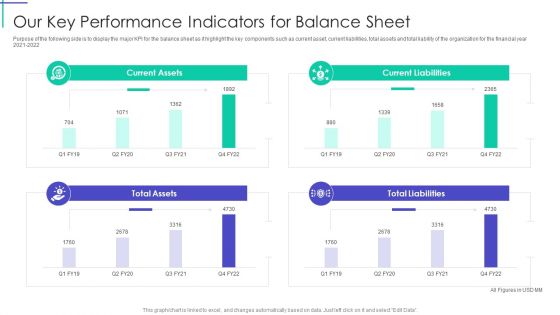
Debt Collection Improvement Plan Our Key Performance Indicators For Balance Sheet Professional PDF
Purpose of the following side is to display the major KPI for the balance sheet as it highlight the key components such as current asset, current liabilities, total assets and total liability of the organization for the financial year 2021 to 2022. Deliver and pitch your topic in the best possible manner with this debt collection improvement plan our key performance indicators for balance sheet professional pdf. Use them to share invaluable insights on current assets, current liabilities, total assets, total liabilities and impress your audience. This template can be altered and modified as per your expectations. So, grab it now.
Mortgage Recovery Strategy For Finance Companies Our Key Performance Indicators For Balance Sheet Inspiration PDF
Purpose of the following side is to display the major KPI for the balance sheet as it highlight the key components such as current asset, current liabilities, total assets and total liability of the organization for the financial year 2021 to 2022. Deliver an awe inspiring pitch with this creative Mortgage Recovery Strategy For Finance Companies Our Key Performance Indicators For Balance Sheet Inspiration PDF bundle. Topics like Current Assets, Current Liabilities, Total Liabilities can be discussed with this completely editable template. It is available for immediate download depending on the needs and requirements of the user.
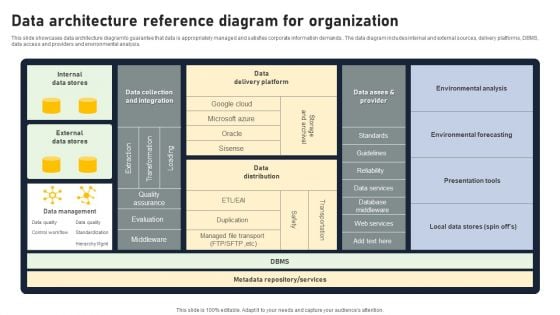
Data Architecture Reference Diagram For Organization Brochure PDF
This slide showcases data architecture diagram to guarantee that data is appropriately managed and satisfies corporate information demands.. The data diagram includes internal and external sources, delivery platforms, DBMS, data access and providers and environmental analysis. Pitch your topic with ease and precision using this Data Architecture Reference Diagram For Organization Brochure PDF. This layout presents information on Internal Data Stores, External Data Stores, Data Delivery Platform. It is also available for immediate download and adjustment. So, changes can be made in the color, design, graphics or any other component to create a unique layout.
Key Production Challenges Faced Business Performance Optimization New Operations Strategy Pictures Pdf
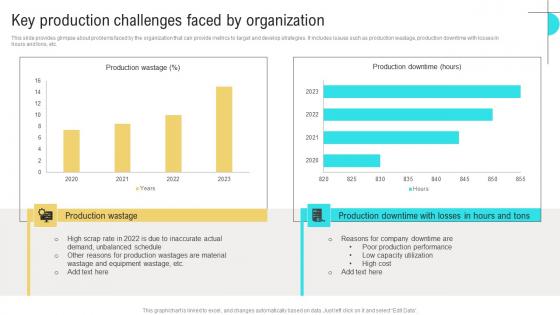
This slide provides glimpse about problems faced by the organization that can provide metrics to target and develop strategies. It includes issues such as production wastage, production downtime with losses in hours and tons, etc. This Key Production Challenges Faced Business Performance Optimization New Operations Strategy Pictures Pdf is perfect for any presentation, be it in front of clients or colleagues. It is a versatile and stylish solution for organizing your meetings. The Key Production Challenges Faced Business Performance Optimization New Operations Strategy Pictures Pdf features a modern design for your presentation meetings. The adjustable and customizable slides provide unlimited possibilities for acing up your presentation. Slidegeeks has done all the homework before launching the product for you. So, do not wait, grab the presentation templates today This slide provides glimpse about problems faced by the organization that can provide metrics to target and develop strategies. It includes issues such as production wastage, production downtime with losses in hours and tons, etc.
Market Data Integration Project Ppt Slides Styles
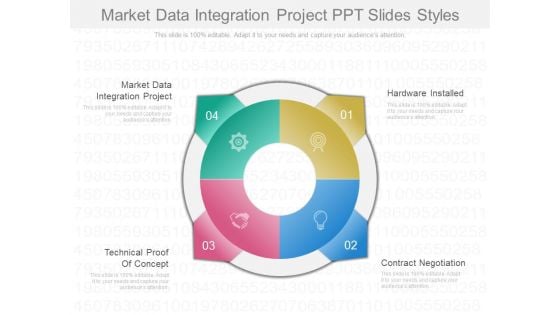
This is a market data integration project ppt slides styles. This is a four stage process. The stages in this process are market data integration project, technical proof of concept, hardware installed, contract negotiation.
Key Production Challenges Faced Operations Strategy Improve Business Productivity Information Pdf
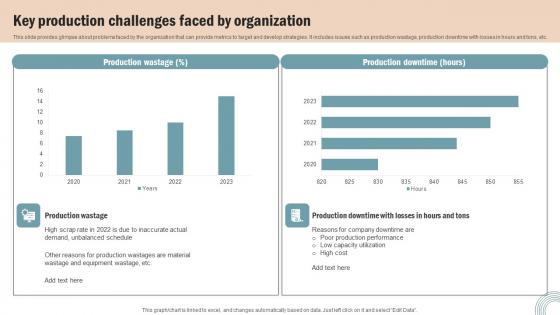
This slide provides glimpse about problems faced by the organization that can provide metrics to target and develop strategies. It includes issues such as production wastage, production downtime with losses in hours and tons, etc. Make sure to capture your audiences attention in your business displays with our gratis customizable Key Production Challenges Faced Operations Strategy Improve Business Productivity Information Pdf. These are great for business strategies, office conferences, capital raising or task suggestions. If you desire to acquire more customers for your tech business and ensure they stay satisfied, create your own sales presentation with these plain slides. This slide provides glimpse about problems faced by the organization that can provide metrics to target and develop strategies. It includes issues such as production wastage, production downtime with losses in hours and tons, etc.

Agenda For Data Analytics Management Diagrams PDF
Presenting Agenda For Data Analytics Management Diagrams PDF to provide visual cues and insights. Share and navigate important information on five stages that need your due attention. This template can be used to pitch topics like Agenda. In addtion, this PPT design contains high resolution images, graphics, etc, that are easily editable and available for immediate download.
PowerPoint Templates Process Portfolio Analysis Ppt Themes
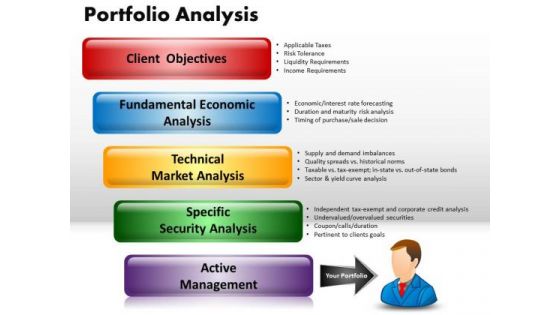
PowerPoint Templates Process Portfolio Analysis PPT Themes-These high quality powerpoint pre-designed slides and powerpoint templates have been carefully created by our professional team to help you impress your audience. All slides have been created and are 100% editable in powerpoint. Each and every property of any graphic - color, size, orientation, shading, outline etc. can be modified to help you build an effective powerpoint presentation. Any text can be entered at any point in the powerpoint template or slide. Simply DOWNLOAD, TYPE and PRESENT! Put up the facts and figures on our PowerPoint Templates Process Portfolio Analysis Ppt Themes. Display the data for everyone's consumption.

Sustainable Workplace Development Focus On Three Pillars Of Sustainable Marketing Pictures Pdf
This slide covers three pillars of sustainable marketing which are environmental, social and economic impact of company operations. Environmental aspect includes green initiatives, social aspect includes health and safety of people and economic aspect includes employment generation. The Sustainable Workplace Development Focus On Three Pillars Of Sustainable Marketing Pictures Pdf is a compilation of the most recent design trends as a series of slides. It is suitable for any subject or industry presentation, containing attractive visuals and photo spots for businesses to clearly express their messages. This template contains a variety of slides for the user to input data, such as structures to contrast two elements, bullet points, and slides for written information. Slidegeeks is prepared to create an impression. This slide covers three pillars of sustainable marketing which are environmental, social and economic impact of company operations. Environmental aspect includes green initiatives, social aspect includes health and safety of people and economic aspect includes employment generation.
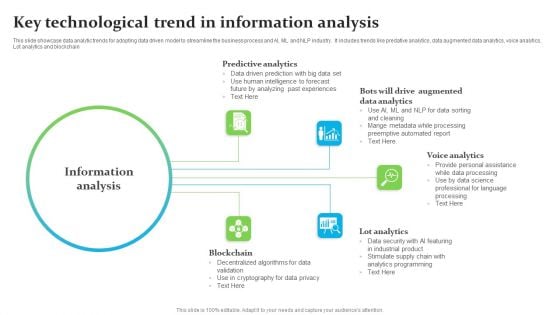
Key Technological Trend In Information Analysis Ppt Ideas Layout PDF
This slide showcase data analytic trends for adopting data driven model to streamline the business process and AI, ML and NLP industry. It includes trends like predative analytics, data augmented data analytics, voice analytics, Lot analytics and blockchain. Presenting Key Technological Trend In Information Analysis Ppt Ideas Layout PDF to dispense important information. This template comprises five stages. It also presents valuable insights into the topics including Predictive Analytics, Voice Analytics, Lot Analytics, Blockchain. This is a completely customizable PowerPoint theme that can be put to use immediately. So, download it and address the topic impactfully.
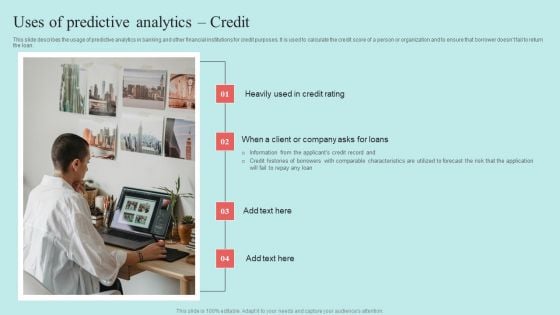
Predictive Data Model Uses Of Predictive Analytics Credit Information PDF
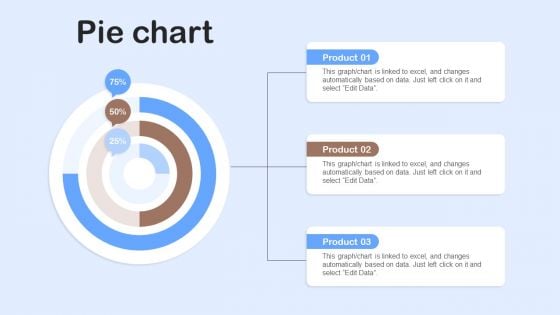
Nestle Performance Management Report Pie Chart Ppt Ideas Graphics Example PDF
This graph or chart is linked to excel, and changes automatically based on data. Just left click on it and select Edit Data. Are you in need of a template that can accommodate all of your creative concepts This one is crafted professionally and can be altered to fit any style. Use it with Google Slides or PowerPoint. Include striking photographs, symbols, depictions, and other visuals. Fill, move around, or remove text boxes as desired. Test out color palettes and font mixtures. Edit and save your work, or work with colleagues. Download Nestle Performance Management Report Pie Chart Ppt Ideas Graphics Example PDF and observe how to make your presentation outstanding. Give an impeccable presentation to your group and make your presentation unforgettable.
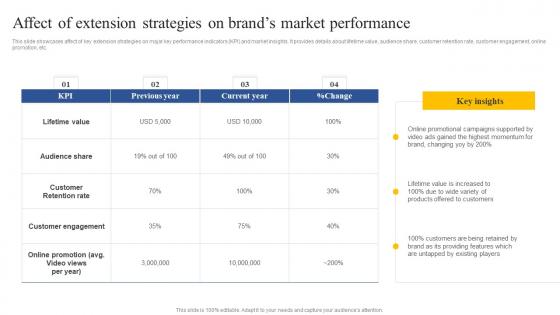
Affect Of Extension Strategies On Brands Market Performance How To Implement Product Portrait Pdf
This slide showcases affect of key extension strategies on major key performance indicators KPI and market insights. It provides details about lifetime value, audience share, customer retention rate, customer engagement, online promotion, etc. Whether you have daily or monthly meetings, a brilliant presentation is necessary. Affect Of Extension Strategies On Brands Market Performance How To Implement Product Portrait Pdf can be your best option for delivering a presentation. Represent everything in detail using Affect Of Extension Strategies On Brands Market Performance How To Implement Product Portrait Pdf and make yourself stand out in meetings. The template is versatile and follows a structure that will cater to your requirements. All the templates prepared by Slidegeeks are easy to download and edit. Our research experts have taken care of the corporate themes as well. So, give it a try and see the results. This slide showcases affect of key extension strategies on major key performance indicators KPI and market insights. It provides details about lifetime value, audience share, customer retention rate, customer engagement, online promotion, etc.
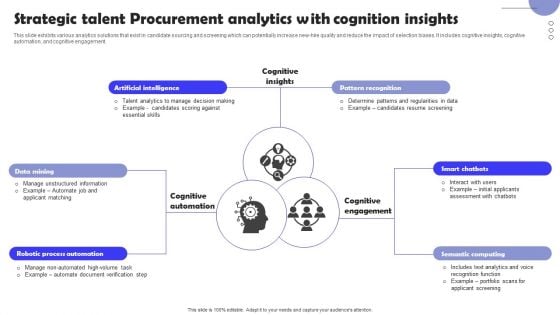
Strategic Talent Procurement Analytics With Cognition Insights Infographics PDF
This slide exhibits various analytics solutions that exist in candidate sourcing and screening which can potentially increase new-hire quality and reduce the impact of selection biases. It includes cognitive insights, cognitive automation, and cognitive engagement. Presenting Strategic Talent Procurement Analytics With Cognition Insights Infographics PDF to dispense important information. This template comprises six stages. It also presents valuable insights into the topics including Data Mining, Artificial Intelligence, Pattern Recognition, Smart Chatbots. This is a completely customizable PowerPoint theme that can be put to use immediately. So, download it and address the topic impactfully.
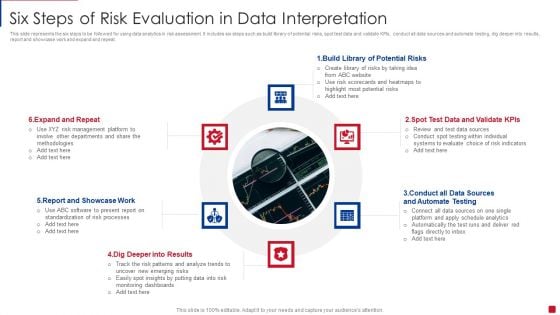
Six Steps Of Risk Evaluation In Data Interpretation Sources Brochure PDF
This slide represents the six steps to be followed for using data analytics in risk assessment. It includes six steps such as build library of potential risks, spot test data and validate KPIs, conduct all data sources and automate testing, dig deeper into results, report and showcase work and expand and repeat. Presenting Six Steps Of Risk Evaluation In Data Interpretation Sources Brochure PDF to dispense important information. This template comprises ten stages. It also presents valuable insights into the topics including Target Personas, Define The Questions, Define The Business Model. This is a completely customizable PowerPoint theme that can be put to use immediately. So, download it and address the topic impactfully.
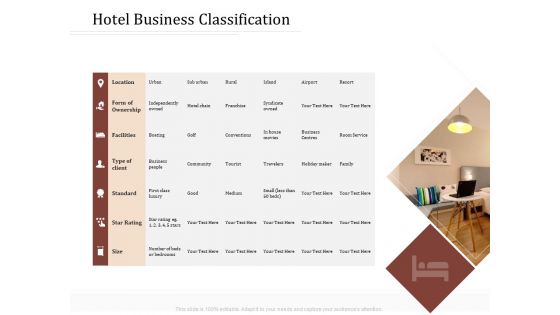
Key Metrics Hotel Administration Management Hotel Business Classification Slides PDF
Presenting this set of slides with name key metrics hotel administration management hotel business classification slides pdf. The topics discussed in these slides are location, facilities, standard, star rating, community. This is a completely editable PowerPoint presentation and is available for immediate download. Download now and impress your audience.
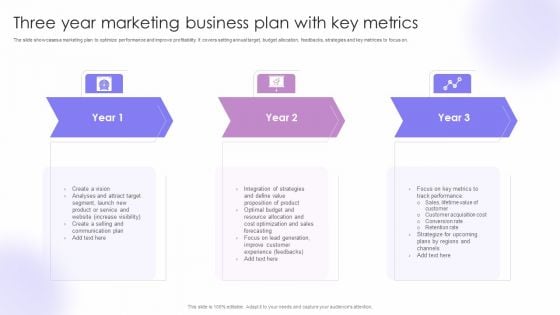
Three Year Marketing Business Plan With Key Metrics Diagrams PDF
The slide showcases a marketing plan to optimize performance and improve profitability. It covers setting annual target, budget allocation, feedbacks, strategies and key metrices to focus on. Presenting Three Year Marketing Business Plan With Key Metrics Diagrams PDF to dispense important information. This template comprises three stages. It also presents valuable insights into the topics including Attract Target Segment, Analyses, Product Or Service. This is a completely customizable PowerPoint theme that can be put to use immediately. So, download it and address the topic impactfully.
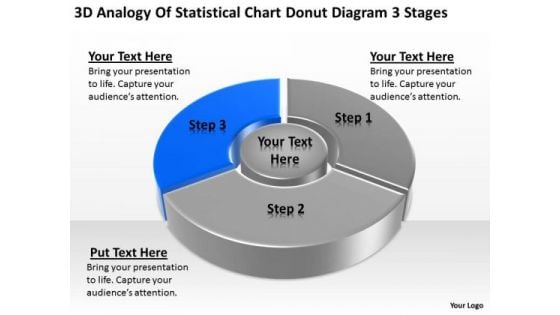
Statistical Chart Donut Diagram 3 Stages Ppt Samples Business Plan PowerPoint Slides
We present our statistical chart donut diagram 3 stages ppt samples business plan PowerPoint Slides.Download our Finance PowerPoint Templates because you should Experience excellence with our PowerPoint Templates and Slides. They will take your breath away. Present our Marketing PowerPoint Templates because our bewitching PowerPoint Templates and Slides will delight your audience with the magic of your words. Use our Sales PowerPoint Templates because You have gained great respect for your brilliant ideas. Use our PowerPoint Templates and Slides to strengthen and enhance your reputation. Download our Business PowerPoint Templates because You have a driving passion to excel in your field. Our PowerPoint Templates and Slides will prove ideal vehicles for your ideas. Download our Success PowerPoint Templates because You should Kick up a storm with our PowerPoint Templates and Slides. The heads of your listeners will swirl with your ideas.Use these PowerPoint slides for presentations relating to Chart, Business, Data, Donut, Market, Sales, Document, Economy, Display, Bar, Corporate, Income, Concept, Success, Presentation, Symbol, Diagram, Percentage, Graphic, Finance, Stock, Clean, Analysis, Report, Marketing, Accounting, Management, Graph, Colors, Forecast, Design, Growth, Competition, Progress, Profit, Information, Background, Trade, Investment, Statistic, Financial. The prominent colors used in the PowerPoint template are Blue, Gray, Black. Make the event with our Statistical Chart Donut Diagram 3 Stages Ppt Samples Business Plan PowerPoint Slides. Your thoughts will be really happening.
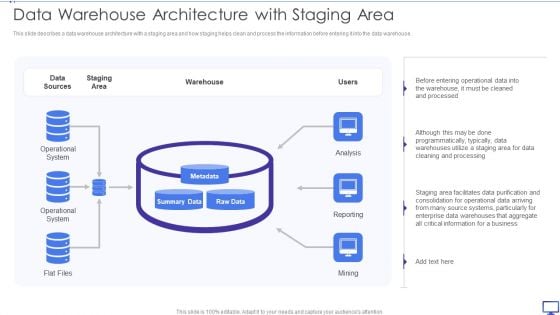
Decision Support System Data Warehouse Architecture With Staging Area Diagrams PDF
This slide describes a data warehouse architecture with a staging area and how staging helps clean and process the information before entering it into the data warehouse. This is a Decision Support System Data Warehouse Architecture With Staging Area Diagrams PDF template with various stages. Focus and dispense information on one stages using this creative set, that comes with editable features. It contains large content boxes to add your information on topics like Data Sources, Staging Area, Operational System. You can also showcase facts, figures, and other relevant content using this PPT layout. Grab it now.
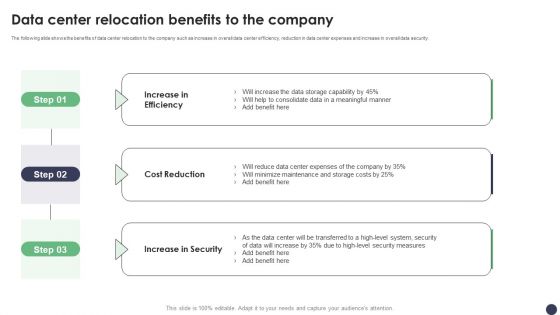
Data Center Relocation Benefits To The Company Ppt PowerPoint Presentation Diagram Graph Charts PDF
The following slide shows the benefits of data center relocation to the company such as increase in overall data center efficiency, reduction in data center expenses and increase in overall data security. Slidegeeks is here to make your presentations a breeze with Data Center Relocation Benefits To The Company Ppt PowerPoint Presentation Diagram Graph Charts PDF With our easy to use and customizable templates, you can focus on delivering your ideas rather than worrying about formatting. With a variety of designs to choose from, you are sure to find one that suits your needs. And with animations and unique photos, illustrations, and fonts, you can make your presentation pop. So whether you are giving a sales pitch or presenting to the board, make sure to check out Slidegeeks first.
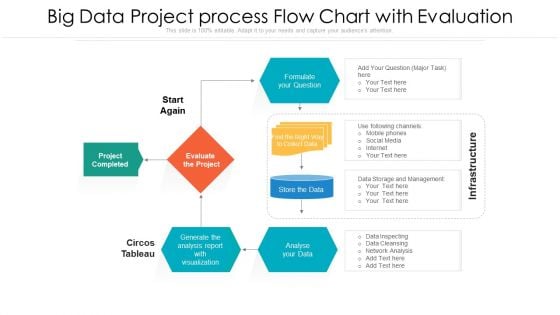
Big Data Project Process Flow Chart With Evaluation Ppt Portfolio
Presenting big data project process flow chart with evaluation ppt portfolio to dispense important information. This template comprises seven stages. It also presents valuable insights into the topics including social media, management, network analysis, data storage, infrastructure. This is a completely customizable PowerPoint theme that can be put to use immediately. So, download it and address the topic impactfully.
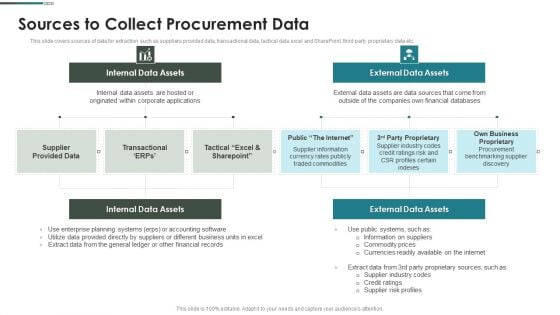
Purchase Assessment Process Sources To Collect Procurement Data Diagrams PDF
This slide covers sources of data for extraction such as suppliers provided data, transactional data, tactical data excel and SharePoint, third party proprietary data etc.Deliver an awe inspiring pitch with this creative Purchase Assessment Process Sources To Collect Procurement Data Diagrams PDF bundle. Topics like Internal Data, External Data, Data Assets can be discussed with this completely editable template. It is available for immediate download depending on the needs and requirements of the user.
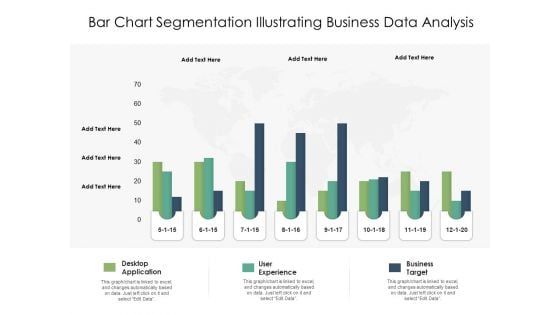
Bar Chart Segmentation Illustrating Business Data Analysis Ppt PowerPoint Presentation Outline File Formats
Presenting this set of slides with name bar chart segmentation illustrating business data analysis ppt powerpoint presentation outline file formats. The topics discussed in these slides are desktop application, user experience, business target. This is a completely editable PowerPoint presentation and is available for immediate download. Download now and impress your audience.
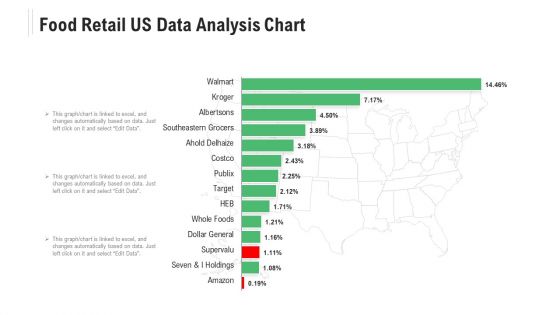
Food Retail US Data Analysis Chart Ppt Powerpoint Presentation Ideas Microsoft Pdf
Pitch your topic with ease and precision using this food retail us data analysis chart ppt powerpoint presentation ideas microsoft pdf. This layout presents information on seven and i holdings, amazon, southeastern grocers, albertsons, target. It is also available for immediate download and adjustment. So, changes can be made in the color, design, graphics or any other component to create a unique layout.
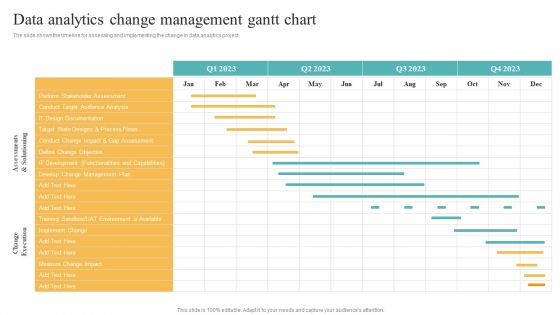
Data Analytics Change Management Gantt Chart Transformation Toolkit Competitive Intelligence Rules PDF
The slide shows the timeline for assessing and implementing the change in data analytics project. Are you in need of a template that can accommodate all of your creative concepts This one is crafted professionally and can be altered to fit any style. Use it with Google Slides or PowerPoint. Include striking photographs, symbols, depictions, and other visuals. Fill, move around, or remove text boxes as desired. Test out color palettes and font mixtures. Edit and save your work, or work with colleagues. Download Data Analytics Change Management Gantt Chart Transformation Toolkit Competitive Intelligence Rules PDF and observe how to make your presentation outstanding. Give an impeccable presentation to your group and make your presentation unforgettable.
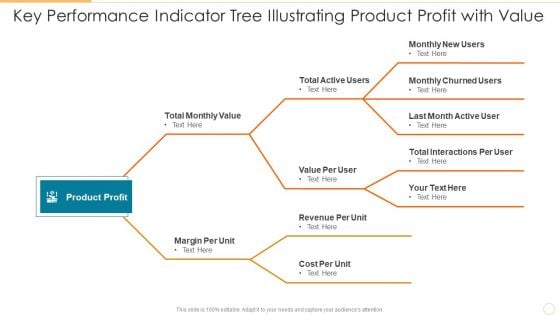
Key Performance Indicator Tree Illustrating Product Profit With Value Brochure PDF
Persuade your audience using this key performance indicator tree illustrating product profit with value brochure pdf. This PPT design covers three stages, thus making it a great tool to use. It also caters to a variety of topics including value per user, revenue per unit, cost per unit. Download this PPT design now to present a convincing pitch that not only emphasizes the topic but also showcases your presentation skills.
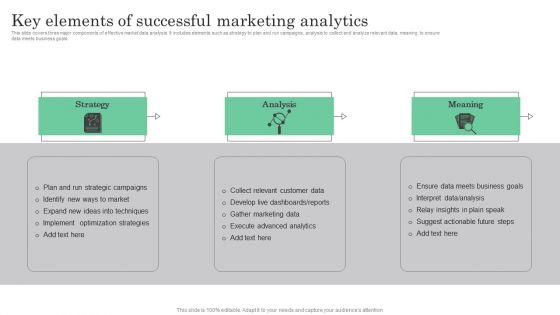
Online Marketing Analytics To Enhance Business Growth Key Elements Of Successful Marketing Analytics Demonstration PDF
This slide covers three major components of effective market data analysis. It includes elements such as strategy to plan and run campaigns, analysis to collect and analyze relevant data, meaning to ensure data meets business goals. Whether you have daily or monthly meetings, a brilliant presentation is necessary. Online Marketing Analytics To Enhance Business Growth Key Elements Of Successful Marketing Analytics Demonstration PDF can be your best option for delivering a presentation. Represent everything in detail using Online Marketing Analytics To Enhance Business Growth Key Elements Of Successful Marketing Analytics Demonstration PDF and make yourself stand out in meetings. The template is versatile and follows a structure that will cater to your requirements. All the templates prepared by Slidegeeks are easy to download and edit. Our research experts have taken care of the corporate themes as well. So, give it a try and see the results.
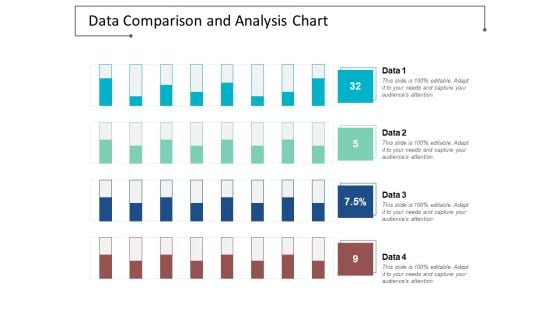
Data Comparison And Analysis Chart Ppt Powerpoint Presentation File Background Images
This is a data comparison and analysis chart ppt powerpoint presentation file background images. This is a four stage process. The stages in this process are data presentation, content presentation, information presentation.
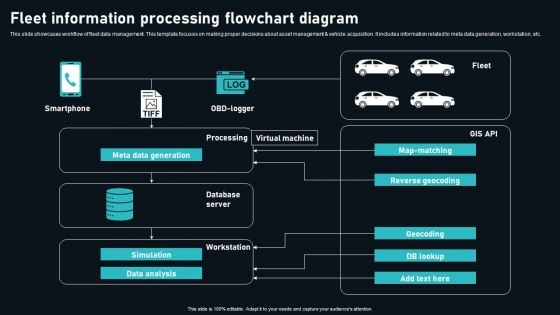
Fleet Information Processing Flowchart Diagram Themes PDF
This slide showcases workflow of fleet data management. This template focuses on making proper decisions about asset management and vehicle acquisition. It includes information related to meta data generation, workstation, etc. Showcasing this set of slides titled Fleet Information Processing Flowchart Diagram Themes PDF. The topics addressed in these templates are Smartphone, Processing, Virtual Machine. All the content presented in this PPT design is completely editable. Download it and make adjustments in color, background, font etc. as per your unique business setting.
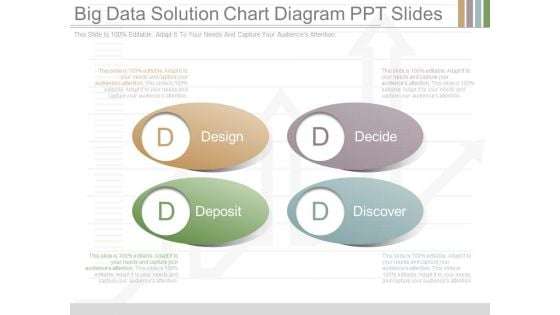
Big Data Solution Chart Diagram Ppt Slides
This is a big data solution chart diagram ppt slides. This is a four stage process. The stages in this process are design, decide, deposit, discover.
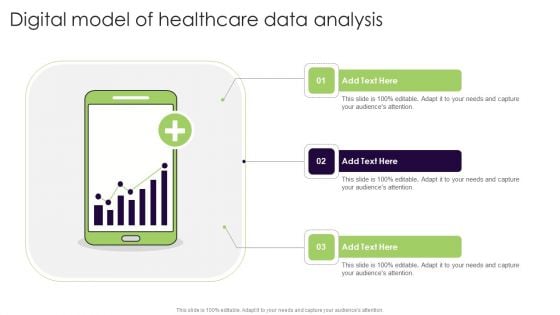
Digital Model Of Healthcare Data Analysis Demonstration PDF
Presenting Digital Model Of Healthcare Data Analysis Demonstration PDF to dispense important information. This template comprises three stages. It also presents valuable insights into the topics including Digital Model, Healthcare Data Analysis. This is a completely customizable PowerPoint theme that can be put to use immediately. So, download it and address the topic impactfully.
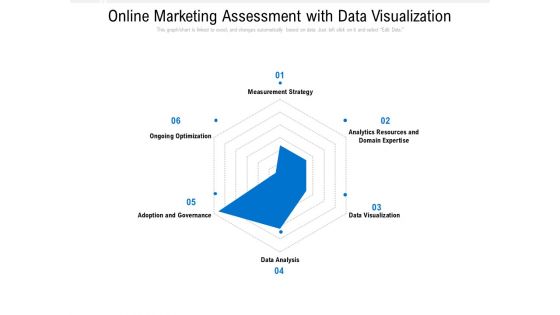
Online Marketing Assessment With Data Visualization Ppt PowerPoint Presentation Gallery Background Images PDF
Presenting this set of slides with name online marketing assessment with data visualization ppt powerpoint presentation gallery background images pdf. The topics discussed in these slides are strategy, data analysis, optimization. This is a completely editable PowerPoint presentation and is available for immediate download. Download now and impress your audience.
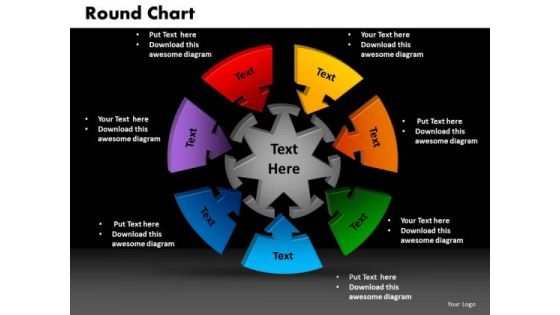
PowerPoint Design Slides Round Chart Image Ppt Themes
PowerPoint Design Slides Round Chart Image PPT Themes-Determine your targets and sequence them as per your priorities. Unravel each one for your audience while setting key timelines as you go along. Educate your listeners on the relevance and importance of each one as per your plan and how they all contribute as you strive to hit the Bullseye-PowerPoint Design Slides Round Chart Image PPT Themes-This ppt can be used for presentations relating to-3d, Angle, Arrow, Business, Chart, Circle, Complex, Concept, Data, Depth, Diagram, Dimensional, Financial, Graph, Graphic, Process Our PowerPoint Design Slides Round Chart Image Ppt Themes will fulfill your every need. Use them and effectively to gain success.
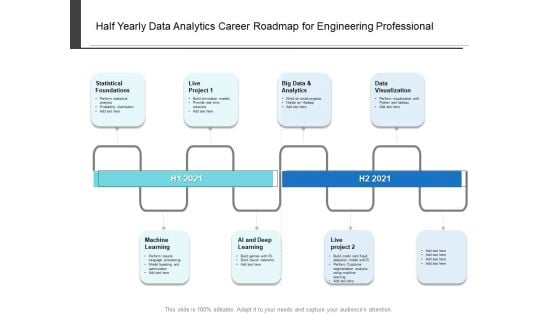
Half Yearly Data Analytics Career Roadmap For Engineering Professional Themes
Presenting our innovatively-structured half yearly data analytics career roadmap for engineering professional themes Template. Showcase your roadmap process in different formats like PDF, PNG, and JPG by clicking the download button below. This PPT design is available in both Standard Screen and Widescreen aspect ratios. It can also be easily personalized and presented with modified font size, font type, color, and shapes to measure your progress in a clear way.
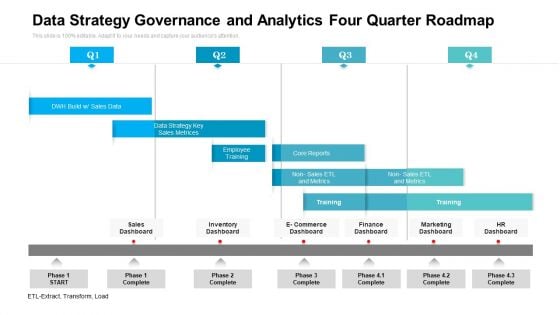
Data Strategy Governance And Analytics Four Quarter Roadmap Themes
Presenting our innovatively structured data strategy governance and analytics four quarter roadmap themes Template. Showcase your roadmap process in different formats like PDF, PNG, and JPG by clicking the download button below. This PPT design is available in both Standard Screen and Widescreen aspect ratios. It can also be easily personalized and presented with modified font size, font type, color, and shapes to measure your progress in a clear way.
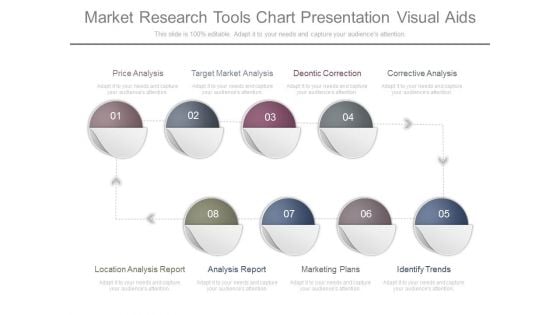
Market Research Tools Chart Presentation Visual Aids
This is a market research tools chart presentation visual aids. This is a eight stage process. The stages in this process are price analysis, target market analysis, deontic correction, corrective analysis, location analysis report, analysis report, marketing plans, identify trends.
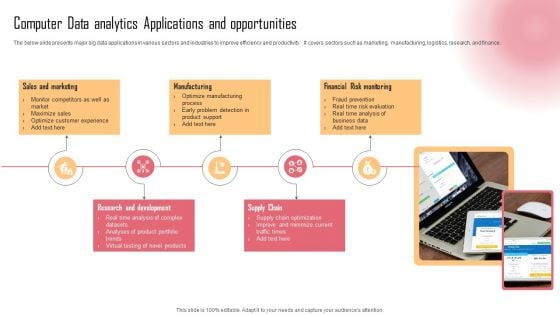
Computer Data Analytics Applications And Opportunities Demonstration PDF
The below slide presents major big data applications in various sectors and industries to improve efficiency and productivity. It covers sectors such as marketing, manufacturing, logistics, research, and finance. Presenting Computer Data Analytics Applications And Opportunities Demonstration PDF to dispense important information. This template comprises five stages. It also presents valuable insights into the topics including Sales And Marketing, Manufacturing, Financial Risk Monitoring . This is a completely customizable PowerPoint theme that can be put to use immediately. So, download it and address the topic impactfully.
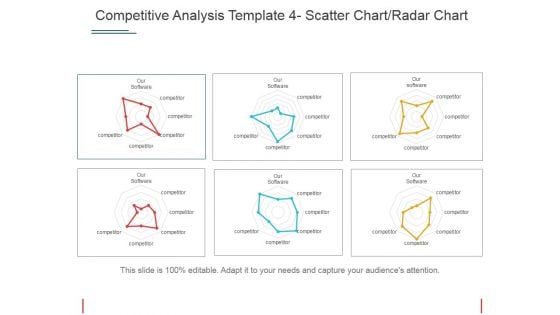
Competitive Analysis Scatter Chart Radar Chart Ppt PowerPoint Presentation Portfolio Templates
This is a competitive analysis scatter chart radar chart ppt powerpoint presentation portfolio templates. This is a eight stage process. The stages in this process are users interface, data import, example, pricing, support.
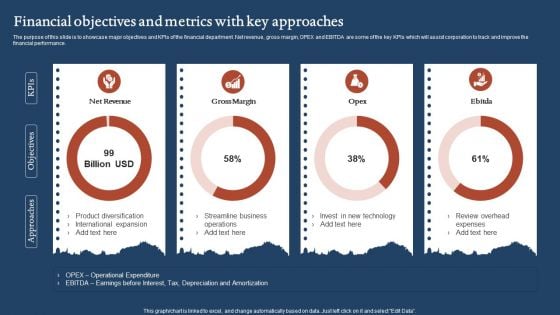
Financial Objectives And Metrics With Key Approaches Portrait PDF
The purpose of this slide is to showcase major objectives and KPIs of the financial department. Net revenue, gross margin, OPEX and EBITDA are some of the key KPIs which will assist corporation to track and improve the financial performance. Showcasing this set of slides titled Financial Objectives And Metrics With Key Approaches Portrait PDF. The topics addressed in these templates are Net Revenue, Gross Margin, Streamline Business. All the content presented in this PPT design is completely editable. Download it and make adjustments in color, background, font etc. as per your unique business setting.
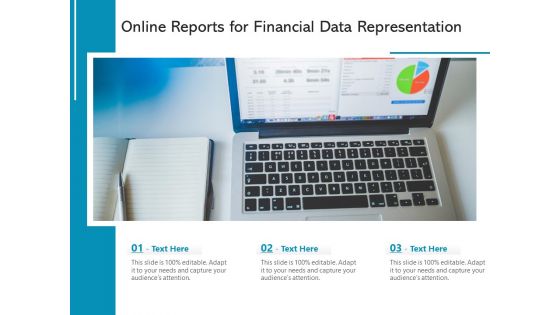
Online Reports For Financial Data Representation Ppt PowerPoint Presentation Professional Picture PDF
Presenting online reports for financial data representation ppt powerpoint presentation professional picture pdf to dispense important information. This template comprises three stages. It also presents valuable insights into the topics including online reports for financial data representation. This is a completely customizable PowerPoint theme that can be put to use immediately. So, download it and address the topic impactfully.
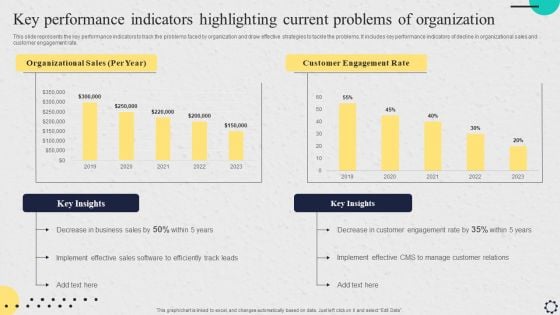
Software Implementation Strategy Key Performance Indicators Highlighting Current Problems Of Organization Professional PDF
This slide represents the key performance indicators to track the problems faced by organization and draw effective strategies to tackle the problems. It includes key performance indicators of decline in organizational sales and customer engagement rate. Make sure to capture your audiences attention in your business displays with our gratis customizable Software Implementation Strategy Key Performance Indicators Highlighting Current Problems Of Organization Professional PDF. These are great for business strategies, office conferences, capital raising or task suggestions. If you desire to acquire more customers for your tech business and ensure they stay satisfied, create your own sales presentation with these plain slides.
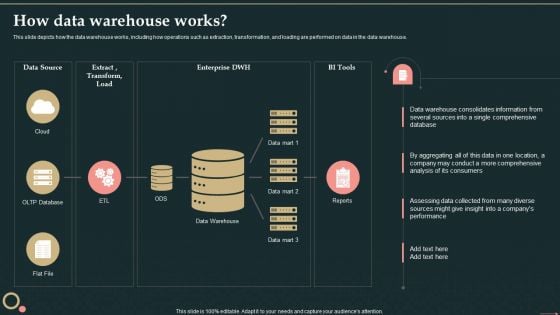
Management Information System How Data Warehouse Works Diagrams PDF
This slide depicts how the data warehouse works, including how operations such as extraction, transformation, and loading are performed on data in the data warehouse.Deliver an awe inspiring pitch with this creative Management Information System How Data Warehouse Works Diagrams PDF bundle. Topics like Data Warehouse, Consolidates Information, Single Comprehensive can be discussed with this completely editable template. It is available for immediate download depending on the needs and requirements of the user.
Business Diagram Creative Sign With Highway Sign Text Big Data Next Exit Ppt Slide
This diagram has been designed with graphic of magnifier and text boxes. These boxes are used to display creative sign and highway sign for big data analysis. This diagram can be used for data related topics in any presentation.
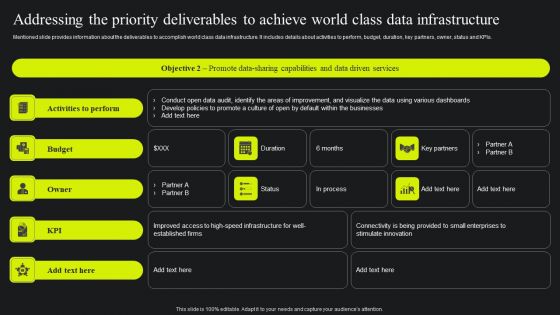
Addressing The Priority Deliverables To Achieve World Class Data Infrastructure Themes PDF
Mentioned slide provides information about the deliverables to accomplish world class data infrastructure. It includes details about activities to perform, budget, duration, key partners, owner, status and KPIs. Slidegeeks is one of the best resources for PowerPoint templates. You can download easily and regulate Addressing The Priority Deliverables To Achieve World Class Data Infrastructure Themes PDF for your personal presentations from our wonderful collection. A few clicks is all it takes to discover and get the most relevant and appropriate templates. Use our Templates to add a unique zing and appeal to your presentation and meetings. All the slides are easy to edit and you can use them even for advertisement purposes.
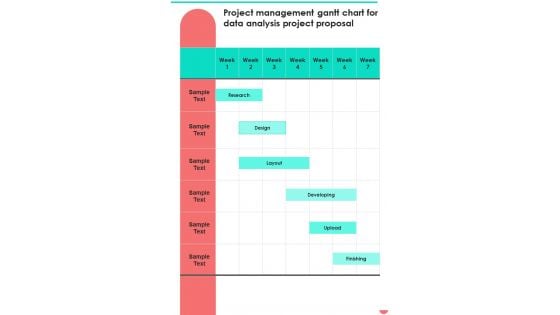
Project Management Gantt Chart For Data Analysis Project Proposal One Pager Sample Example Document
Presenting you an exemplary Project Management Gantt Chart For Data Analysis Project Proposal One Pager Sample Example Document. Our one-pager comprises all the must-have essentials of an inclusive document. You can edit it with ease, as its layout is completely editable. With such freedom, you can tweak its design and other elements to your requirements. Download this Project Management Gantt Chart For Data Analysis Project Proposal One Pager Sample Example Document brilliant piece now.
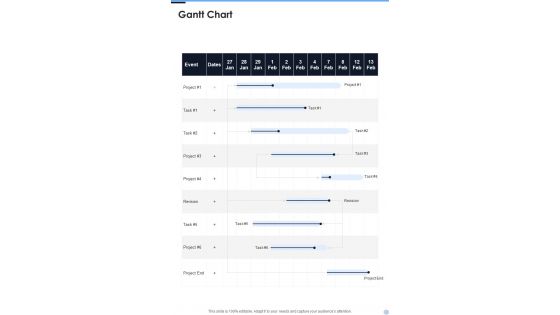
Gantt Chart Proposal For Data Analysis In Research Project One Pager Sample Example Document
Presenting you an exemplary Gantt Chart Proposal For Data Analysis In Research Project One Pager Sample Example Document. Our one-pager comprises all the must-have essentials of an inclusive document. You can edit it with ease, as its layout is completely editable. With such freedom, you can tweak its design and other elements to your requirements. Download this Gantt Chart Proposal For Data Analysis In Research Project One Pager Sample Example Document brilliant piece now.

Healthcare Marketing Data Management Ppt PowerPoint Presentation Complete Deck With Slides
This healthcare marketing data management ppt powerpoint presentation complete deck with slides acts as backup support for your ideas, vision, thoughts, etc. Use it to present a thorough understanding of the topic. This PPT slideshow can be utilized for both in-house and outside presentations depending upon your needs and business demands. Entailing twelve slides with a consistent design and theme, this template will make a solid use case. As it is intuitively designed, it suits every business vertical and industry. All you have to do is make a few tweaks in the content or any other component to design unique presentations. The biggest advantage of this complete deck is that it can be personalized multiple times once downloaded. The color, design, shapes, and other elements are free to modify to add personal touches. You can also insert your logo design in this PPT layout. Therefore a well-thought and crafted presentation can be delivered with ease and precision by downloading this healthcare marketing data management ppt powerpoint presentation complete deck with slides PPT slideshow.
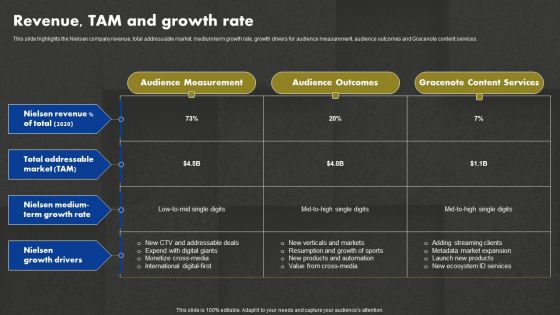
Data And Customer Analysis Company Outline Revenue TAM And Growth Rate Infographics PDF
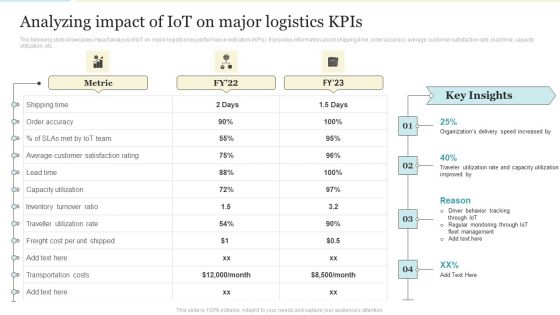
Analyzing Impact Of Iot On Major Logistics Kpis Themes PDF
The following slide showcases impact analysis of IoT on major logistics key performance indicators KPIs. It provides information about shipping time, order accuracy, average customer satisfaction rate, lead time, capacity utilization, etc. Deliver and pitch your topic in the best possible manner with this Analyzing Impact Of Iot On Major Logistics Kpis Themes PDF. Use them to share invaluable insights on Inventory Turnover Ratio, Capacity Utilization, Freight Cost and impress your audience. This template can be altered and modified as per your expectations. So, grab it now.
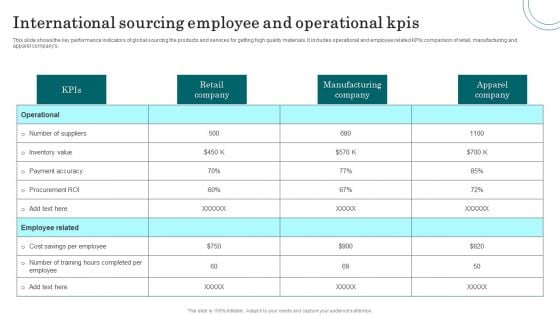
International Sourcing Employee And Operational Kpis Themes PDF
This slide shows the key performance indicators of global sourcing the products and services for getting high quality materials. It includes operational and employee related KPIs comparison of retail, manufacturing and apparel companys. Pitch your topic with ease and precision using this International Sourcing Employee And Operational Kpis Themes PDF. This layout presents information on Apparel Company, Manufacturing Company, Retail Company. It is also available for immediate download and adjustment. So, changes can be made in the color, design, graphics or any other component to create a unique layout.

 Home
Home