Dashboard Icon
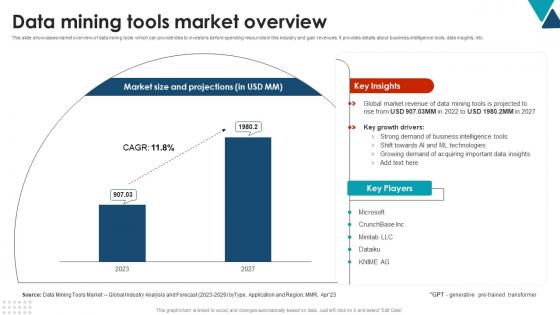
Data Mining Tools Market Overview Using Data Mining Tools To Optimize Processes AI SS V
This slide showcases market overview of data mining tools which can provide idea to investors before spending resources in this industry and gain revenues. It provides details about business intelligence tools, data insights, etc. The Data Mining Tools Market Overview Using Data Mining Tools To Optimize Processes AI SS V is a compilation of the most recent design trends as a series of slides. It is suitable for any subject or industry presentation, containing attractive visuals and photo spots for businesses to clearly express their messages. This template contains a variety of slides for the user to input data, such as structures to contrast two elements, bullet points, and slides for written information. Slidegeeks is prepared to create an impression. This slide showcases market overview of data mining tools which can provide idea to investors before spending resources in this industry and gain revenues. It provides details about business intelligence tools, data insights, etc.
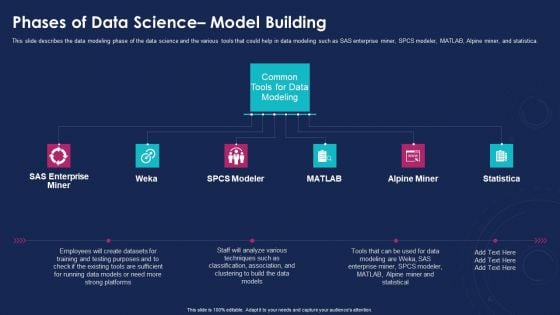
Data Analytics IT Phases Of Data Science Model Building Graphics PDF
This slide describes the data modeling phase of the data science and the various tools that could help in data modeling such as SAS enterprise miner, SPCS modeler, MATLAB, Alpine miner, and statistica. Presenting data analytics it phases of data science model building graphics pdf to provide visual cues and insights. Share and navigate important information on six stages that need your due attention. This template can be used to pitch topics like alpine miner, matlab, spcs modeler, weka, sas enterprise miner. In addtion, this PPT design contains high resolution images, graphics, etc, that are easily editable and available for immediate download.
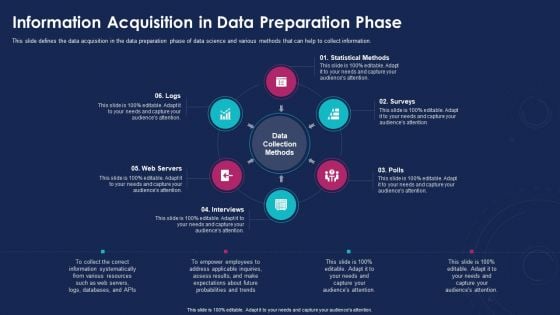
Data Analytics IT Information Acquisition In Data Preparation Phase Ppt Styles Aids PDF
This slide defines the data acquisition in the data preparation phase of data science and various methods that can help to collect information. Presenting data analytics it information acquisition in data preparation phase ppt styles aids pdf to provide visual cues and insights. Share and navigate important information on six stages that need your due attention. This template can be used to pitch topics like logs, web servers, interviews, polls, surveys. In addtion, this PPT design contains high resolution images, graphics, etc, that are easily editable and available for immediate download.
Data Analytics Information Acquisition In Data Preparation Phase Ppt Ideas Designs PDF
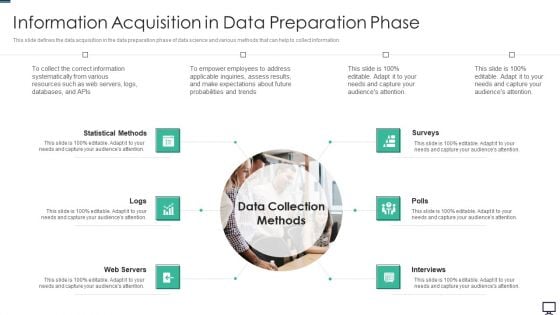
This slide defines the data acquisition in the data preparation phase of data science and various methods that can help to collect information. Presenting data analytics information acquisition in data preparation phase ppt ideas designs pdf to provide visual cues and insights. Share and navigate important information on six stages that need your due attention. This template can be used to pitch topics like statistical methods, web servers, interviews, surveys. In addtion, this PPT design contains high resolution images, graphics, etc, that are easily editable and available for immediate download.
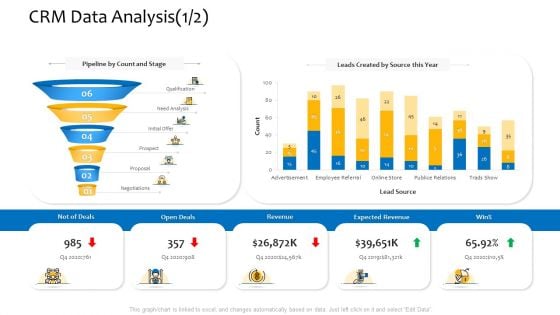
Customer Relationship Management Procedure CRM Data Analysis Need Analysis Brochure PDF
Deliver and pitch your topic in the best possible manner with this customer relationship management procedure CRM data analysis need analysis brochure pdf. Use them to share invaluable insights on pipeline by count and stage, need analysis, leads created by source this year, expected revenue, negotiations and impress your audience. This template can be altered and modified as per your expectations. So, grab it now.
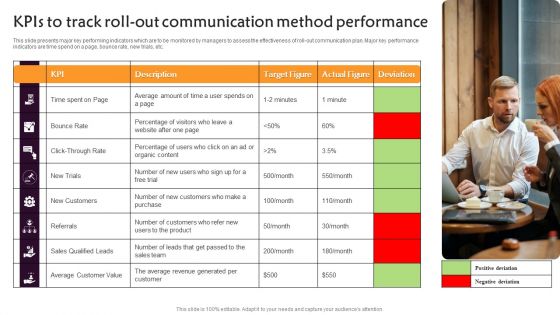
Kpis To Track Roll Out Communication Method Performance Demonstration PDF
This slide presents major key performing indicators which are to be monitored by managers to assess the effectiveness of roll-out communication plan. Major key performance indicators are time spend on a page, bounce rate, new trials, etc. Presenting Kpis To Track Roll Out Communication Method Performance Demonstration PDF to dispense important information. This template comprises one stages. It also presents valuable insights into the topics including Bounce Rate, New Trials, Referrals. This is a completely customizable PowerPoint theme that can be put to use immediately. So, download it and address the topic impactfully.
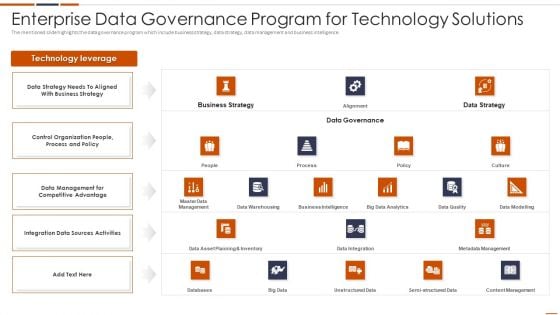
Enterprise Data Governance Program For Technology Solutions Themes PDF
The mentioned slide highlights the data governance program which include business strategy, data strategy, data management and business intelligence.Pitch your topic with ease and precision using this Enterprise Data Governance Program For Technology Solutions Themes PDF This layout presents information on Business Intelligence, Management For Competitive Advantage, Business Strategy It is also available for immediate download and adjustment. So, changes can be made in the color, design, graphics or any other component to create a unique layout.
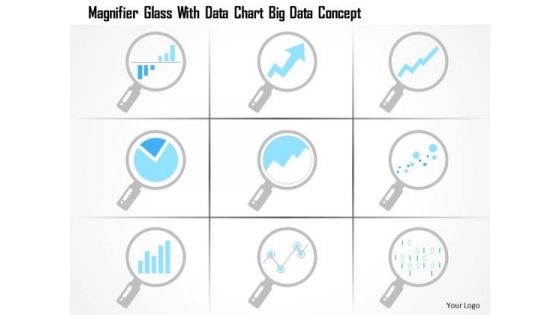
Business Diagram Magnifier Glass With Data Chart Big Data Concept Ppt Slide
This technology diagram has been designed with graphic of magnifier glass and big data chart. This diagram slide depicts the concept of data search. Use this diagram for your data search and focus related topics.
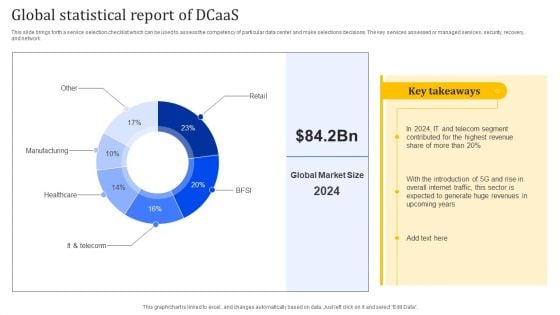
Global Statistical Report Of Dcaas Portrait PDF
This slide brings forth a service selection checklist which can be used to assess the competency of particular data center and make selections decisions. The key services assessed or managed services, security, recovery, and network. Showcasing this set of slides titled Global Statistical Report Of Dcaas Portrait PDF. The topics addressed in these templates are Manufacturing, Healthcare, Global Statistical. All the content presented in this PPT design is completely editable. Download it and make adjustments in color, background, font etc. as per your unique business setting.
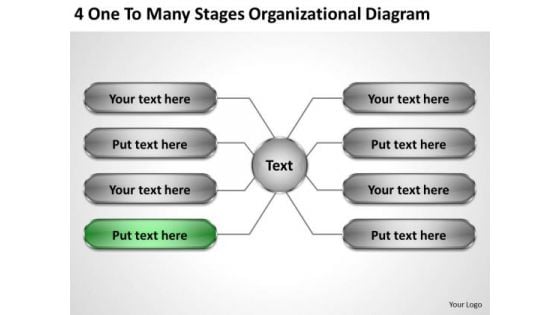
Sales Concepts 4 One To Many Stages Organizational Diagram Ppt Business Strategy Development
We present our sales concepts 4 one to many stages organizational diagram ppt business strategy development.Download our Business PowerPoint Templates because You are an avid believer in ethical practices. Highlight the benefits that accrue with our PowerPoint Templates and Slides. Download and present our Marketing PowerPoint Templates because our bewitching PowerPoint Templates and Slides will delight your audience with the magic of your words. Present our Finance PowerPoint Templates because You can Stir your ideas in the cauldron of our PowerPoint Templates and Slides. Cast a magic spell on your audience. Download and present our Circle Charts PowerPoint Templates because our PowerPoint Templates and Slides are the string of your bow. Fire of your ideas and conquer the podium. Download and present our Process and Flows PowerPoint Templates because You aspire to touch the sky with glory. Let our PowerPoint Templates and Slides provide the fuel for your ascent.Use these PowerPoint slides for presentations relating to diagram, process, plan, parts, vector, graph, business, boxes, wheel, network, statistics, item, junction, corporate, arrow, presentation, template, circle, brochure, data, report, marketing, different, management, multicolored, modern, illustration, three, pie, connection, chart, sphere, options, strategy, catalog, spherical, segments, schematic, tab, company, banner, menu, information, note, navigation, structure, communication. The prominent colors used in the PowerPoint template are Green, Gray, Black. Give your thoughts an artistic backing. Add on the craftsmanship of our Sales Concepts 4 One To Many Stages Organizational Diagram Ppt Business Strategy Development.
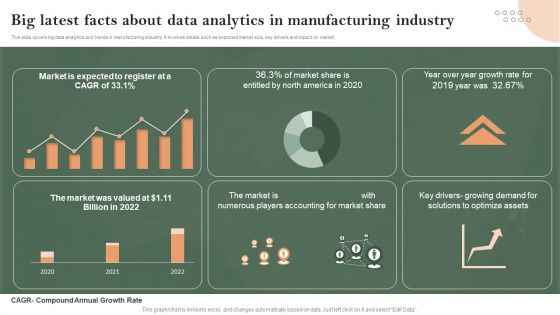
Big Latest Facts About Data Analytics In Manufacturing Industry Infographics PDF
This slide covers big data analytics and trends in manufacturing industry. It involves details such as expected market size, key drivers and impact on market. Pitch your topic with ease and precision using this Big Latest Facts About Data Analytics In Manufacturing Industry Infographics PDF. This layout presents information on Big Latest Facts, About Data Analytics, Manufacturing Industry. It is also available for immediate download and adjustment. So, changes can be made in the color, design, graphics or any other component to create a unique layout.
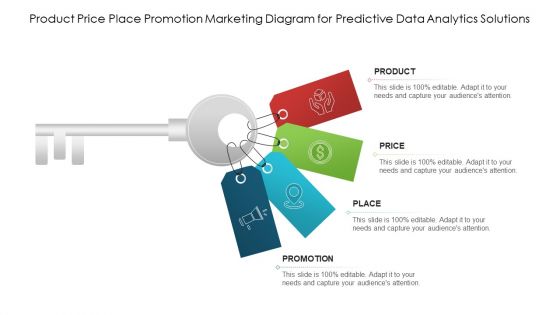
Product Price Place Promotion Marketing Diagram For Predictive Data Analytics Solutions Designs PDF
Presenting product price place promotion marketing diagram for predictive data analytics solutions designs pdf to dispense important information. This template comprises four stages. It also presents valuable insights into the topics including price, product, promotion. This is a completely customizable PowerPoint theme that can be put to use immediately. So, download it and address the topic impactfully.

Enterprise KPIS Diagram PowerPoint Topics
Presenting this set of slides with name enterprise kpis diagram powerpoint topics. This is a five stage process. The stages in this process are industry, financials, people, efficiency, corporate. This is a completely editable PowerPoint presentation and is available for immediate download. Download now and impress your audience.
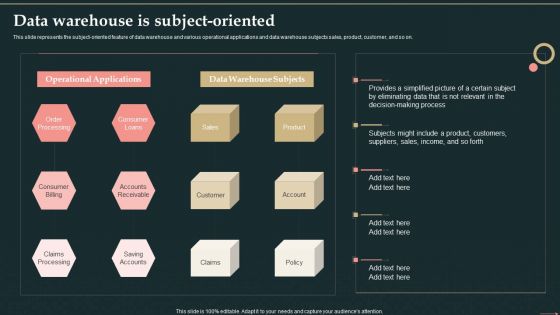
Management Information System Data Warehouse Is Subject Oriented Themes PDF
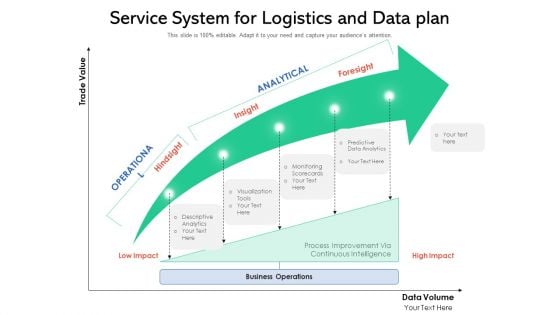
Service System For Logistics And Data Plan Ppt Pictures Graphic Images PDF
Presenting service system for logistics and data plan ppt pictures graphic images pdf to dispense important information. This template comprises one stage. It also presents valuable insights into the topics including business operations, monitoring, predictive data analytics. This is a completely customizable PowerPoint theme that can be put to use immediately. So, download it and address the topic impactfully.
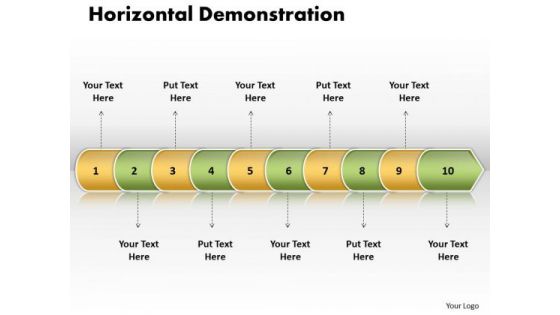
Ppt Linear Arrow 10 Phase Diagram PowerPoint Templates
PPT linear arrow 10 phase diagram PowerPoint Templates-Use this PowerPoint diagram to define basic work and data flow and quality management processes to increase efficiency of your business.-PPT linear arrow 10 phase diagram PowerPoint Templates-Arrow, Background, Collection, Completed, Concept, Confirmation, Design, Flow, Graph, Graphic, Illustration, Indication, Indicator, Information, Instruction, Interface, Internet, Layout, Measurement, Order, Phase, Pointer, Process, Progress, Reflection, Scale, Shape, Sign Start a company with our Ppt Linear Arrow 10 Phase Diagram PowerPoint Templates. Just download, type and present.
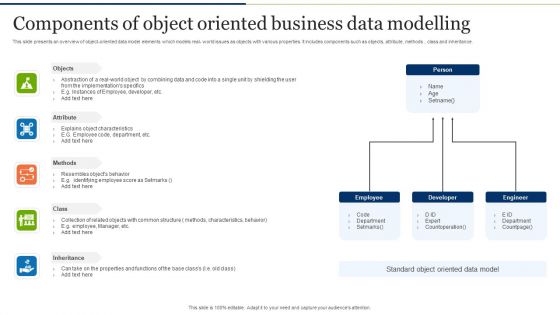
Components Of Object Oriented Business Data Modelling Themes PDF
Showcasing this set of slides titled Components Of Object Oriented Business Data Modelling Themes PDF. The topics addressed in these templates are Oriented Business, Data Modelling. All the content presented in this PPT design is completely editable. Download it and make adjustments in color, background, font etc. as per your unique business setting.
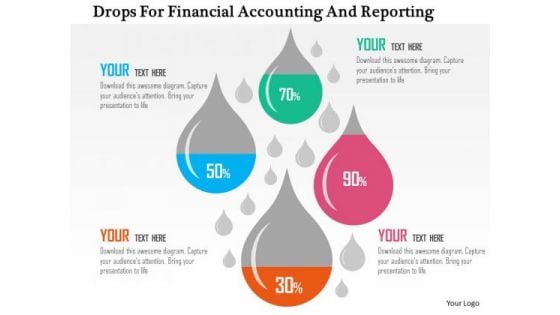
Business Diagram Drops For Financial Accounting And Reporting Presentation Template
This business diagram has been designed with drops displaying financial ratios. Download this diagram to depict financial and accounting ratios. Use this slide to build quality presentations for your viewers.
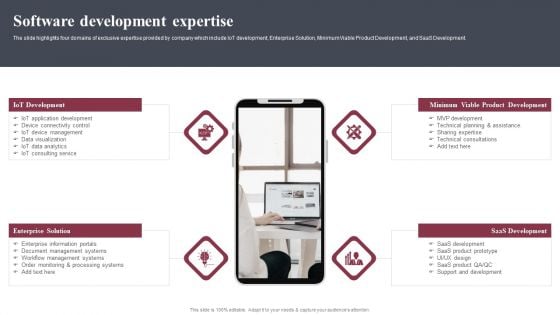
Business Software Development Company Profile Software Development Expertise Themes PDF
The slide highlights four domains of exclusive expertise provided by company which include IoT development, Enterprise Solution, Minimum Viable Product Development, and SaaS Development. Presenting Business Software Development Company Profile Software Development Expertise Themes PDF to provide visual cues and insights. Share and navigate important information on four stages that need your due attention. This template can be used to pitch topics like IoT Development, Enterprise Solution, Minimum Viable, Product Development. In addtion, this PPT design contains high resolution images, graphics, etc, that are easily editable and available for immediate download.
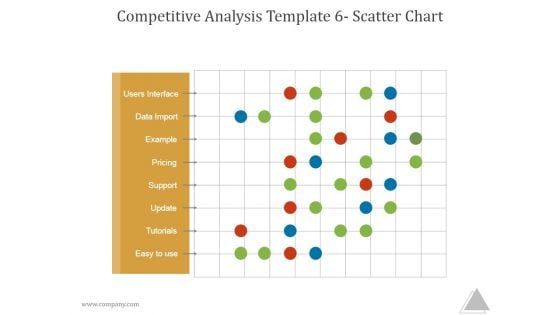
Competitive Analysis Template 6 Scatter Chart Ppt PowerPoint Presentation Shapes
This is a competitive analysis template 6 scatter chart ppt powerpoint presentation shapes. This is a one stage process. The stages in this process are users interface, data import, example, pricing, support update, tutorials, easy to use.
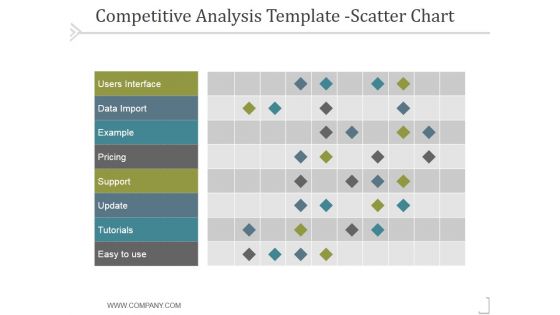
Competitive Analysis Scatter Chart Template 2 Ppt PowerPoint Presentation Files
This is a competitive analysis scatter chart template 2 ppt powerpoint presentation files. This is a nine stage process. The stages in this process are users interface, data import, example, pricing, support, update.
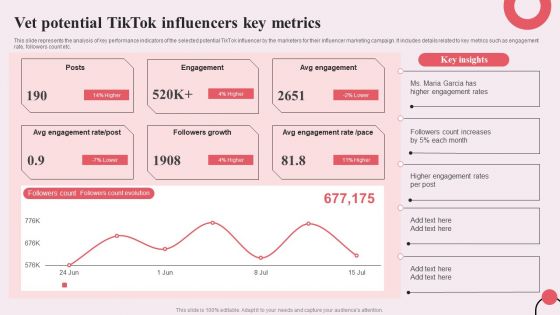
Tiktok Digital Marketing Campaign Vet Potential Tiktok Influencers Key Metrics Download PDF
This slide represents the analysis of key performance indicators of the selected potential TikTok influencer by the marketers for their influencer marketing campaign. It includes details related to key metrics such as engagement rate, followers count etc. Do you have to make sure that everyone on your team knows about any specific topic I yes, then you should give Tiktok Digital Marketing Campaign Vet Potential Tiktok Influencers Key Metrics Download PDF a try. Our experts have put a lot of knowledge and effort into creating this impeccable Tiktok Digital Marketing Campaign Vet Potential Tiktok Influencers Key Metrics Download PDF. You can use this template for your upcoming presentations, as the slides are perfect to represent even the tiniest detail. You can download these templates from the Slidegeeks website and these are easy to edit. So grab these today
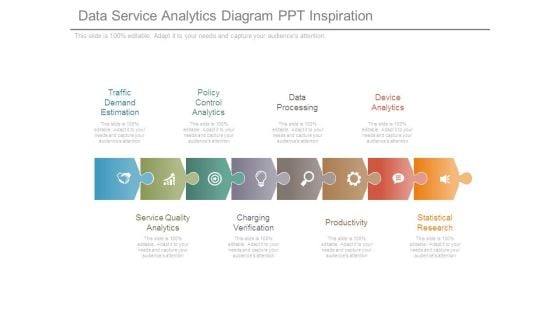
Data Service Analytics Diagram Ppt Inspiration
This is a data service analytics diagram ppt inspiration. This is a eight stage process. The stages in this process are traffic demand estimation, policy control analytics, data processing, device analytics, service quality analytics, charging verification, productivity, statistical research.
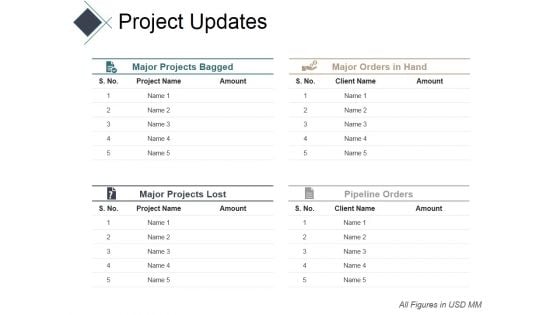
Project Updates Ppt PowerPoint Presentation Ideas Diagrams
This is a project updates ppt powerpoint presentation ideas diagrams. This is a four stage process. The stages in this process are major projects bagged, major orders in hand, major projects lost, pipeline orders.

Analysing Business Monthly Sales Revenue Report Strategic Approaches To Corporate Financial
This slide showcases the sales revenue report in order to monitor, analyze and track monthly sales trends. Key reasons for the decline include new competitors in the market, unable to adopt new technology, and production haltered. Boost your pitch with our creative Analysing Business Monthly Sales Revenue Report Strategic Approaches To Corporate Financial. Deliver an awe-inspiring pitch that will mesmerize everyone. Using these presentation templates you will surely catch everyones attention. You can browse the ppts collection on our website. We have researchers who are experts at creating the right content for the templates. So you do not have to invest time in any additional work. Just grab the template now and use them. This slide showcases the sales revenue report in order to monitor, analyze and track monthly sales trends. Key reasons for the decline include new competitors in the market, unable to adopt new technology, and production haltered.
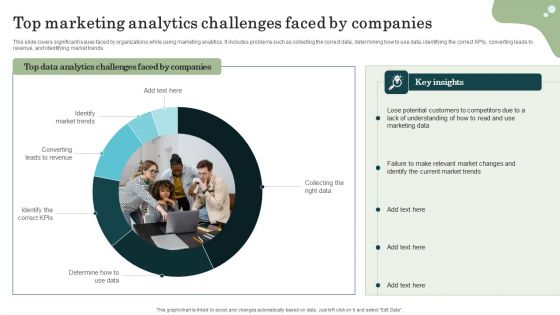
Marketing Success Metrics Top Marketing Analytics Challenges Faced By Inspiration PDF
This slide covers significant issues faced by organizations while using marketing analytics. It includes problems such as collecting the correct data, determining how to use data, identifying the correct KPIs, converting leads to revenue, and identifying market trends. Boost your pitch with our creative Marketing Success Metrics Top Marketing Analytics Challenges Faced By Inspiration PDF. Deliver an awe-inspiring pitch that will mesmerize everyone. Using these presentation templates you will surely catch everyones attention. You can browse the ppts collection on our website. We have researchers who are experts at creating the right content for the templates. So you dont have to invest time in any additional work. Just grab the template now and use them.
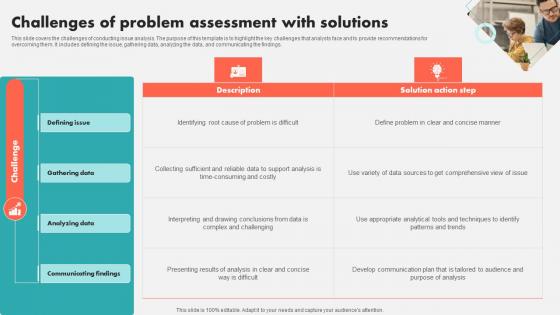
Challenges Of Problem Assessment With Solutions Diagrams Pdf
This slide covers the challenges of conducting issue analysis. The purpose of this template is to highlight the key challenges that analysts face and to provide recommendations for overcoming them. It includes defining the issue, gathering data, analyzing the data, and communicating the findings.Pitch your topic with ease and precision using this Challenges Of Problem Assessment With Solutions Diagrams Pdf This layout presents information on Communicating Findings, Analyzing Data, Gathering Data It is also available for immediate download and adjustment. So, changes can be made in the color, design, graphics or any other component to create a unique layout. This slide covers the challenges of conducting issue analysis. The purpose of this template is to highlight the key challenges that analysts face and to provide recommendations for overcoming them. It includes defining the issue, gathering data, analyzing the data, and communicating the findings.
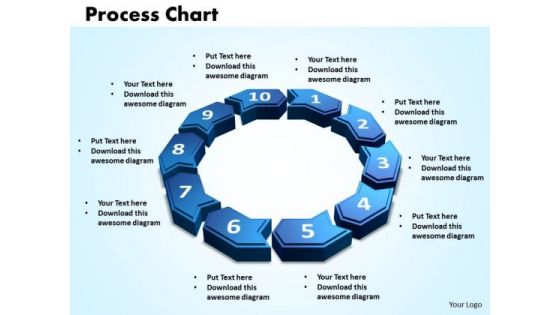
PowerPoint Slides Process Charts Success Ppt Presentation
PowerPoint Slides process charts Success PPT Presentation-More than one sector can be presented with this power point slides. This PPT presentation can be used to present the data of a complete year to the audience-Chart, circle, circular, circulation, concept, connection, continuity, correlate, course, cycle, cyclic, diagram, direction, duplicate, flow, four, iterate, manage, method, presentation, procedure, process, recycle, refresh, relate, repeat, repetition, report, review, ring, rotation, round, sequence, simple, stage, step, strategy, success, system, work flow-PowerPoint Slides process charts Success PPT Presentation Get a close look at our excellent PowerPoint Slides Process Charts Success Ppt Presentation. Just ask your mouse to 'go fetch 'em'.
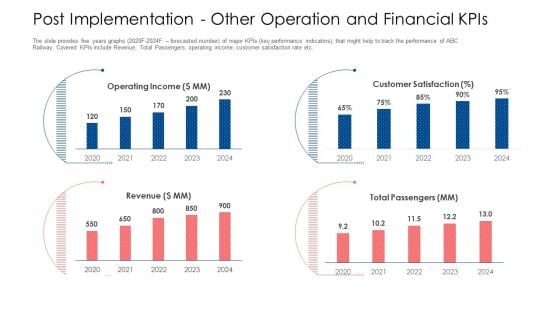
Post Implementation Other Operation And Financial Kpis Ppt Infographic Template PDF
The slide provides five years graphs 2020F-2024F forecasted number of major KPIs key performance indicators, that might help to track the performance of ABC Railway. Covered KPIs include Revenue, Total Passengers, operating income, customer satisfaction rate etc. Deliver an awe inspiring pitch with this creative post implementation other operation and financial kpis ppt infographic template pdf bundle. Topics like operating income, revenue, customer satisfaction can be discussed with this completely editable template. It is available for immediate download depending on the needs and requirements of the user.
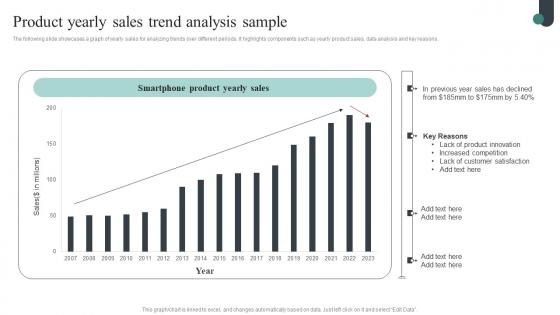
Competitive Intelligence Guide To Determine Market Product Yearly Sales Trend Download Pdf
The following slide showcases a graph of yearly sales for analyzing trends over different periods. It highlights components such as yearly product sales, data analysis and key reasons. This modern and well-arranged Competitive Intelligence Guide To Determine Market Product Yearly Sales Trend Download Pdf provides lots of creative possibilities. It is very simple to customize and edit with the Powerpoint Software. Just drag and drop your pictures into the shapes. All facets of this template can be edited with Powerpoint no extra software is necessary. Add your own material, put your images in the places assigned for them, adjust the colors, and then you can show your slides to the world, with an animated slide included. The following slide showcases a graph of yearly sales for analyzing trends over different periods. It highlights components such as yearly product sales, data analysis and key reasons.
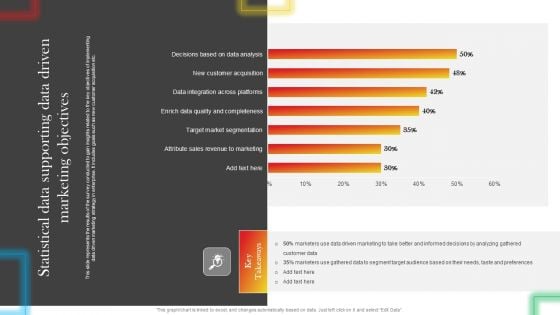
Statistical Data Supporting Data Driven Marketing Objectives Summary PDF
This slide represents the results of the survey conducted to gain insights related to the key objectives of implementing data driven marketing strategy in enterprise. It includes goals such as new customer acquisition etc. Are you in need of a template that can accommodate all of your creative concepts This one is crafted professionally and can be altered to fit any style. Use it with Google Slides or PowerPoint. Include striking photographs, symbols, depictions, and other visuals. Fill, move around, or remove text boxes as desired. Test out color palettes and font mixtures. Edit and save your work, or work with colleagues. Download Statistical Data Supporting Data Driven Marketing Objectives Summary PDF and observe how to make your presentation outstanding. Give an impeccable presentation to your group and make your presentation unforgettable.
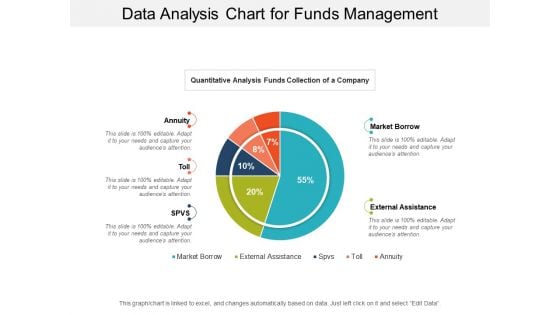
Data Analysis Chart For Funds Management Ppt PowerPoint Presentation Infographic Template Files
This is a data analysis chart for funds management ppt powerpoint presentation infographic template files. This is a five stage process. The stages in this process are financial analysis, quantitative, statistical modelling.
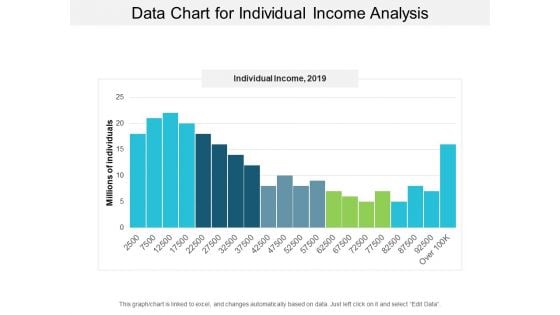
Data Chart For Individual Income Analysis Ppt PowerPoint Presentation Layouts Visual Aids
This is a data chart for individual income analysis ppt powerpoint presentation layouts visual aids. This is a five stage process. The stages in this process are financial analysis, quantitative, statistical modelling.
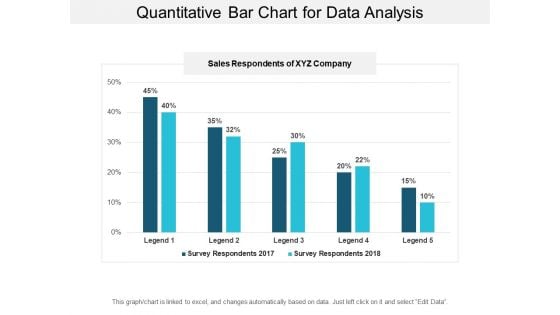
Quantitative Bar Chart For Data Analysis Ppt PowerPoint Presentation Model Graphic Tips
This is a quantitative bar chart for data analysis ppt powerpoint presentation model graphic tips. This is a two stage process. The stages in this process are financial analysis, quantitative, statistical modelling.
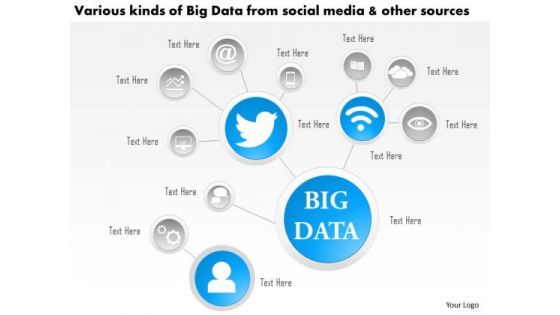
Business Diagram Various Kinds Of Big Data From Social Media And Other Sources Ppt Slide
This technology diagram contains the concept of big data analysis. This slide depicts various kinds of social media and other sources. Use this diagram for mobile and communication related presentations.
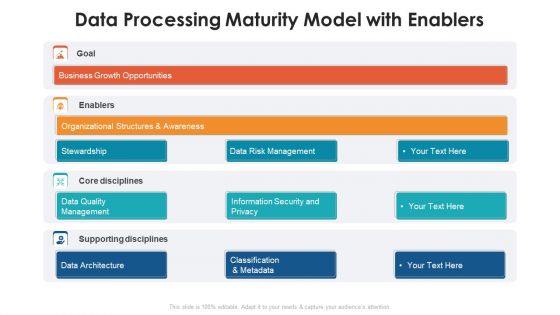
Data Processing Maturity Model With Enablers Themes PDF
Showcasing this set of slides titled data processing maturity model with enablers themes pdf. The topics addressed in these templates are goal, awareness, management. All the content presented in this PPT design is completely editable. Download it and make adjustments in color, background, font etc. as per your unique business setting.
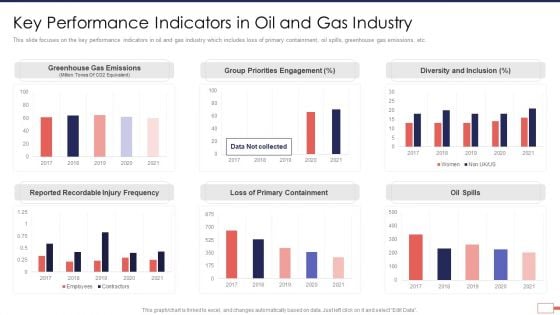
Iot Digital Twin Technology Post Covid Expenditure Management Key Performance Indicators Background PDF
This slide focuses on the key performance indicators in oil and gas industry which includes loss of primary containment, oil spills, greenhouse gas emissions, etc. Deliver an awe inspiring pitch with this creative iot digital twin technology post covid expenditure management key performance indicators background pdf bundle. Topics like key performance indicators in oil and gas industry can be discussed with this completely editable template. It is available for immediate download depending on the needs and requirements of the user.
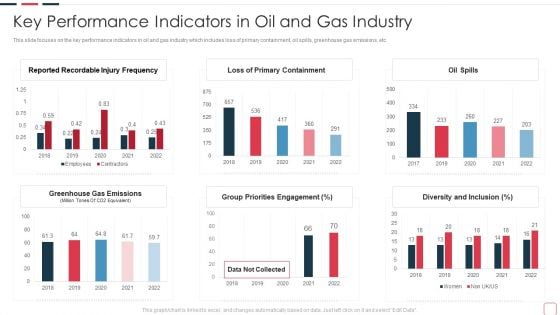
Price Benefit Internet Things Digital Twins Execution After Covid Key Performance Indicators In Oil Slides PDF
This slide focuses on the key performance indicators in oil and gas industry which includes loss of primary containment, oil spills, greenhouse gas emissions, etc. Deliver an awe inspiring pitch with this creative price benefit internet things digital twins execution after covid key performance indicators in oil slides pdf bundle. Topics like key performance indicators in oil and gas industry can be discussed with this completely editable template. It is available for immediate download depending on the needs and requirements of the user.
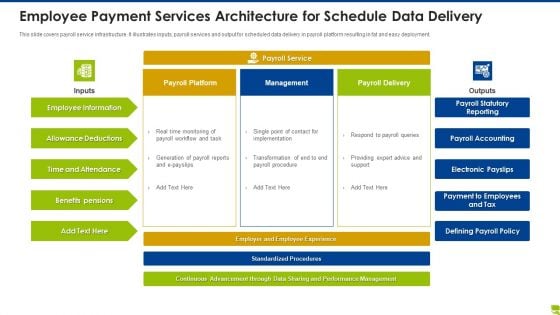
Employee Payment Services Architecture For Schedule Data Delivery Themes PDF
This slide covers payroll service infrastructure. It illustrates inputs, payroll services and output for scheduled data delivery in payroll platform resulting in fat and easy deployment. Showcasing this set of slides titled employee payment services architecture for schedule data delivery themes pdf. The topics addressed in these templates are employee information, allowance deductions, time and attendance, benefits pensions. All the content presented in this PPT design is completely editable. Download it and make adjustments in color, background, font etc. as per your unique business setting.
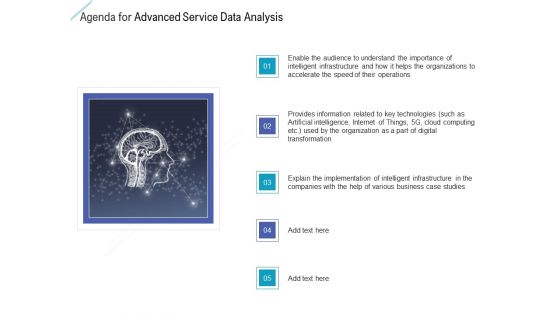
Agenda For Advanced Service Data Analysis Introduction PDF
This is a agenda for advanced service data analysis introduction pdf template with various stages. Focus and dispense information on five stages using this creative set, that comes with editable features. It contains large content boxes to add your information on topics like agenda for advanced service data analysis. You can also showcase facts, figures, and other relevant content using this PPT layout. Grab it now.
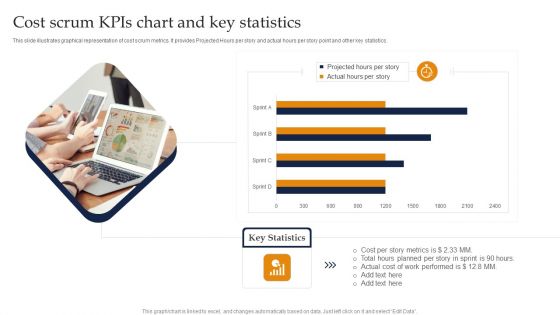
Cost Scrum Kpis Chart And Key Statistics Ppt Layouts Example Introduction PDF
This slide illustrates graphical representation of cost scrum metrics. It provides Projected Hours per story and actual hours per story point and other key statistics. Pitch your topic with ease and precision using this Cost Scrum Kpis Chart And Key Statistics Ppt Layouts Example Introduction PDF. This layout presents information on Projected Hours, Cost Per Story, Metrics, Actual Cost. It is also available for immediate download and adjustment. So, changes can be made in the color, design, graphics or any other component to create a unique layout.
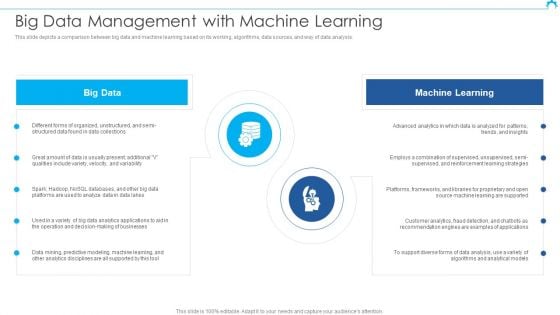
Big Data Architect Big Data Management With Machine Learning Diagrams PDF
This slide depicts a comparison between big data and machine learning based on its working, algorithms, data sources, and way of data analysis.Deliver an awe inspiring pitch with this creative Big Data Architect Big Data Management With Machine Learning Diagrams PDF bundle. Topics like Different Forms, Organized Unstructured, Found Collections can be discussed with this completely editable template. It is available for immediate download depending on the needs and requirements of the user.
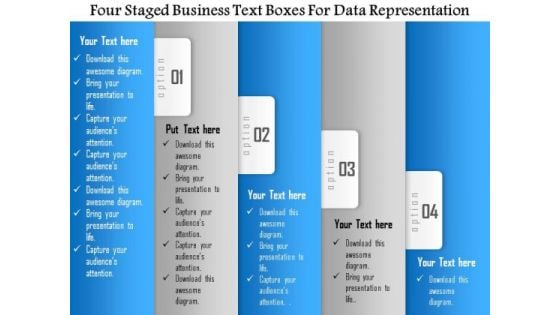
Business Diagram Four Staged Business Text Boxes For Data Representation Presentation Template
Four staged business text boxes are used to design this Power Point template slide. This PPT slide contains the concept of data representation. Use this PPT slide for your business and sales data analysis related topics in any presentation.
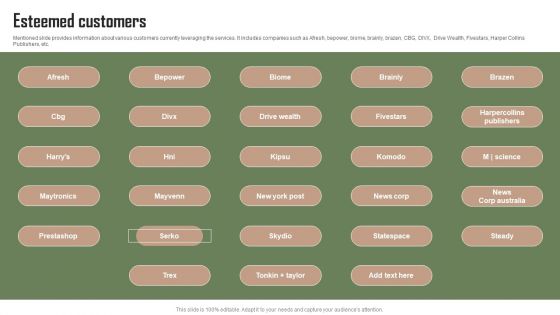
Data Automation Solution Investor Funding Presentation Esteemed Customers Themes PDF
Mentioned slide provides information about various customers currently leveraging the services. It includes companies such as Afresh, bepower, biome, brainly, brazen, CBG, DIVX, Drive Wealth, Fivestars, Harper Collins Publishers, etc. Do you have to make sure that everyone on your team knows about any specific topic I yes, then you should give Data Automation Solution Investor Funding Presentation Esteemed Customers Themes PDF a try. Our experts have put a lot of knowledge and effort into creating this impeccable Data Automation Solution Investor Funding Presentation Esteemed Customers Themes PDF. You can use this template for your upcoming presentations, as the slides are perfect to represent even the tiniest detail. You can download these templates from the Slidegeeks website and these are easy to edit. So grab these today.
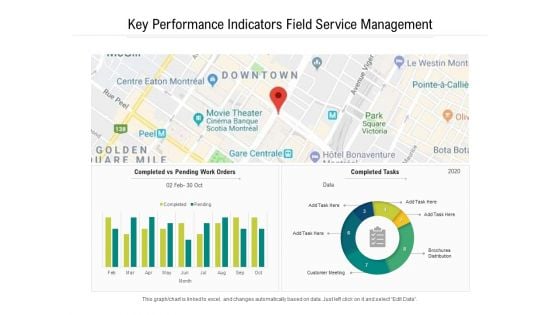
Key Performance Indicators Field Service Management Ppt PowerPoint Presentation Gallery Rules PDF
Presenting this set of slides with name key performance indicators field service management ppt powerpoint presentation gallery rules pdf. The topics discussed in these slide is key performance indicators field service management. This is a completely editable PowerPoint presentation and is available for immediate download. Download now and impress your audience.
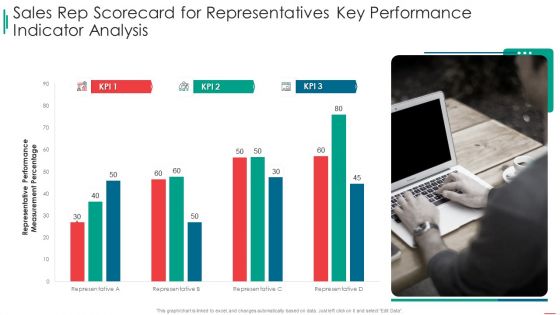
Sales Rep Scorecard Sales Rep Scorecard For Representatives Key Performance Indicator Analysis Portrait PDF
Deliver an awe inspiring pitch with this creative sales rep scorecard sales rep scorecard for representatives key performance indicator analysis portrait pdf bundle. Topics like sales rep scorecard for representatives key performance indicator analysis can be discussed with this completely editable template. It is available for immediate download depending on the needs and requirements of the user.
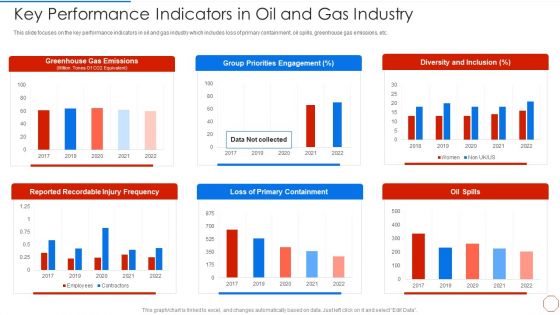
Minimizing Operational Cost Through Iot Virtual Twins Implementation Key Performance Indicators Slides PDF
Deliver and pitch your topic in the best possible manner with this minimizing operational cost through iot virtual twins implementation key performance indicators slides pdf. Use them to share invaluable insights on key performance indicators in oil and gas industry and impress your audience. This template can be altered and modified as per your expectations. So, grab it now.
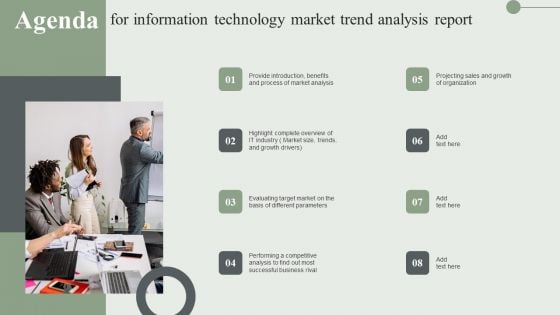
Agenda For Information Technology Market Trend Analysis Report Ppt PowerPoint Presentation File Diagrams PDF
Retrieve professionally designed Agenda For Information Technology Market Trend Analysis Report Ppt PowerPoint Presentation File Diagrams PDF to effectively convey your message and captivate your listeners. Save time by selecting pre made slideshows that are appropriate for various topics, from business to educational purposes. These themes come in many different styles, from creative to corporate, and all of them are easily adjustable and can be edited quickly. Access them as PowerPoint templates or as Google Slides themes. You do not have to go on a hunt for the perfect presentation because Slidegeeks got you covered from everywhere.
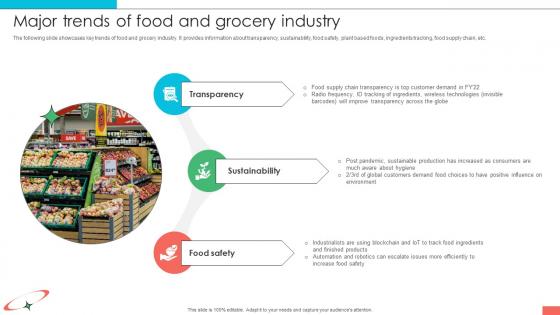
Marketing Strategies For Effective Major Trends Of Food And Grocery Industry
The following slide showcases key trends of food and grocery industry. It provides information about transparency, sustainability, food safety, plant based foods, ingredients tracking, food supply chain, etc. Are you searching for a Marketing Strategies For Effective Major Trends Of Food And Grocery Industry that is uncluttered, straightforward, and original Its easy to edit, and you can change the colors to suit your personal or business branding. For a presentation that expresses how much effort you have put in, this template is ideal With all of its features, including tables, diagrams, statistics, and lists, its perfect for a business plan presentation. Make your ideas more appealing with these professional slides. Download Marketing Strategies For Effective Major Trends Of Food And Grocery Industry from Slidegeeks today. The following slide showcases key trends of food and grocery industry. It provides information about transparency, sustainability, food safety, plant based foods, ingredients tracking, food supply chain, etc.
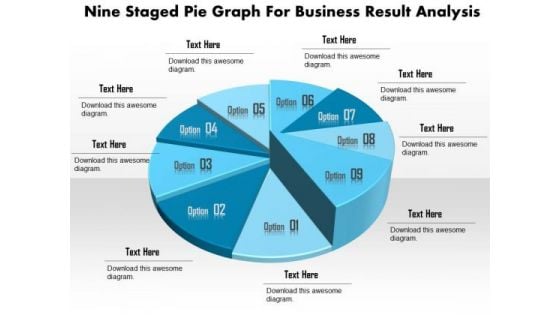
Business Diagram Nine Staged Pie Graph For Business Result Analysis Presentation Template
This business slide displays nine staged pie chart. This diagram is a data visualization tool that gives you a simple way to present statistical information. This slide helps your audience examine and interpret the data you present.
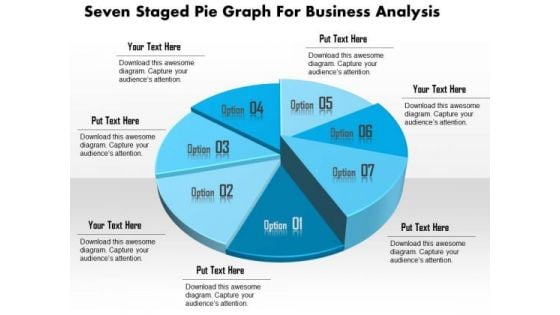
Business Diagram Seven Staged Pie Graph For Business Analysis Presentation Template
This business slide displays seven staged pie chart. This diagram is a data visualization tool that gives you a simple way to present statistical information. This slide helps your audience examine and interpret the data you present.
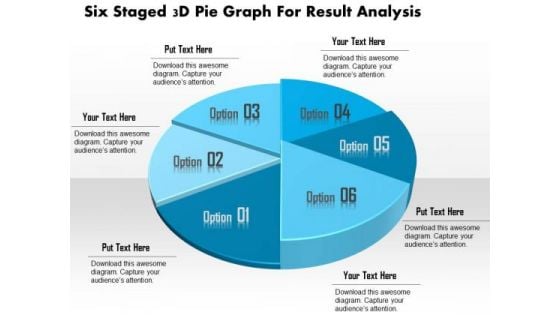
Business Diagram Six Staged 3d Pie Graph For Result Analysis Presentation Template
This business slide displays six staged pie chart. This diagram is a data visualization tool that gives you a simple way to present statistical information. This slide helps your audience examine and interpret the data you present.
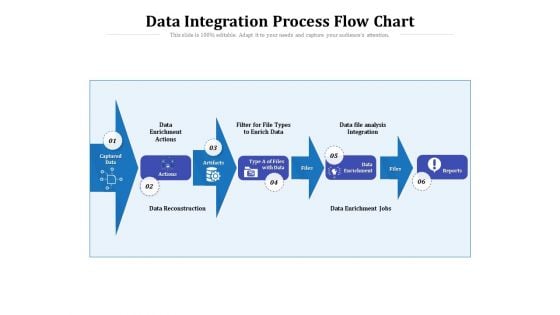
Data Integration Process Flow Chart Ppt PowerPoint Presentation File Templates PDF
Presenting this set of slides with name data integration process flow chart ppt powerpoint presentation file templates pdf. This is a six stage process. The stages in this process are actions, integration, analysis. This is a completely editable PowerPoint presentation and is available for immediate download. Download now and impress your audience.
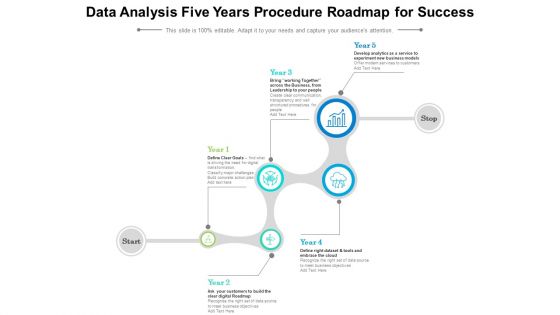
Data Analysis Five Years Procedure Roadmap For Success Slides
We present our data analysis five years procedure roadmap for success slides. This PowerPoint layout is easy to edit so you can change the font size, font type, color, and shape conveniently. In addition to this, the PowerPoint layout is Google Slides compatible, so you can share it with your audience and give them access to edit it. Therefore, download and save this well researched data analysis five years procedure roadmap for success slides in different formats like PDF, PNG, and JPG to smoothly execute your business plan.
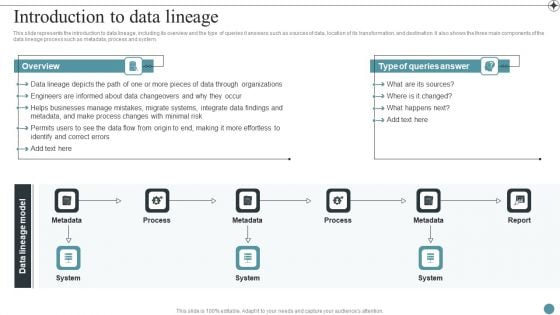
Introduction To Data Lineage Deploying Data Lineage IT Demonstration PDF
This slide talks about the key areas where data lineage can have a significant impact and help businesses to fix errors. It includes strategic decision-making, data governance, data migration and optimal use of new and old data sets.Are you searching for a Introduction To Data Lineage Deploying Data Lineage IT Demonstration PDF that is uncluttered, straightforward, and original Its easy to edit, and you can change the colors to suit your personal or business branding. For a presentation that expresses how much effort you ve put in, this template is ideal With all of its features, including tables, diagrams, statistics, and lists, its perfect for a business plan presentation. Make your ideas more appealing with these professional slides. Download Introduction To Data Lineage Deploying Data Lineage IT Demonstration PDF from Slidegeeks today.
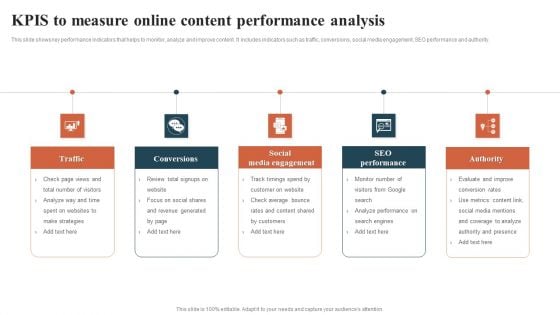
KPIS To Measure Online Content Performance Analysis Template PDF
This slide shows key performance indicators that helps to monitor, analyze and improve content. It includes indicators such as traffic, conversions, social media engagement, SEO performance and authority. Presenting KPIS To Measure Online Content Performance Analysis Template PDF to dispense important information. This template comprises Five stages. It also presents valuable insights into the topics including Social Media Engagement, SEO Performance, Authority. This is a completely customizable PowerPoint theme that can be put to use immediately. So, download it and address the topic impactfully.
8 Stages Concentric Data Flow Diagram Ppt Business Plan Marketing PowerPoint Slides
We present our 8 stages concentric data flow diagram ppt business plan marketing PowerPoint Slides.Download and present our Business PowerPoint Templates because Our PowerPoint Templates and Slides will give you great value for your money. Be assured of finding the best projection to highlight your words. Present our Circle Charts PowerPoint Templates because It will Give impetus to the hopes of your colleagues. Our PowerPoint Templates and Slides will aid you in winning their trust. Download and present our Signs PowerPoint Templates because It can Bubble and burst with your ideas. Use our Shapes PowerPoint Templates because Our PowerPoint Templates and Slides will definately Enhance the stature of your presentation. Adorn the beauty of your thoughts with their colourful backgrounds. Download our Metaphors-Visual Concepts PowerPoint Templates because You can Connect the dots. Fan expectations as the whole picture emerges.Use these PowerPoint slides for presentations relating to radial, concentric, shine, pipe, line, environmental, circle, rendered, plastic, striped, shape, abstract, object, shiny, reflective, capsule, stripe, background, border, ecological, repetition. The prominent colors used in the PowerPoint template are Blue, Black, Gray. Soak in the luxury our 8 Stages Concentric Data Flow Diagram Ppt Business Plan Marketing PowerPoint Slides provide. They offer top class and exclusive service.
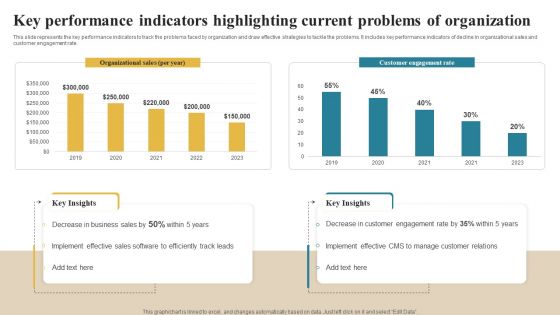
Software Implementation Technique Key Performance Indicators Highlighting Current Problems Elements PDF
This slide represents the key performance indicators to track the problems faced by organization and draw effective strategies to tackle the problems. It includes key performance indicators of decline in organizational sales and customer engagement rate. Make sure to capture your audiences attention in your business displays with our gratis customizable Software Implementation Technique Key Performance Indicators Highlighting Current Problems Elements PDF. These are great for business strategies, office conferences, capital raising or task suggestions. If you desire to acquire more customers for your tech business and ensure they stay satisfied, create your own sales presentation with these plain slides.
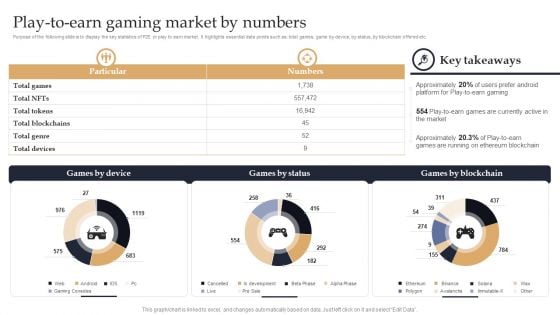
Web 3 0 Blockchain Based P2E Mobile Game Sector Report Promotional Plan Play To Earn Gaming Market By Numbers Summary PDF
Purpose of the following slide is to display the key statistics of P2E or play to earn market. It highlights essential data points such as total games, game by device, by status, by blockchain offered etc. Coming up with a presentation necessitates that the majority of the effort goes into the content and the message you intend to convey. The visuals of a PowerPoint presentation can only be effective if it supplements and supports the story that is being told. Keeping this in mind our experts created Web 3 0 Blockchain Based P2E Mobile Game Sector Report Promotional Plan Play To Earn Gaming Market By Numbers Summary PDF to reduce the time that goes into designing the presentation. This way, you can concentrate on the message while our designers take care of providing you with the right template for the situation.
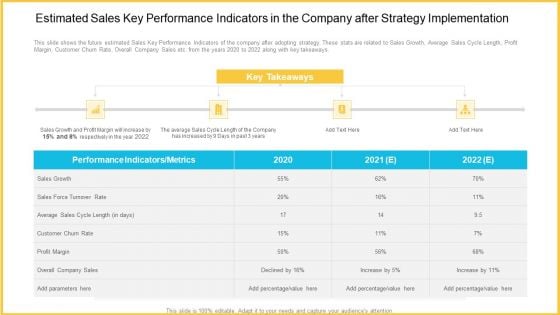
Estimated Sales Key Performance Indicators In The Company After Strategy Implementation Diagrams PDF
This slide shows the future estimated Sales Key Performance Indicators of the company after adopting strategy. These stats are related to Sales Growth, Average Sales Cycle Length, Profit Margin, Customer Churn Rate, Overall Company Sales etc. from the years 2020 to 2022 along with key takeaways. Deliver an awe-inspiring pitch with this creative estimated sales key performance indicators in the company after strategy implementation diagrams pdf. bundle. Topics like sales growth, sales force turnover rate, customer churn rate, profit margin, overall company sales can be discussed with this completely editable template. It is available for immediate download depending on the needs and requirements of the user.

 Home
Home