Dashboard Icon
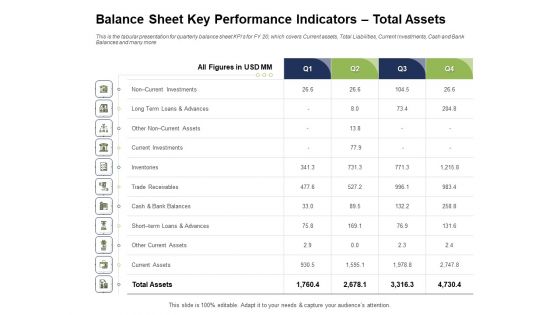
Ways To Bounce Back From Insolvency Balance Sheet Key Performance Indicators Total Assets Diagrams PDF
Presenting this set of slides with name ways to bounce back from insolvency balance sheet key performance indicators total assets diagrams pdf. The topics discussed in these slides are investments, trade receivables, current assets, inventories. This is a completely editable PowerPoint presentation and is available for immediate download. Download now and impress your audience.
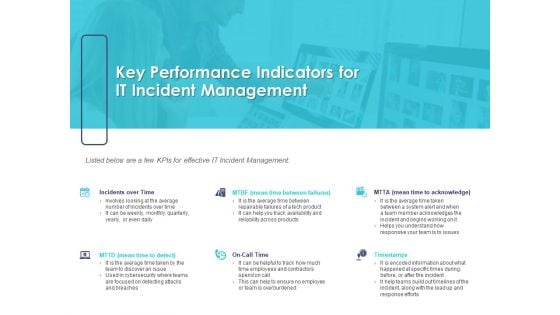
Managing ITIL Incidents Planning Key Performance Indicators For IT Incident Management Diagrams PDF
Presenting this set of slides with name managing itil incidents planning key performance indicators for it incident management diagrams pdf. This is a six stage process. The stages in this process are management, effective, acknowledge, cybersecurity. This is a completely editable PowerPoint presentation and is available for immediate download. Download now and impress your audience.
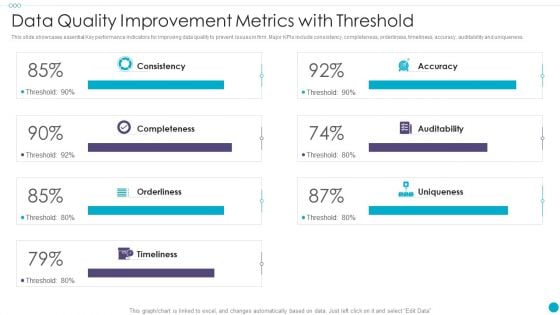
Data Quality Improvement Metrics With Threshold Formats PDF
This slide showcases essential Key performance indicators for improving data quality to prevent issues in firm. Major KPIs include consistency, completeness, orderliness, timeliness, accuracy, auditability and uniqueness. Pitch your topic with ease and precision using this Data Quality Improvement Metrics With Threshold Formats PDF This layout presents information on Auditability, Completeness, Consistency It is also available for immediate download and adjustment. So, changes can be made in the color, design, graphics or any other component to create a unique layout.
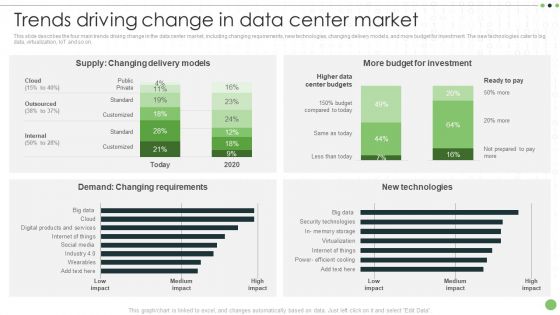
Different Categories Of Data Centers Trends Driving Change In Data Center Market Background PDF
This slide describes the four main trends driving change in the data center market, including changing requirements, new technologies, changing delivery models, and more budget for investment. The new technologies cater to big data, virtualization, IoT and so on. Do you know about Slidesgeeks Different Categories Of Data Centers Trends Driving Change In Data Center Market Background PDF These are perfect for delivering any kind od presentation. Using it, create PowerPoint presentations that communicate your ideas and engage audiences. Save time and effort by using our pre-designed presentation templates that are perfect for a wide range of topic. Our vast selection of designs covers a range of styles, from creative to business, and are all highly customizable and easy to edit. Download as a PowerPoint template or use them as Google Slides themes.
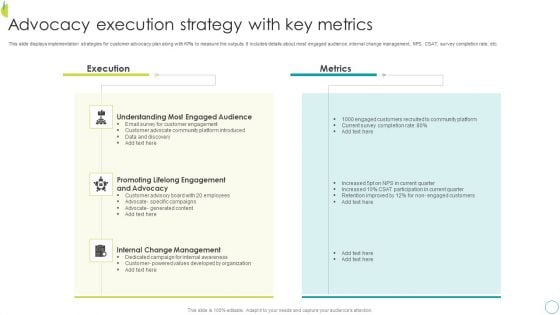
Advocacy Execution Strategy With Key Metrics Diagrams PDF
This slide displays implementation strategies for customer advocacy plan along with KPIs to measure the outputs. It includes details about most engaged audience, internal change management, NPS, CSAT, survey completion rate, etc. Showcasing this set of slides titled Advocacy Execution Strategy With Key Metrics Diagrams PDF The topics addressed in these templates are Execution, Metrics, Audience. All the content presented in this PPT design is completely editable. Download it and make adjustments in color, background, font etc. as per your unique business setting.
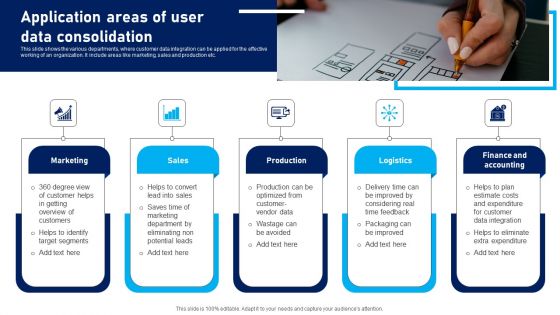
Application Areas Of User Data Consolidation Designs PDF
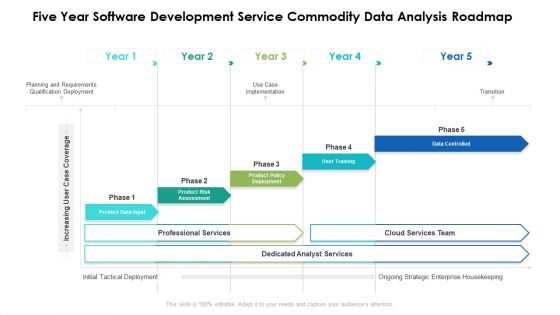
Five Year Software Development Service Commodity Data Analysis Roadmap Clipart
Presenting our innovatively structured five year software development service commodity data analysis roadmap clipart Template. Showcase your roadmap process in different formats like PDF, PNG, and JPG by clicking the download button below. This PPT design is available in both Standard Screen and Widescreen aspect ratios. It can also be easily personalized and presented with modified font size, font type, color, and shapes to measure your progress in a clear way.
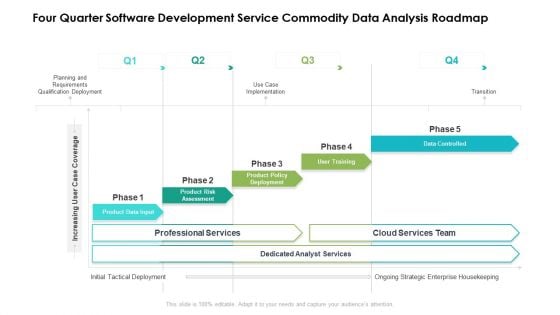
Four Quarter Software Development Service Commodity Data Analysis Roadmap Brochure
Presenting our innovatively structured four quarter software development service commodity data analysis roadmap brochure Template. Showcase your roadmap process in different formats like PDF, PNG, and JPG by clicking the download button below. This PPT design is available in both Standard Screen and Widescreen aspect ratios. It can also be easily personalized and presented with modified font size, font type, color, and shapes to measure your progress in a clear way.
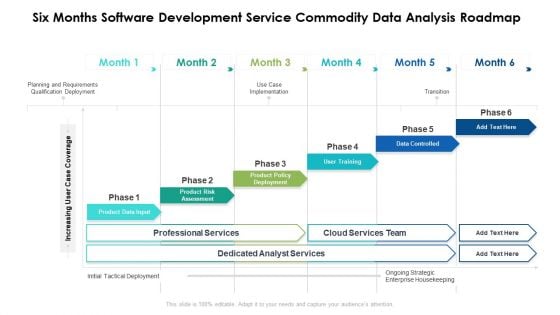
Six Months Software Development Service Commodity Data Analysis Roadmap Introduction
Presenting our innovatively structured six months software development service commodity data analysis roadmap introduction Template. Showcase your roadmap process in different formats like PDF, PNG, and JPG by clicking the download button below. This PPT design is available in both Standard Screen and Widescreen aspect ratios. It can also be easily personalized and presented with modified font size, font type, color, and shapes to measure your progress in a clear way.
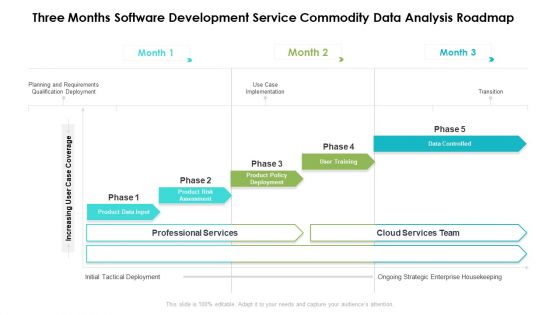
Three Months Software Development Service Commodity Data Analysis Roadmap Clipart
Presenting our innovatively structured three months software development service commodity data analysis roadmap clipart Template. Showcase your roadmap process in different formats like PDF, PNG, and JPG by clicking the download button below. This PPT design is available in both Standard Screen and Widescreen aspect ratios. It can also be easily personalized and presented with modified font size, font type, color, and shapes to measure your progress in a clear way.
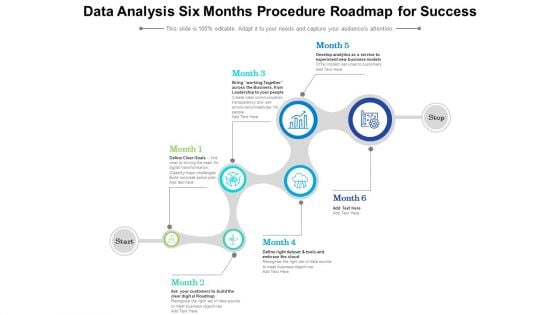
Data Analysis Six Months Procedure Roadmap For Success Ideas
Presenting our innovatively structured data analysis six months procedure roadmap for success ideas Template. Showcase your roadmap process in different formats like PDF, PNG, and JPG by clicking the download button below. This PPT design is available in both Standard Screen and Widescreen aspect ratios. It can also be easily personalized and presented with modified font size, font type, color, and shapes to measure your progress in a clear way.
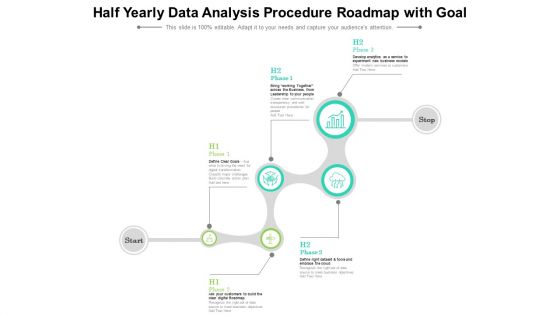
Half Yearly Data Analysis Procedure Roadmap With Goal Summary
Introducing our half yearly data analysis procedure roadmap with goal summary. This PPT presentation is Google Slides compatible, therefore, you can share it easily with the collaborators for measuring the progress. Also, the presentation is available in both standard screen and widescreen aspect ratios. So edit the template design by modifying the font size, font type, color, and shapes as per your requirements. As this PPT design is fully editable it can be presented in PDF, JPG and PNG formats.
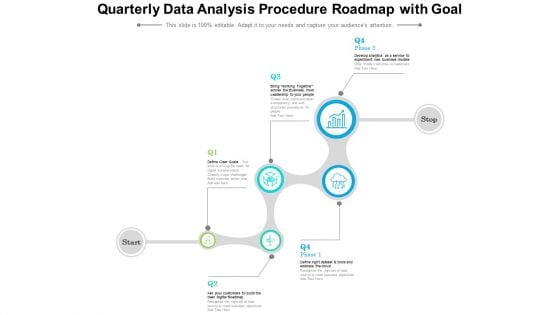
Quarterly Data Analysis Procedure Roadmap With Goal Summary
Introducing our quarterly data analysis procedure roadmap with goal summary. This PPT presentation is Google Slides compatible, therefore, you can share it easily with the collaborators for measuring the progress. Also, the presentation is available in both standard screen and widescreen aspect ratios. So edit the template design by modifying the font size, font type, color, and shapes as per your requirements. As this PPT design is fully editable it can be presented in PDF, JPG and PNG formats.
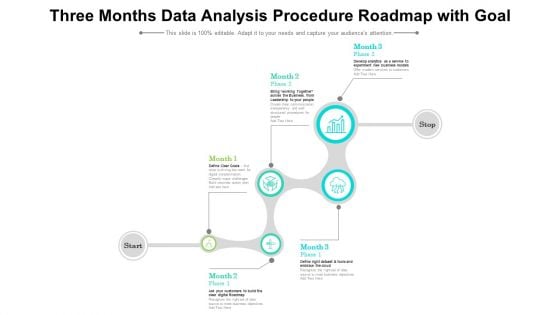
Three Months Data Analysis Procedure Roadmap With Goal Formats
Presenting our innovatively structured three months data analysis procedure roadmap with goal formats Template. Showcase your roadmap process in different formats like PDF, PNG, and JPG by clicking the download button below. This PPT design is available in both Standard Screen and Widescreen aspect ratios. It can also be easily personalized and presented with modified font size, font type, color, and shapes to measure your progress in a clear way.
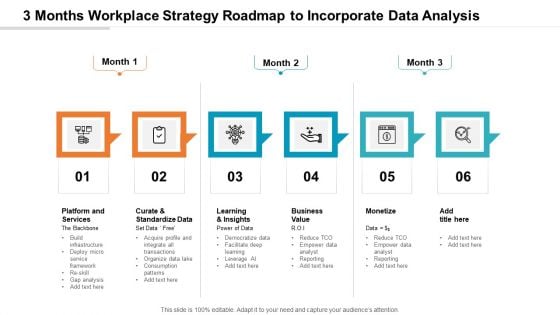
3 Months Workplace Strategy Roadmap To Incorporate Data Analysis Slides
Presenting our jaw-dropping 3 months workplace strategy roadmap to incorporate data analysis slides. You can alternate the color, font size, font type, and shapes of this PPT layout according to your strategic process. This PPT presentation is compatible with Google Slides and is available in both standard screen and widescreen aspect ratios. You can also download this well-researched PowerPoint template design in different formats like PDF, JPG, and PNG. So utilize this visually-appealing design by clicking the download button given below.
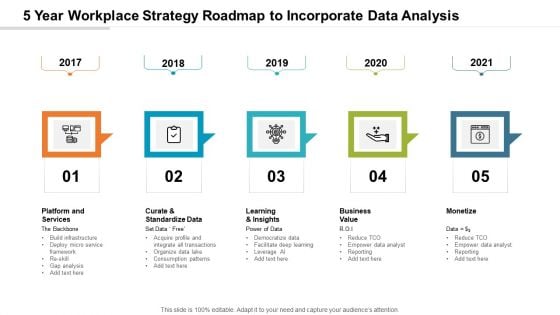
5 Year Workplace Strategy Roadmap To Incorporate Data Analysis Slides
Presenting our jaw-dropping 5 year workplace strategy roadmap to incorporate data analysis slides. You can alternate the color, font size, font type, and shapes of this PPT layout according to your strategic process. This PPT presentation is compatible with Google Slides and is available in both standard screen and widescreen aspect ratios. You can also download this well-researched PowerPoint template design in different formats like PDF, JPG, and PNG. So utilize this visually-appealing design by clicking the download button given below.
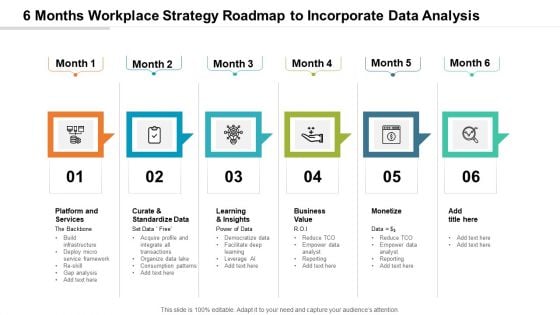
6 Months Workplace Strategy Roadmap To Incorporate Data Analysis Structure
Presenting our jaw-dropping 6 months workplace strategy roadmap to incorporate data analysis structure. You can alternate the color, font size, font type, and shapes of this PPT layout according to your strategic process. This PPT presentation is compatible with Google Slides and is available in both standard screen and widescreen aspect ratios. You can also download this well-researched PowerPoint template design in different formats like PDF, JPG, and PNG. So utilize this visually-appealing design by clicking the download button given below.
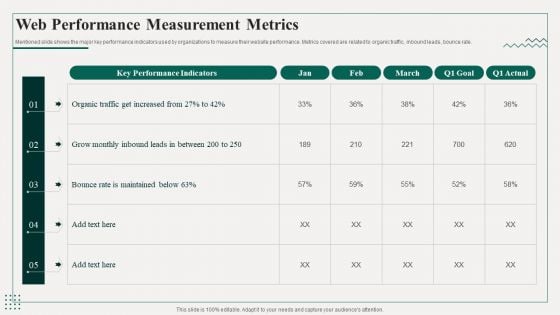
Promotion Playbook For Content Development Web Performance Measurement Metrics Diagrams PDF
Mentioned slide shows the major key performance indicators used by organizations to measure their website performance. Metrics covered are related to organic traffic, inbound leads, bounce rate.Deliver an awe inspiring pitch with this creative Promotion Playbook For Content Development Web Performance Measurement Metrics Diagrams PDF bundle. Topics like Performance Indicators, Monthly Inbound, Bounce Maintained can be discussed with this completely editable template. It is available for immediate download depending on the needs and requirements of the user.
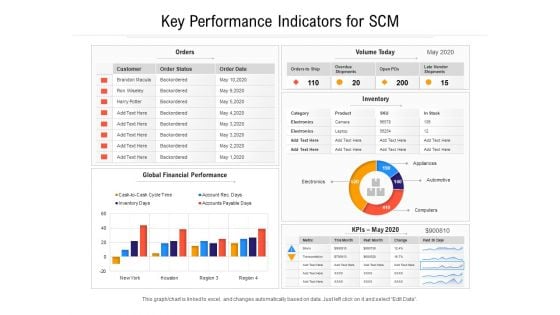
Key Performance Indicators For SCM Ppt PowerPoint Presentation File Graphic Tips PDF
Presenting this set of slides with name key performance indicators for scm ppt powerpoint presentation file graphic tips pdf. The topics discussed in these slides are global, financial, perform. This is a completely editable PowerPoint presentation and is available for immediate download. Download now and impress your audience.
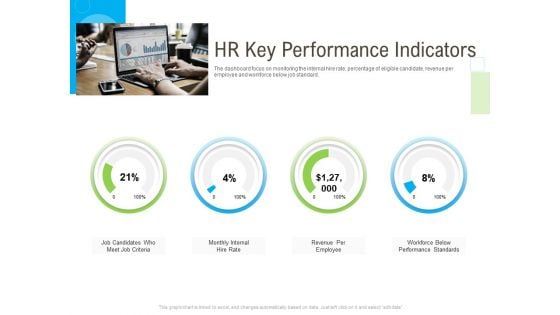
Rapid Innovation In HR Technology Space HR Key Performance Indicators Slides PDF
Deliver an awe inspiring pitch with this creative rapid innovation in hr technology space hr key performance indicators slides pdf bundle. Topics like criteria, workforce, performance, revenue, internal can be discussed with this completely editable template. It is available for immediate download depending on the needs and requirements of the user.
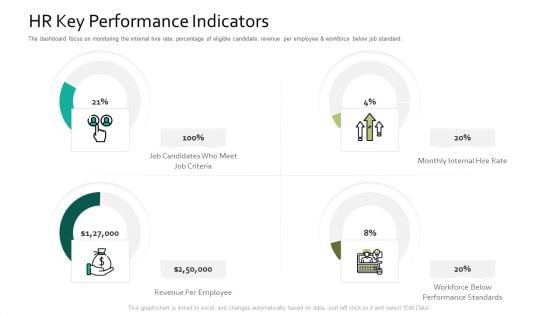
HR Key Performance Indicators Human Resource Information System For Organizational Effectiveness Pictures PDF
Deliver an awe inspiring pitch with this creative hr key performance indicators human resource information system for organizational effectiveness pictures pdf bundle. Topics like revenue, employee, performance, rate can be discussed with this completely editable template. It is available for immediate download depending on the needs and requirements of the user.
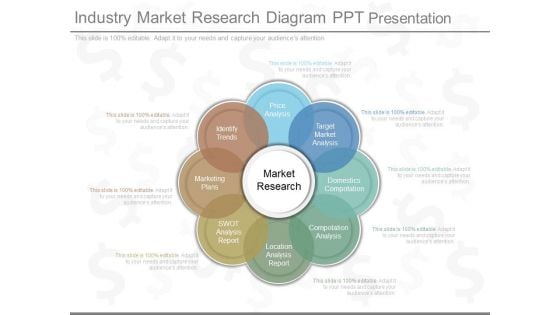
Industry Market Research Diagram Ppt Presentation
This is a industry market research diagram ppt presentation. This is a eight stage process. The stages in this process are market research, price analysis, identify trends, marketing plans, swot analysis report, location analysis report, compotation analysis, target market analysis.\n\n\n\n\n\n\n\n
Business Diagram Test Tube With Colored Bubbles For Science Data Presentation Template
Test tubes with colored bubbles are used to design this power point template slide. This PPt slide contains the concept of science data analysis. Use this PPT slide for your business and science related presentations.
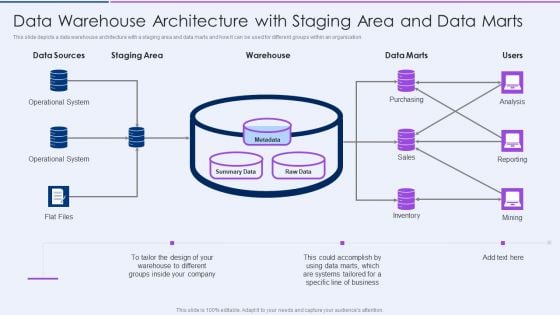
Data Warehouse Architecture With Staging Area And Data Marts Diagrams PDF
This slide depicts a data warehouse architecture with a staging area and data marts and how it can be used for different groups within an organization.Deliver and pitch your topic in the best possible manner with this Data Warehouse Architecture With Staging Area And Data Marts Diagrams PDF. Use them to share invaluable insights on Data Sources, Staging Area, Operational System and impress your audience. This template can be altered and modified as per your expectations. So, grab it now.
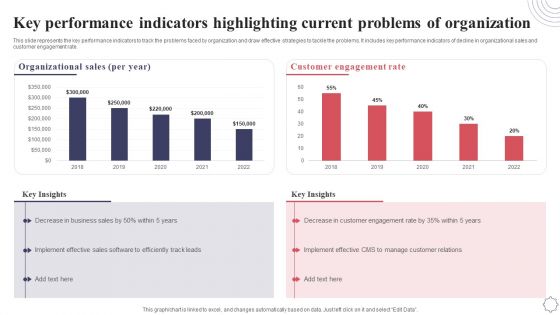
Key Performance Indicators Highlighting Current Problems Of Organization Application Deployment Project Plan Rules PDF
This slide represents the key performance indicators to track the problems faced by organization and draw effective strategies to tackle the problems. It includes key performance indicators of decline in organizational sales and customer engagement rate. Coming up with a presentation necessitates that the majority of the effort goes into the content and the message you intend to convey. The visuals of a PowerPoint presentation can only be effective if it supplements and supports the story that is being told. Keeping this in mind our experts created Key Performance Indicators Highlighting Current Problems Of Organization Application Deployment Project Plan Rules PDF to reduce the time that goes into designing the presentation. This way, you can concentrate on the message while our designers take care of providing you with the right template for the situation.
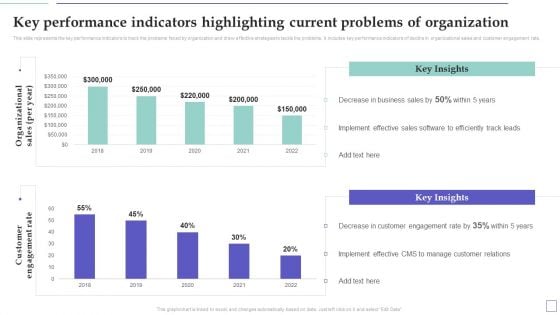
System Deployment Project Key Performance Indicators Highlighting Current Problems Information PDF
This slide represents the key performance indicators to track the problems faced by organization and draw effective strategies to tackle the problems. It includes key performance indicators of decline in organizational sales and customer engagement rate. Coming up with a presentation necessitates that the majority of the effort goes into the content and the message you intend to convey. The visuals of a PowerPoint presentation can only be effective if it supplements and supports the story that is being told. Keeping this in mind our experts created System Deployment Project Key Performance Indicators Highlighting Current Problems Information PDF to reduce the time that goes into designing the presentation. This way, you can concentrate on the message while our designers take care of providing you with the right template for the situation.
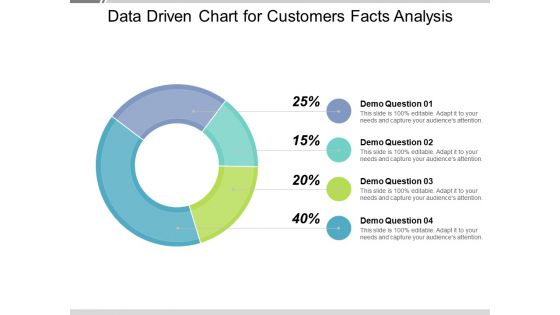
Data Driven Chart For Customers Facts Analysis Ppt PowerPoint Presentation Outline Ideas PDF
Presenting this set of slides with name data driven chart for customers facts analysis ppt powerpoint presentation outline ideas pdf. The topics discussed in these slide is data driven chart for customers facts analysis. This is a completely editable PowerPoint presentation and is available for immediate download. Download now and impress your audience.
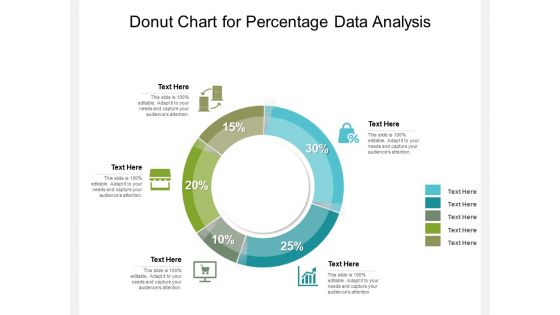
Donut Chart For Percentage Data Analysis Ppt PowerPoint Presentation Gallery Slides PDF
Showcasing this set of slides titled donut chart for percentage data analysis ppt powerpoint presentation gallery slides pdf. The topics addressed in these templates are donut chart for percentage data analysis. All the content presented in this PPT design is completely editable. Download it and make adjustments in color, background, font etc. as per your unique business setting.
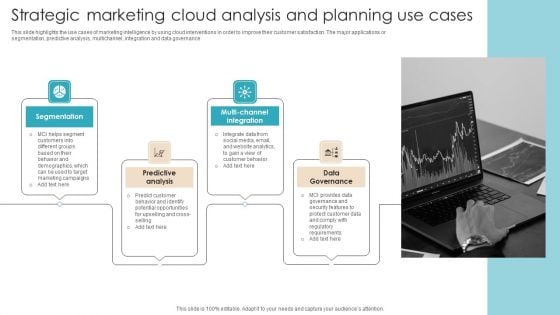
Strategic Marketing Cloud Analysis And Planning Use Cases Themes PDF
This slide highlights the use cases of marketing intelligence by using cloud interventions in order to improve their customer satisfaction. The major applications or segmentation, predictive analysis, multichannel, integration and data governance. Presenting Strategic Marketing Cloud Analysis And Planning Use Cases Themes PDF to dispense important information. This template comprises four stages. It also presents valuable insights into the topics including Segmentation, Predictive Analysis, Data Governance. This is a completely customizable PowerPoint theme that can be put to use immediately. So, download it and address the topic impactfully.
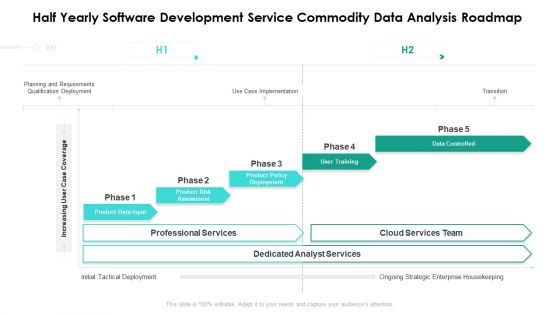
Half Yearly Software Development Service Commodity Data Analysis Roadmap Rules
Presenting the half yearly software development service commodity data analysis roadmap rules. The template includes a roadmap that can be used to initiate a strategic plan. Not only this, the PowerPoint slideshow is completely editable and you can effortlessly modify the font size, font type, and shapes according to your needs. This PPT slide can be easily reached in standard screen and widescreen aspect ratios. The set is also available in various formats like PDF, PNG, and JPG. So download and use it multiple times as per your knowledge.
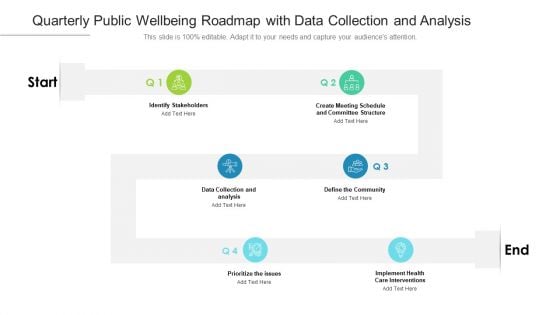
Quarterly Public Wellbeing Roadmap With Data Collection And Analysis Clipart
Presenting the quarterly public wellbeing roadmap with data collection and analysis clipart. The template includes a roadmap that can be used to initiate a strategic plan. Not only this, the PowerPoint slideshow is completely editable and you can effortlessly modify the font size, font type, and shapes according to your needs. This PPT slide can be easily reached in standard screen and widescreen aspect ratios. The set is also available in various formats like PDF, PNG, and JPG. So download and use it multiple times as per your knowledge.
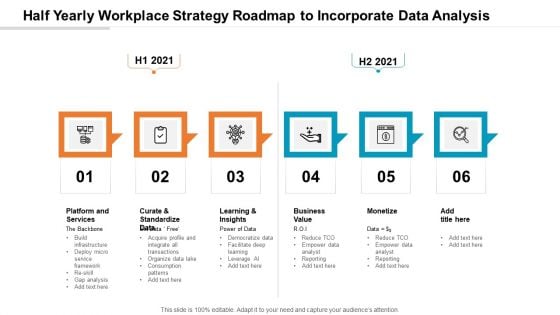
Half Yearly Workplace Strategy Roadmap To Incorporate Data Analysis Demonstration
Presenting the half yearly workplace strategy roadmap to incorporate data analysis demonstration. The template includes a roadmap that can be used to initiate a strategic plan. Not only this, the PowerPoint slideshow is completely editable and you can effortlessly modify the font size, font type, and shapes according to your needs. This PPT slide can be easily reached in standard screen and widescreen aspect ratios. The set is also available in various formats like PDF, PNG, and JPG. So download and use it multiple times as per your knowledge.
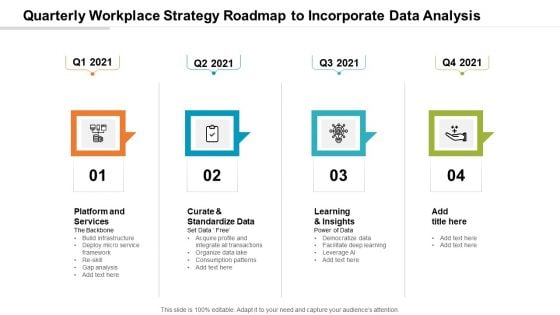
Quarterly Workplace Strategy Roadmap To Incorporate Data Analysis Download
Presenting the quarterly workplace strategy roadmap to incorporate data analysis download. The template includes a roadmap that can be used to initiate a strategic plan. Not only this, the PowerPoint slideshow is completely editable and you can effortlessly modify the font size, font type, and shapes according to your needs. This PPT slide can be easily reached in standard screen and widescreen aspect ratios. The set is also available in various formats like PDF, PNG, and JPG. So download and use it multiple times as per your knowledge.
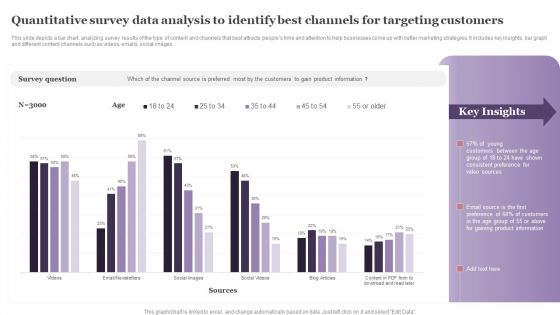
Quantitative Survey Data Analysis To Identify Best Channels For Targeting Customers Formats PDF
This slide depicts a bar chart, analyzing survey results of the type of content and channels that best attracts peoples time and attention to help businesses come up with better marketing strategies. It includes key insights, bar graph and different content channels such as videos, emails, social images. Pitch your topic with ease and precision using this Quantitative Survey Data Analysis To Identify Best Channels For Targeting Customers Formats PDF. This layout presents information on Survey Question, Young Customers, Consistent Preference. It is also available for immediate download and adjustment. So, changes can be made in the color, design, graphics or any other component to create a unique layout.
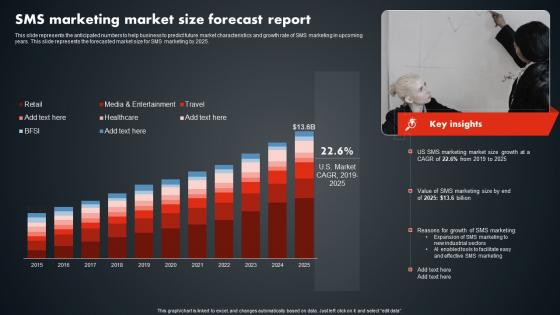
SMS Marketing Market Size Forecast Report SMS Promotional Tactics Clipart PDF
This slide represents the anticipated numbers to help business to predict future market characteristics and growth rate of SMS marketing in upcoming years. This slide represents the forecasted market size for SMS marketing by 2025. Do you have to make sure that everyone on your team knows about any specific topic I yes, then you should give SMS Marketing Market Size Forecast Report SMS Promotional Tactics Clipart PDF a try. Our experts have put a lot of knowledge and effort into creating this impeccable SMS Marketing Market Size Forecast Report SMS Promotional Tactics Clipart PDF. You can use this template for your upcoming presentations, as the slides are perfect to represent even the tiniest detail. You can download these templates from the Slidegeeks website and these are easy to edit. So grab these today This slide represents the anticipated numbers to help business to predict future market characteristics and growth rate of SMS marketing in upcoming years. This slide represents the forecasted market size for SMS marketing by 2025.
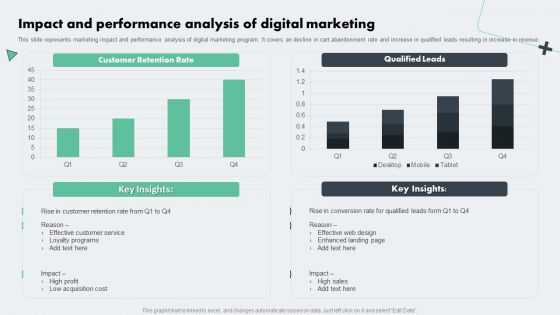
Deploying Online Marketing Impact And Performance Analysis Of Digital Marketing Background PDF
This slide represents marketing impact and performance analysis of digital marketing program. It covers an decline in cart abandonment rate and increase in qualified leads resulting in increase in revenue. The Deploying Online Marketing Impact And Performance Analysis Of Digital Marketing Background PDF is a compilation of the most recent design trends as a series of slides. It is suitable for any subject or industry presentation, containing attractive visuals and photo spots for businesses to clearly express their messages. This template contains a variety of slides for the user to input data, such as structures to contrast two elements, bullet points, and slides for written information. Slidegeeks is prepared to create an impression.
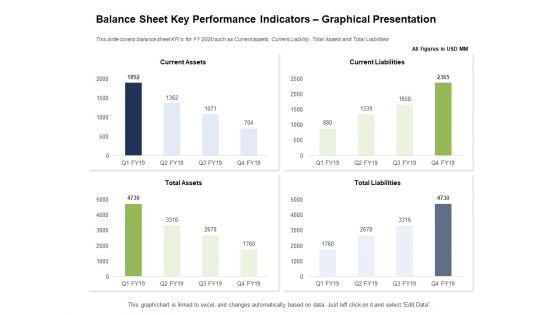
Ways To Bounce Back From Insolvency Balance Sheet Key Performance Indicators Graphical Presentation Brochure PDF
Presenting this set of slides with name ways to bounce back from insolvency balance sheet key performance indicators graphical presentation brochure pdf. The topics discussed in these slides are current assets, current liabilities, total assets, total liabilities. This is a completely editable PowerPoint presentation and is available for immediate download. Download now and impress your audience.
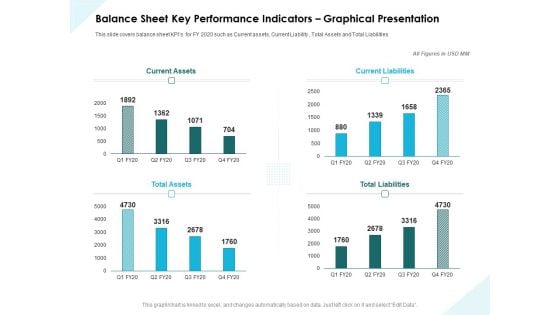
Issues Which Leads To Insolvency Balance Sheet Key Performance Indicators Graphical Presentation Information PDF
Presenting this set of slides with name issues which leads to insolvency balance sheet key performance indicators graphical presentation information pdf. The topics discussed in these slides are current assets, current liabilities, total assets, total liabilities. This is a completely editable PowerPoint presentation and is available for immediate download. Download now and impress your audience.
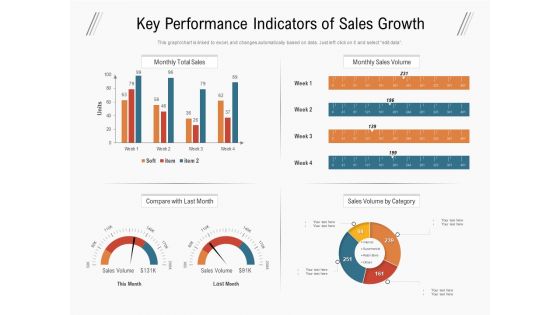
Key Performance Indicators Of Sales Growth Ppt PowerPoint Presentation Portfolio Clipart Images PDF
Presenting this set of slides with name key performance indicators of sales growth ppt powerpoint presentation portfolio clipart images pdf. The topics discussed in these slides are monthly total sales, monthly sales volume, compare with last month, sales volume by category. This is a completely editable PowerPoint presentation and is available for immediate download. Download now and impress your audience.
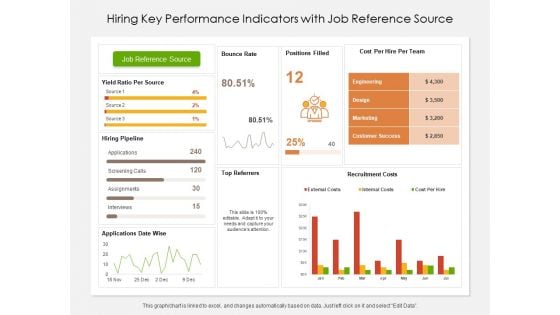
Hiring Key Performance Indicators With Job Reference Source Ppt PowerPoint Presentation Gallery Graphics Example PDF
Presenting this set of slides with name hiring key performance indicators with job reference source ppt powerpoint presentation gallery graphics example pdf. The topics discussed in these slides are source, cost, recruitment. This is a completely editable PowerPoint presentation and is available for immediate download. Download now and impress your audience.
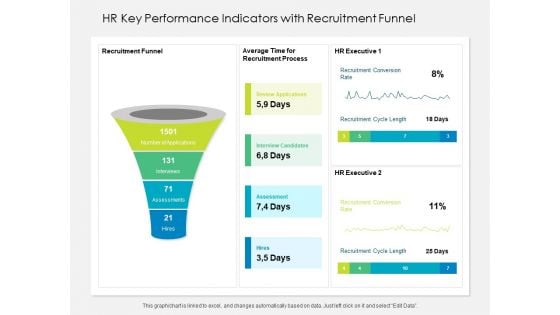
HR Key Performance Indicators With Recruitment Funnel Ppt PowerPoint Presentation File Formats PDF
Presenting this set of slides with name hr key performance indicators with recruitment funnel ppt powerpoint presentation file formats pdf. The topics discussed in these slides are funnel, process, recruitment. This is a completely editable PowerPoint presentation and is available for immediate download. Download now and impress your audience.
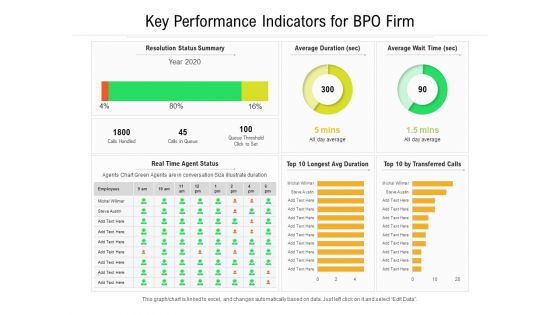
Key Performance Indicators For BPO Firm Ppt PowerPoint Presentation File Picture PDF
Presenting this set of slides with name key performance indicators for bpo firm ppt powerpoint presentation file picture pdf. The topics discussed in these slides are resolution, average, queue. This is a completely editable PowerPoint presentation and is available for immediate download. Download now and impress your audience.
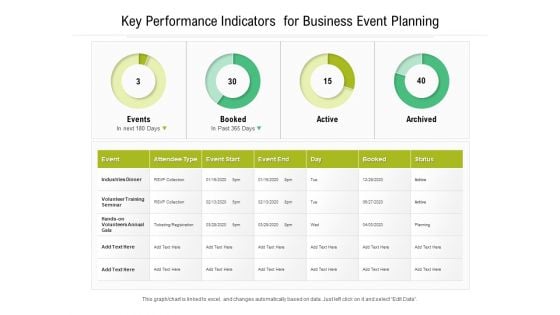
Key Performance Indicators For Business Event Planning Ppt PowerPoint Presentation Gallery Graphic Images PDF
Presenting this set of slides with name key performance indicators for business event planning ppt powerpoint presentation gallery graphic images pdf. The topics discussed in these slides are industries, training, volunteers. This is a completely editable PowerPoint presentation and is available for immediate download. Download now and impress your audience.
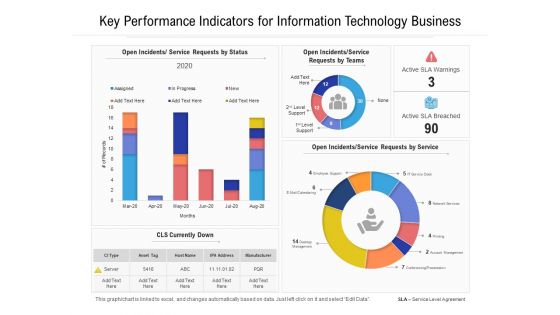
Key Performance Indicators For Information Technology Business Ppt PowerPoint Presentation File Graphics Example PDF
Presenting this set of slides with name key performance indicators for information technology business ppt powerpoint presentation file graphics example pdf. The topics discussed in these slides are service, manufacturer, management. This is a completely editable PowerPoint presentation and is available for immediate download. Download now and impress your audience.
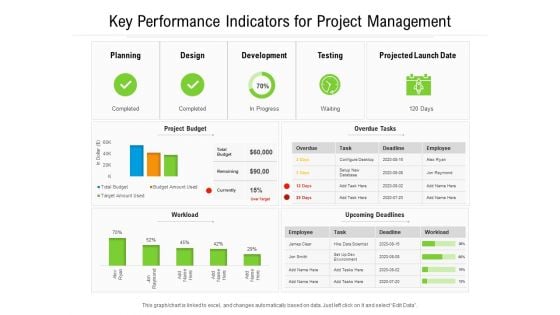
Key Performance Indicators For Project Management Ppt PowerPoint Presentation File Example File PDF
Presenting this set of slides with name key performance indicators for project management ppt powerpoint presentation file example file pdf. The topics discussed in these slides are planning, development, design. This is a completely editable PowerPoint presentation and is available for immediate download. Download now and impress your audience.
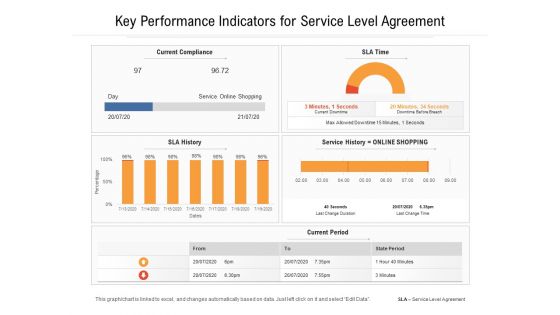
Key Performance Indicators For Service Level Agreement Ppt PowerPoint Presentation Gallery Samples PDF
Presenting this set of slides with name key performance indicators for service level agreement ppt powerpoint presentation gallery samples pdf. The topics discussed in these slides are service, current compliance, history. This is a completely editable PowerPoint presentation and is available for immediate download. Download now and impress your audience.
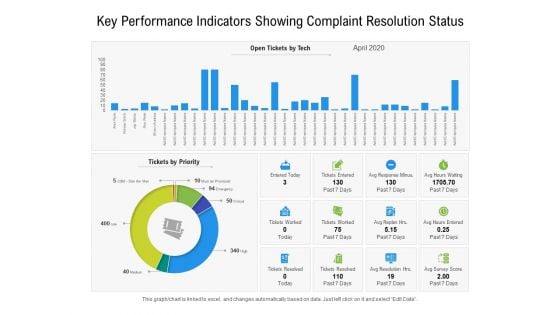
Key Performance Indicators Showing Complaint Resolution Status Ppt PowerPoint Presentation File Styles PDF
Presenting this set of slides with name key performance indicators showing complaint resolution status ppt powerpoint presentation file styles pdf. The topics discussed in these slides are priority, survey, response. This is a completely editable PowerPoint presentation and is available for immediate download. Download now and impress your audience.
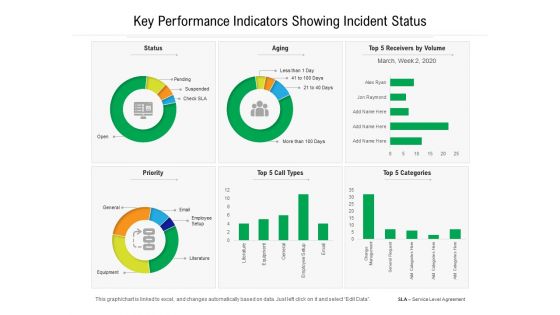
Key Performance Indicators Showing Incident Status Ppt PowerPoint Presentation Gallery Tips PDF
Presenting this set of slides with name key performance indicators showing incident status ppt powerpoint presentation gallery tips pdf. The topics discussed in these slides are priority, categories, aging. This is a completely editable PowerPoint presentation and is available for immediate download. Download now and impress your audience.
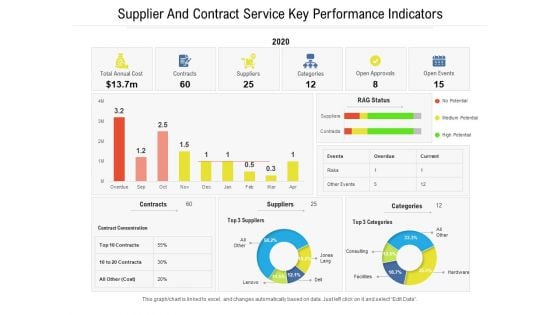
Supplier And Contract Service Key Performance Indicators Ppt PowerPoint Presentation File Inspiration PDF
Presenting this set of slides with name supplier and contract service key performance indicators ppt powerpoint presentation file inspiration pdf. The topics discussed in these slides are cost, suppliers, potential. This is a completely editable PowerPoint presentation and is available for immediate download. Download now and impress your audience.
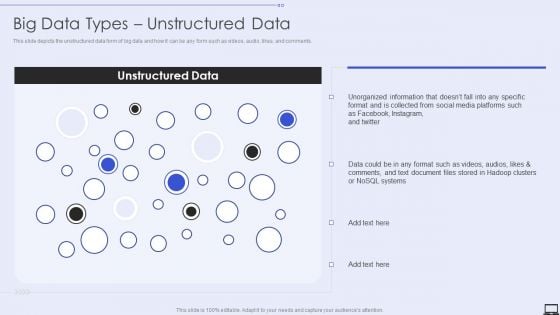
Big Data Types Unstructured Data Ppt PowerPoint Presentation Diagram Lists PDF
This slide depicts the unstructured data form of big data and how it can be any form such as videos, audio, likes, and comments. Deliver and pitch your topic in the best possible manner with this Big Data Types Unstructured Data Ppt PowerPoint Presentation Diagram Lists PDF. Use them to share invaluable insights on Unorganized Information, Social Media, Systems and impress your audience. This template can be altered and modified as per your expectations. So, grab it now.
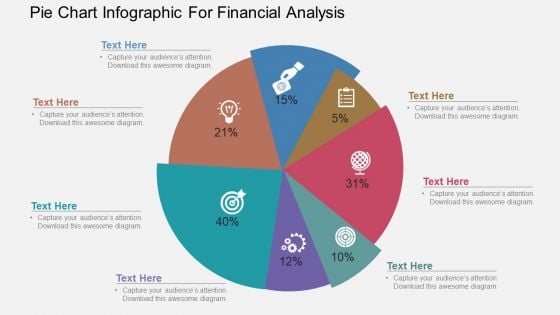
Pie Chart Infographic For Financial Analysis Powerpoint Template
Our above PowerPoint template has been designed with pie chart infographic. This slide is suitable to present financial analysis. Use this business diagram to present your work in a more smart and precise manner.

Monthly Business Marketing Performance Report PPT Presentation SS
If you are looking for a format to display your unique thoughts, then the professionally designed Monthly Business Marketing Performance Report PPT Presentation SS is the one for you. You can use it as a Google Slides template or a PowerPoint template. Incorporate impressive visuals, symbols, images, and other charts. Modify or reorganize the text boxes as you desire. Experiment with shade schemes and font pairings. Alter, share or cooperate with other people on your work. Download Monthly Business Marketing Performance Report PPT Presentation SS and find out how to give a successful presentation. Present a perfect display to your team and make your presentation unforgettable. Our Monthly Business Marketing Performance Report PPT Presentation SS are topically designed to provide an attractive backdrop to any subject. Use them to look like a presentation pro.
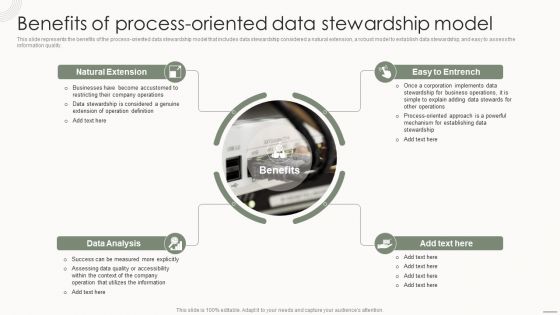
Data Governance IT Benefits Of Process Oriented Data Stewardship Model Diagrams PDF
This slide represents the benefits of the process oriented data stewardship model that includes data stewardship considered a natural extension, a robust model to establish data stewardship, and easy to assess the information quality. Create an editable Data Governance IT Benefits Of Process Oriented Data Stewardship Model Diagrams PDF that communicates your idea and engages your audience. Whether you are presenting a business or an educational presentation, pre designed presentation templates help save time. Data Governance IT Benefits Of Process Oriented Data Stewardship Model Diagrams PDF is highly customizable and very easy to edit, covering many different styles from creative to business presentations. Slidegeeks has creative team members who have crafted amazing templates. So, go and get them without any delay.
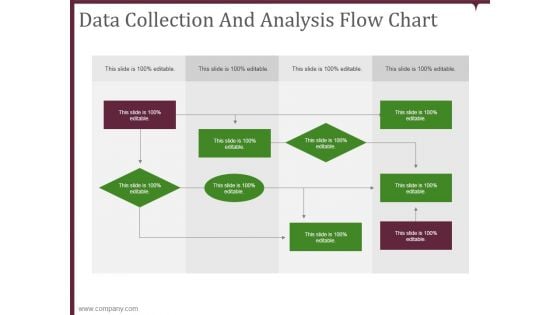
Data Collection And Analysis Flow Chart Template 1 Ppt PowerPoint Presentation Ideas Gridlines
This is a data collection and analysis flow chart template 1 ppt powerpoint presentation ideas gridlines. This is a nine stage process. The stages in this process are business, chart, organization, process, structure.
Data Collection And Analysis Flow Chart Template 2 Ppt PowerPoint Presentation Inspiration Layout Ideas
This is a data collection and analysis flow chart template 2 ppt powerpoint presentation inspiration layout ideas. This is a four stage process. The stages in this process are business, chart, organization, process, structure.
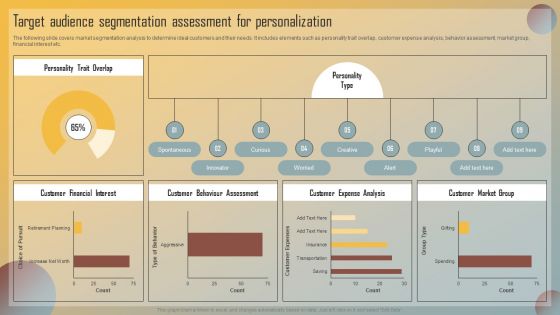
Guide For Marketing Analytics To Improve Decisions Target Audience Segmentation Assessment For Personalization Slides PDF
The following slide covers market segmentation analysis to determine ideal customers and their needs. It includes elements such as personality trait overlap, customer expense analysis, behavior assessment, market group, financial interest etc. The Guide For Marketing Analytics To Improve Decisions Target Audience Segmentation Assessment For Personalization Slides PDF is a compilation of the most recent design trends as a series of slides. It is suitable for any subject or industry presentation, containing attractive visuals and photo spots for businesses to clearly express their messages. This template contains a variety of slides for the user to input data, such as structures to contrast two elements, bullet points, and slides for written information. Slidegeeks is prepared to create an impression.
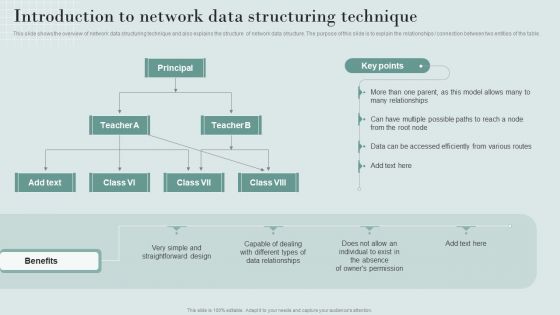
Data Structure IT Introduction To Network Data Structuring Technique Diagrams PDF
Formulating a presentation can take up a lot of effort and time, so the content and message should always be the primary focus. The visuals of the PowerPoint can enhance the presenters message, so our Data Structure IT Introduction To Network Data Structuring Technique Diagrams PDF was created to help save time. Instead of worrying about the design, the presenter can concentrate on the message while our designers work on creating the ideal templates for whatever situation is needed. Slidegeeks has experts for everything from amazing designs to valuable content, we have put everything into Data Structure IT Introduction To Network Data Structuring Technique Diagrams PDF.
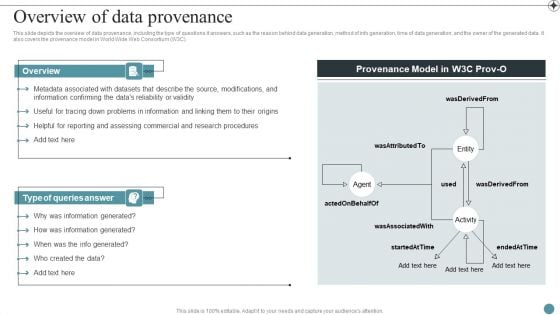
Overview Of Data Provenance Deploying Data Lineage IT Professional PDF
This slide gives an overview of graph data lineage visualization that enables business users to view and analyze data lineage to find solutions without technical skills. The search bar feature allows users to search for any data set or property in the database.Do you know about Slidesgeeks Overview Of Data Provenance Deploying Data Lineage IT Professional PDF These are perfect for delivering any kind od presentation. Using it, create PowerPoint presentations that communicate your ideas and engage audiences. Save time and effort by using our pre-designed presentation templates that are perfect for a wide range of topic. Our vast selection of designs covers a range of styles, from creative to business, and are all highly customizable and easy to edit. Download as a PowerPoint template or use them as Google Slides themes.
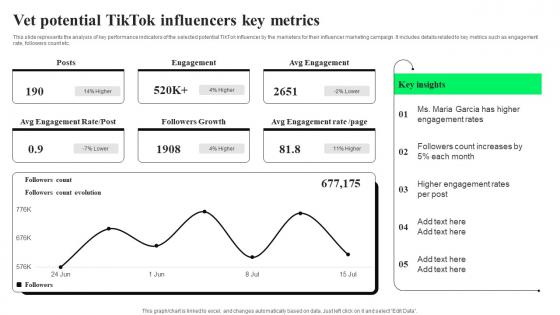
Vet Potential TikTok Influencers Key TikTok Advertising Strategies To Provide Effective Pictures Pdf
This slide represents the analysis of key performance indicators of the selected potential TikTok influencer by the marketers for their influencer marketing campaign. It includes details related to key metrics such as engagement rate, followers count etc. Find a pre designed and impeccable Vet Potential TikTok Influencers Key TikTok Advertising Strategies To Provide Effective Pictures Pdf. The templates can ace your presentation without additional effort. You can download these easy to edit presentation templates to make your presentation stand out from others. So, what are you waiting for Download the template from Slidegeeks today and give a unique touch to your presentation. This slide represents the analysis of key performance indicators of the selected potential TikTok influencer by the marketers for their influencer marketing campaign. It includes details related to key metrics such as engagement rate, followers count etc.
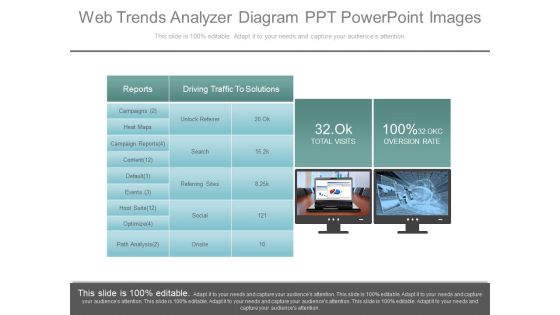
Web Trends Analyzer Diagram Ppt Powerpoint Images
This is a web trends analyzer diagram ppt powerpoint images. This is a two stage process. The stages in this process are reports, driving traffic to solutions, campaigns, heat maps, campaign reports, content, default, events, hoot suite, optimize, unlock referrer, search, referring sites, social, onsite, 32 ok total visits, 100 percent 32 okc oversion rate.

 Home
Home