Revenue Dashboard
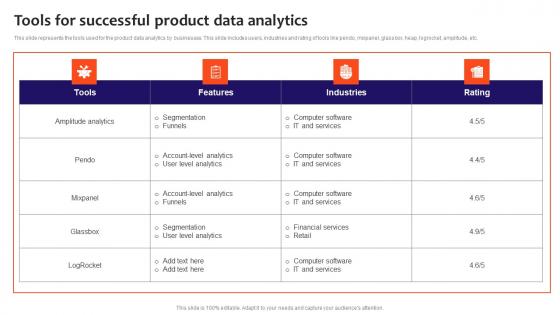
Tools For Successful Product Data Analytics Infographics Pdf
This slide represents the tools used for the product data analytics by businesses. This slide includes users, industries and rating of tools like pendo, mixpanel, glassbox, heap, logrocket, amplitude, etc. Showcasing this set of slides titled Tools For Successful Product Data Analytics Infographics Pdf. The topics addressed in these templates are Funnels, IT And Services, Financial Services. All the content presented in this PPT design is completely editable. Download it and make adjustments in color, background, font etc. as per your unique business setting. This slide represents the tools used for the product data analytics by businesses. This slide includes users, industries and rating of tools like pendo, mixpanel, glassbox, heap, logrocket, amplitude, etc.

Government And Public Sector Industry Data Analytics Company Outline Clipart PDF
The following slide highlights the research services offered by Kantar company to the government and public sector industry. It also shows the clients and impact of solutions provided. Make sure to capture your audiences attention in your business displays with our gratis customizable Government And Public Sector Industry Data Analytics Company Outline Clipart PDF These are great for business strategies, office conferences, capital raising or task suggestions. If you desire to acquire more customers for your tech business and ensure they stay satisfied, create your own sales presentation with these plain slides. The following slide highlights the research services offered by Kantar company to the government and public sector industry. It also shows the clients and impact of solutions provided
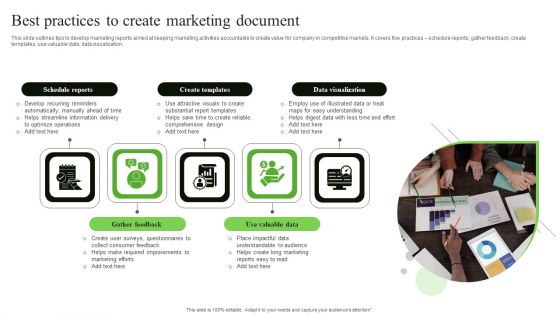
Best Practices To Create Marketing Document Portrait PDF
This slide outlines tips to develop marketing reports aimed at keeping marketing activities accountable to create value for company in competitive markets. It covers five practices schedule reports, gather feedback, create templates, use valuable data, data visualization. Presenting Best Practices To Create Marketing Document Portrait PDF to dispense important information. This template comprises five stages. It also presents valuable insights into the topics including Schedule Reports, Create Templates, Data Visualization. This is a completely customizable PowerPoint theme that can be put to use immediately. So, download it and address the topic impactfully.
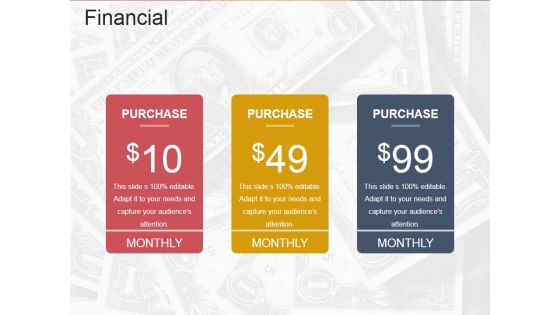
Financial Ppt PowerPoint Presentation Outline Grid
This is a financial ppt powerpoint presentation outline grid. This is a three stage process. The stages in this process are business, strategy, marketing, analysis, finance, purchase, monthly.
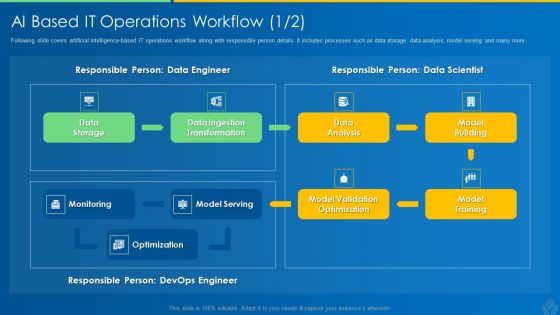
AI And ML Driving Monetary Value For Organization AI Based IT Operations Workflow Data Topics PDF
Following slide covers artificial intelligence-based IT operations workflow along with responsible person details. It includes processes such as data storage, data analysis, model serving and many more. Deliver an awe inspiring pitch with this creative ai and ml driving monetary value for organization ai based it operations workflow data topics pdf bundle. Topics like data storage, data ingestion transformation, data analysis, model building, model training can be discussed with this completely editable template. It is available for immediate download depending on the needs and requirements of the user.
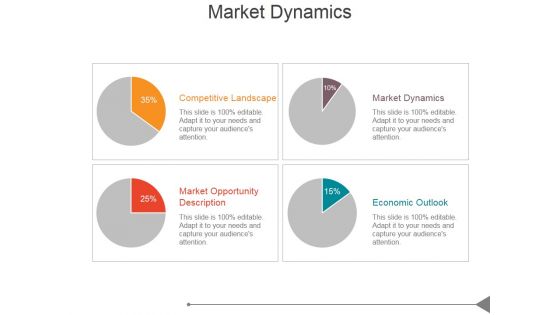
Market Dynamics Ppt PowerPoint Presentation Show
This is a market dynamics ppt powerpoint presentation show. This is a four stage process. The stages in this process are competitive landscape, market opportunity description, economic outlook, market dynamics.
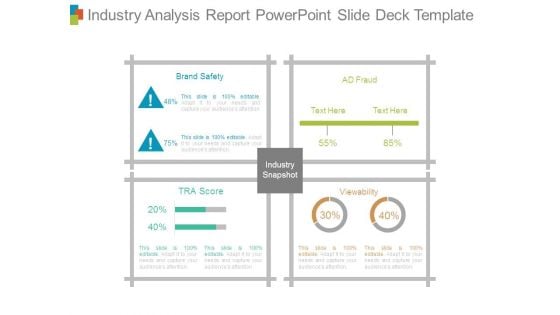
Industry Analysis Report Powerpoint Slide Deck Template
This is a industry analysis report powerpoint slide deck template. This is a four stage process. The stages in this process are industry snapshot, brand safety, ad fraud, viewability, tra score.
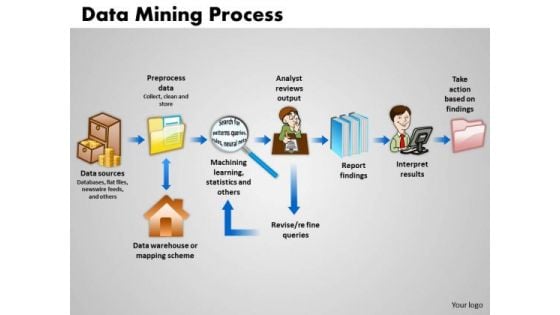
Business Arrows PowerPoint Templates Success Data Mining Process Ppt Slides
Business Arrows PowerPoint Templates Success data mining process PPT Slides-This data mining PowerPoint template can be used for example in presentations where you need to explain data mining algorithms-Business Arrows PowerPoint Templates Success data mining process PPT Slides-This template can be used for presentations relating to Analysis, Anomaly, Artificial, Break, Clean, Computer, Cut, Data, Database, Decision, Detection, Discovery, Divide, Explore, Extract, Hammer, Helmet, Human, Index, Intelligence, Kdd, knowledge, Learning, Light, Mallet, Management, Mining, Model, Movement, Pattern, Predictive, Process, Records, Recycle, Repair, Safety, Science Procure contracts with our Business Arrows PowerPoint Templates Success Data Mining Process Ppt Slides. Download without worries with our money back guaranteee.
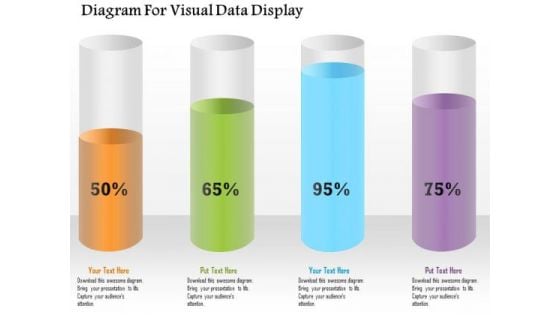
Business Diagram Diagram For Visual Data Display Presentation Template
Four colored cylindrical bars with percentage values are used to design this power point template. This diagram slide helps to display financial data analysis. Use this diagram for your business and finance related presentations.
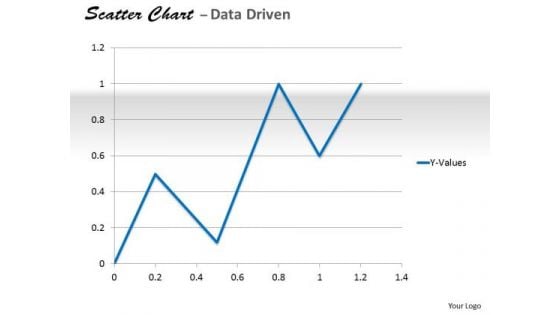
Data Analysis In Excel Analyzing Of Relationship Chart PowerPoint Templates
Delight Them With Our data analysis in excel analyzing of relationship chart Powerpoint Templates .
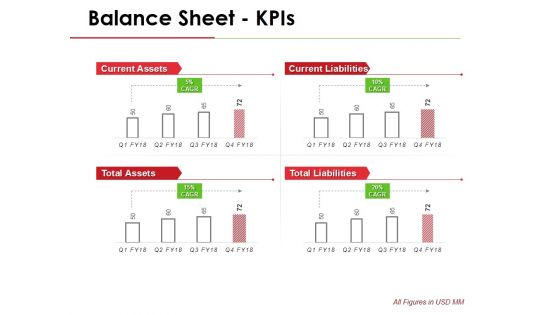
Balance Sheet Kpis Template 1 Ppt PowerPoint Presentation Layouts Design Ideas
This is a balance sheet kpis template 1 ppt powerpoint presentation layouts design ideas. This is a four stage process. The stages in this process are current assets, current liabilities, total assets, total liabilities.
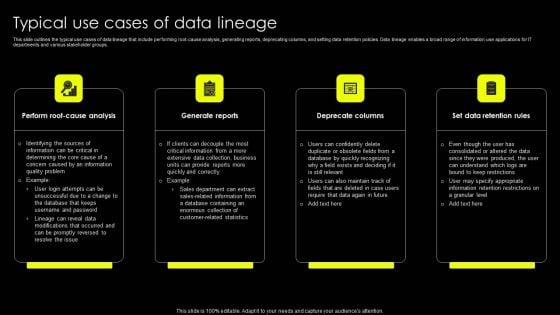
Data Lineage Implementation Typical Use Cases Of Data Lineage Pictures PDF
This slide outlines the typical use cases of data lineage that include performing root-cause analysis, generating reports, deprecating columns, and setting data retention policies. Data lineage enables a broad range of information use applications for IT departments and various stakeholder groups. Make sure to capture your audiences attention in your business displays with our gratis customizable Data Lineage Implementation Typical Use Cases Of Data Lineage Pictures PDF. These are great for business strategies, office conferences, capital raising or task suggestions. If you desire to acquire more customers for your tech business and ensure they stay satisfied, create your own sales presentation with these plain slides.
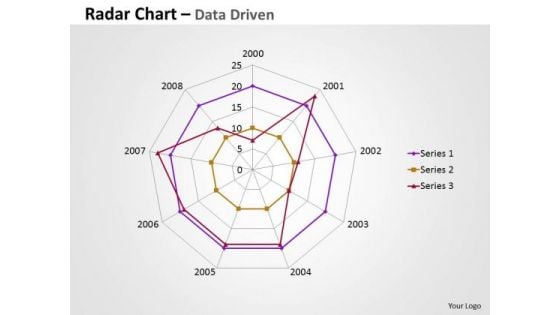
Business Data Analysis Chart Comparing Multiple Entities PowerPoint Templates
Analyze Ailments On Our business data analysis chart comparing multiple entities Powerpoint Templates. Bring Out The Thinking Doctor In You. Dock Your Thoughts With Our Financial Analysis . They Will Launch Them Into Orbit.
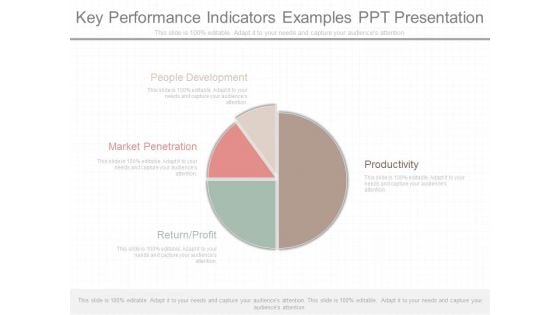
Key Performance Indicators Examples Ppt Presentation
This is a key performance indicators examples ppt presentation. This is a four stage process. The stages in this process are people development, productivity, market penetration, return profit.
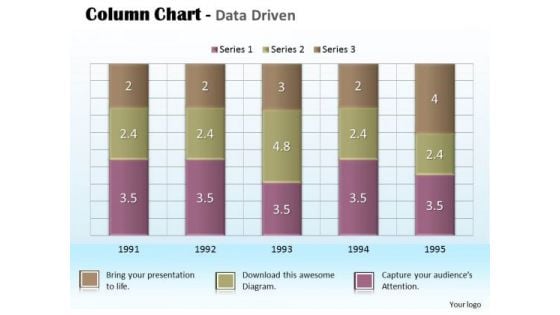
Business Data Analysis Chart For Project PowerPoint Templates
Document Your Views On Our business data analysis chart for project Powerpoint Templates. They Will Create A Strong Impression.
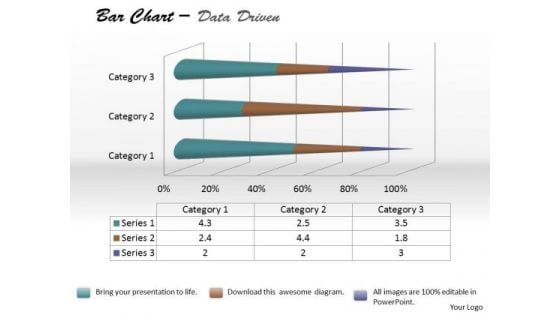
Data Analysis Bar Chart For Foreign Trade PowerPoint Templates
Be The Doer With Our data analysis bar chart for foreign trade Powerpoint Templates. Put Your Thoughts Into Practice.
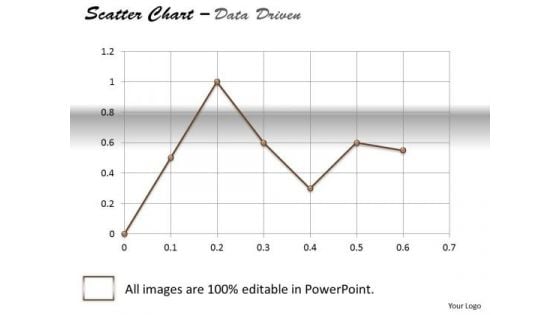
Data Analysis Excel Business Tool Scatter Chart PowerPoint Templates
Dominate Proceedings With Your Ideas. Our data analysis excel business tool scatter chart Powerpoint Templates Will Empower Your Thoughts.

Data Analysis Excel Categorical Statistics Doughnut Chart PowerPoint Templates
Establish Your Dominion With Our data analysis excel categorical statistics doughnut chart Powerpoint Templates. Rule The Stage With Your Thoughts.
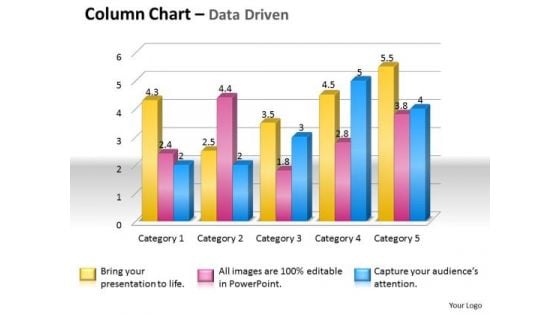
Data Analysis Techniques 3d Grouped Bar Chart PowerPoint Templates
Place The Orders With Your Thoughts. Our data analysis techniques 3d grouped bar chart Powerpoint Templates Know The Drill.
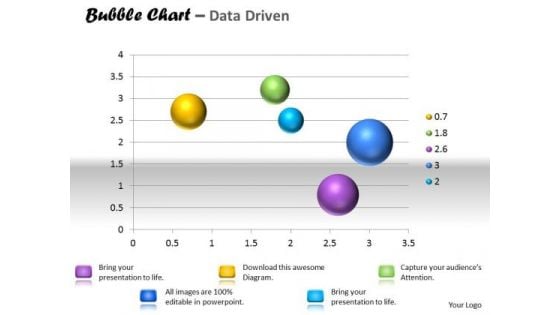
Data Analysis Template Interactive Bubble Chart PowerPoint Templates
Our data analysis template interactive bubble chart Powerpoint Templates Are A Wonder Drug. They Help Cure Almost Any Malaise.
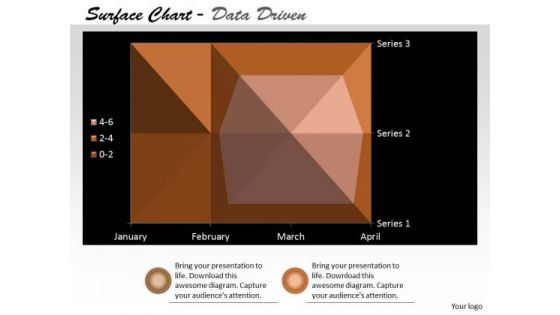
Multivariate Data Analysis Surface Chart Plots Trends PowerPoint Templates
Our multivariate data analysis surface chart plots trends Powerpoint Templates Heighten Concentration. Your Audience Will Be On The Edge.
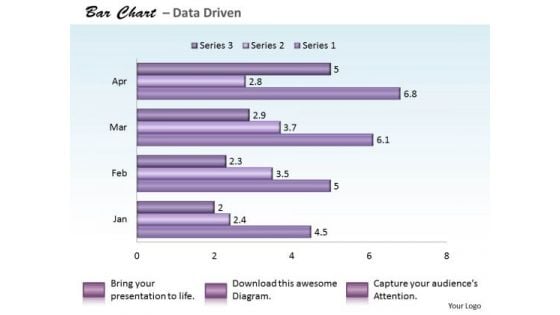
Quantitative Data Analysis Bar Chart For PowerPoint Templates
Reduce The Drag With Our quantitative data analysis bar chart for Powerpoint Templates . Give More Lift To Your Thoughts.

Data Analysis Techniques 3d Effective Display Chart PowerPoint Templates
Dribble Away With Our data analysis techniques 3d effective display chart Powerpoint Templates . Score A Goal With Your Ideas.
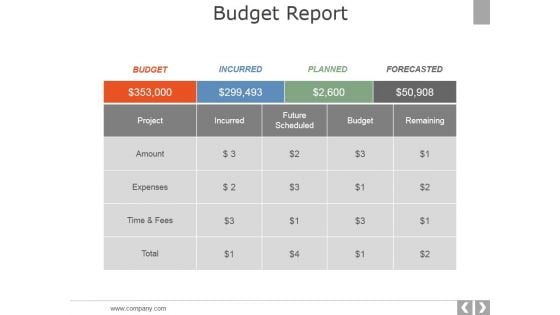
Budget Report Ppt PowerPoint Presentation Outline Examples
This is a budget report ppt powerpoint presentation outline examples. This is a five stage process. The stages in this process are project, amount, expenses, future scheduled, remaining.
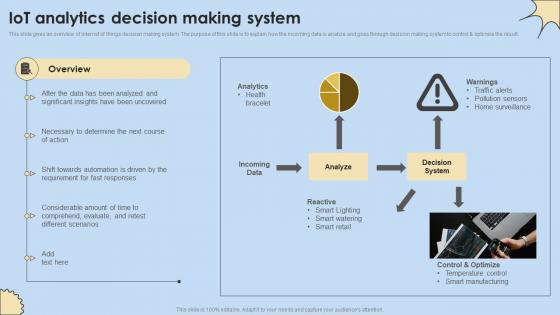
IoT Analytics Decision Making System Internet Of Things Analysis Professional Pdf
This slide gives an overview of internet of things decision making system. The purpose of this slide is to explain how the incoming data is analyze and goes through decision making system to control and optimize the result. Welcome to our selection of the IoT Analytics Decision Making System Internet Of Things Analysis Professional Pdf. These are designed to help you showcase your creativity and bring your sphere to life. Planning and Innovation are essential for any business that is just starting out. This collection contains the designs that you need for your everyday presentations. All of our PowerPoints are 100 percent editable, so you can customize them to suit your needs. This multi-purpose template can be used in various situations. Grab these presentation templates today. This slide gives an overview of internet of things decision making system. The purpose of this slide is to explain how the incoming data is analyze and goes through decision making system to control and optimize the result.
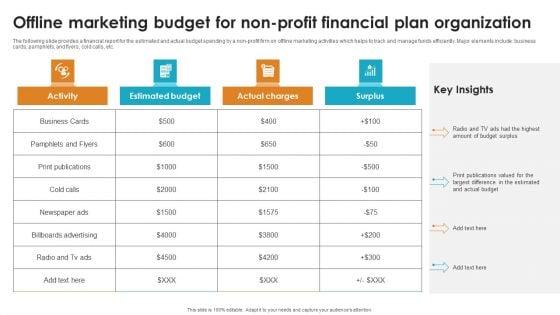
Offline Marketing Budget For Non Profit Financial Plan Organization Diagrams PDF
The following slide provides a financial report for the estimated and actual budget spending by a non profit firm on offline marketing activities which helps to track and manage funds efficiently. Major elements include business cards, pamphlets, and flyers, cold calls, etc.Showcasing this set of slides titled Offline Marketing Budget For Non Profit Financial Plan Organization Diagrams PDF. The topics addressed in these templates are unique. All the content presented in this PPT design is completely editable. Download it and make adjustments in color, background, font etc. as per your business setting.
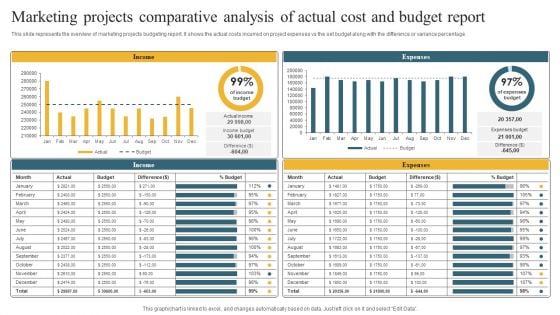
Marketing Projects Comparative Analysis Of Actual Cost And Budget Report Themes PDF
This slide represents the overview of marketing projects budgeting report. It shows the actual costs incurred on project expenses vs the set budget along with the difference or variance percentage. Showcasing this set of slides titled Marketing Projects Comparative Analysis Of Actual Cost And Budget Report Themes PDF. The topics addressed in these templates are Income, Expenses, Report. All the content presented in this PPT design is completely editable. Download it and make adjustments in color, background, font etc. as per your unique business setting.
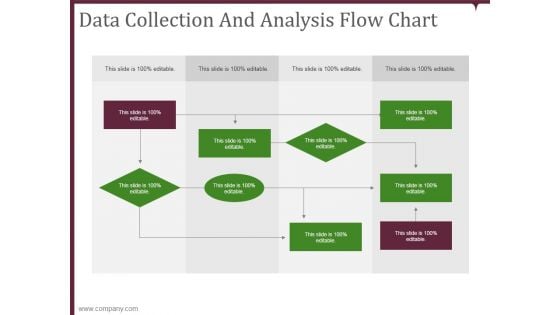
data collection and analysis flow chart ppt powerpoint presentation microsoft
This is a data collection and analysis flow chart ppt powerpoint presentation microsoft. This is a nine stage process. The stages in this process are business, planning, marketing, strategy, management.

Business Data Analysis Chart For Case Studies PowerPoint Templates
Get Out Of The Dock With Our business data analysis chart for case studies Powerpoint Templates. Your Mind Will Be Set Free.
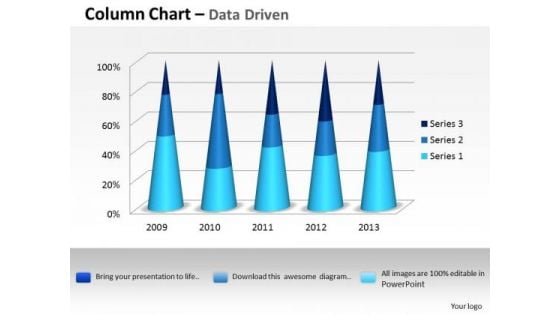
Data Analysis Excel 3d Process Variation Column Chart PowerPoint Templates
Put In A Dollop Of Our data analysis excel 3d process variation column chart Powerpoint Templates. Give Your Thoughts A Distinctive Flavor.

Data Analysis Excel Bar Graph To Compare PowerPoint Templates
Get The Domestics Right With Our data analysis excel bar graph to compare Powerpoint Templates. Create The Base For Thoughts To Grow.
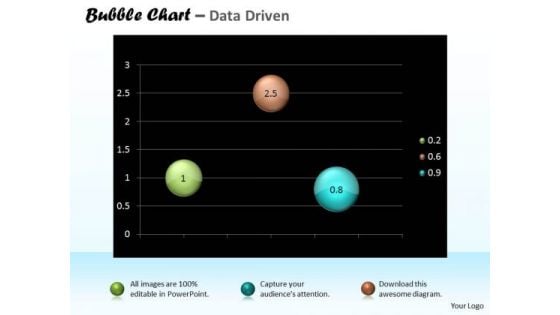
Data Analysis Excel Bubble Chart For Business Tasks PowerPoint Templates
Doll Up Your Thoughts With Our data analysis excel bubble chart for business tasks Powerpoint Templates. They Will Make A Pretty Picture.
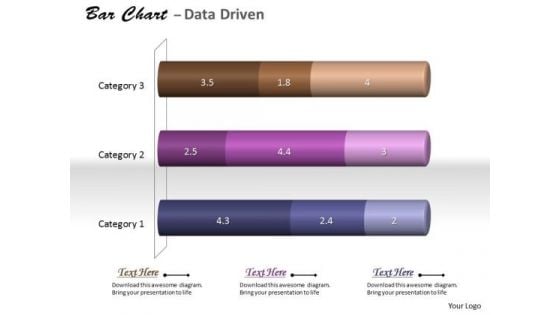
Data Analysis In Excel 3d Classification Of Chart PowerPoint Templates
With Our data analysis in excel 3d classification of chart Powerpoint Templates You Will Be Doubly Sure. They Possess That Stamp Of Authority.
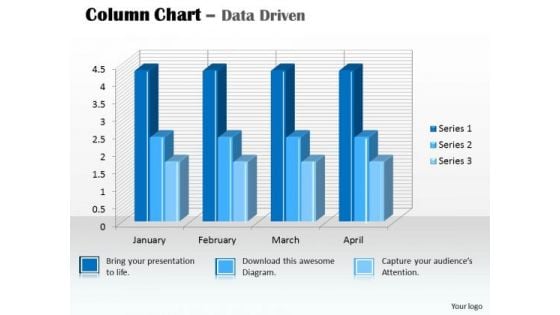
Data Analysis In Excel 3d Column Chart For PowerPoint Templates
Our data analysis in excel 3d column chart for Powerpoint Templates And Your Ideas Make A Great Doubles Pair. Play The Net With Assured Hands.
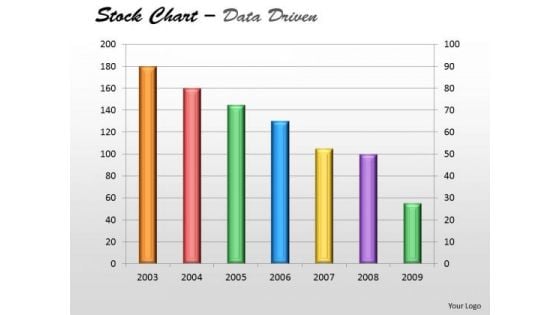
Data Analysis In Excel Of Stock Chart PowerPoint Templates
Plan Your Storyboard With Our data analysis in excel of stock chart Powerpoint Templates . Give An Outline To The Solutions You Have.
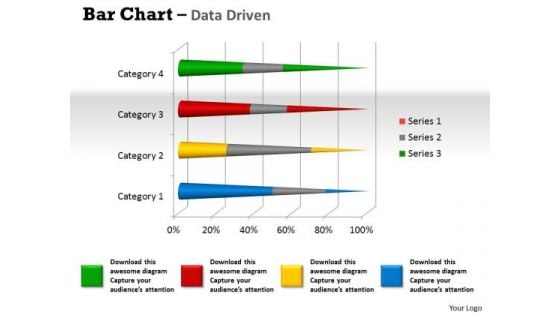
Data Analysis Programs 3d Bar Chart To Dispaly PowerPoint Templates
Lower The Drawbridge With Our data analysis programs 3d bar chart to dispaly Powerpoint Templates . Capture The Minds Of Your Audience.
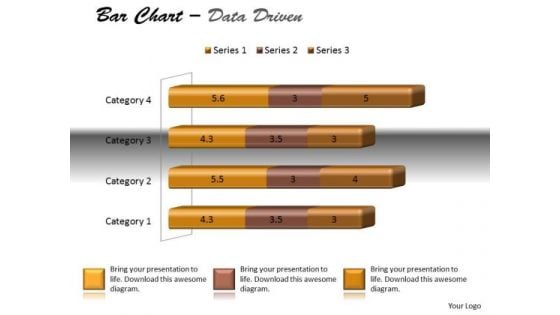
Data Analysis Techniques 3d Bar Chart For Modification PowerPoint Templates
Dreams Generate Thoughts, Thoughts Generate Ideas. Give Them Life With Our data analysis techniques 3d bar chart for modification Powerpoint Templates .
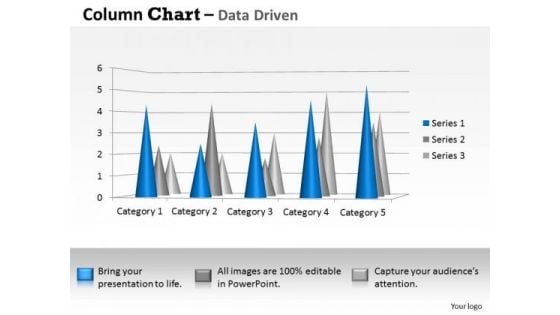
Data Analysis Techniques 3d Distribution Of In Sets PowerPoint Templates
Your Thoughts Will Be The Main Course. Provide The Dressing With Our data analysis techniques 3d distribution of in sets Powerpoint Templates .
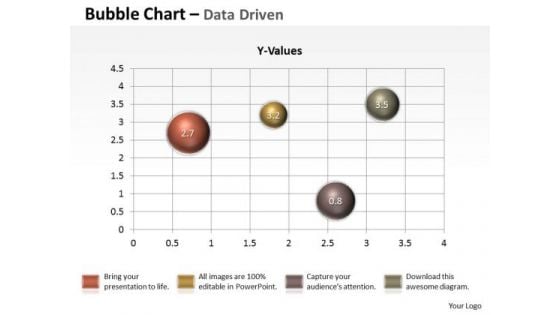
Data Analysis Techniques 3d Graphical Presentation Of PowerPoint Templates
Our data analysis techniques 3d graphical presentation of Powerpoint Templates Will Follow The Drill. They Accomplish The Task Assigned To Them.
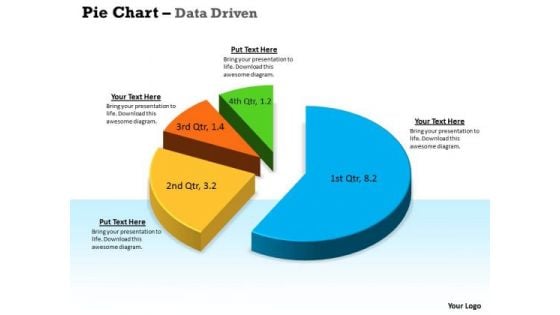
Data Analysis Techniques 3d In Segments Pie Chart PowerPoint Templates
Drink To The Success Of Your Campaign. Our data analysis techniques 3d in segments pie chart Powerpoint Templates Will Raise A Toast.
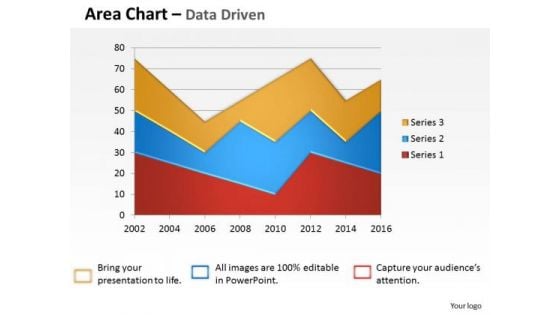
Data Analysis Template Driven Visualization Area Chart PowerPoint Slides Templates
Draw On The Energy Of Our data analysis template driven visualization area chart powerpoint slides Templates . Your Thoughts Will Perk Up.

Microsoft Excel Data Analysis Bar Chart To Handle PowerPoint Templates
Our microsoft excel data analysis bar chart to handle Powerpoint Templates And Your Ideas Make A Great Doubles Pair. Play The Net With Assured Hands.
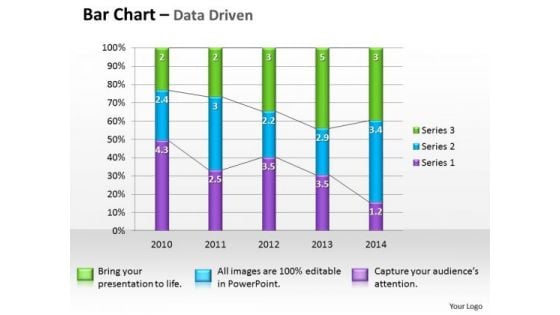
Microsoft Excel Data Analysis Bar Graph PowerPoint Templates
Double The Impact With Our microsoft excel data analysis bar graph Powerpoint Templates . Your Thoughts Will Have An Imposing Effect.
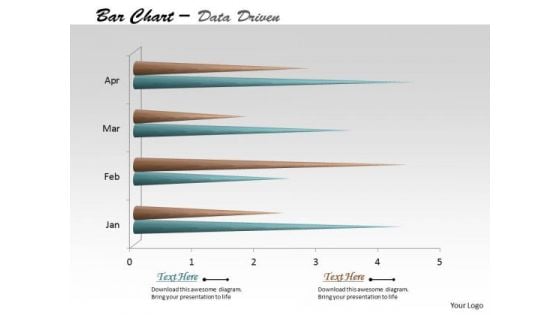
Multivariate Data Analysis Time Based Bar Chart PowerPoint Templates
Edit Your Work With Our multivariate data analysis time based bar chart Powerpoint Templates . They Will Help You Give The Final Form.
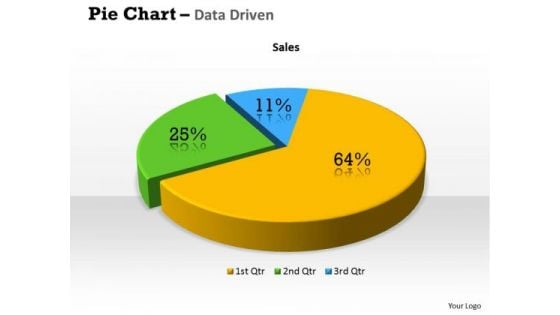
Quantitative Data Analysis 3d Percentage Ratio Pie Chart PowerPoint Templates
Plan Your Storyboard With Our quantitative data analysis 3d percentage ratio pie chart Powerpoint Templates . Give An Outline To The Solutions You Have.
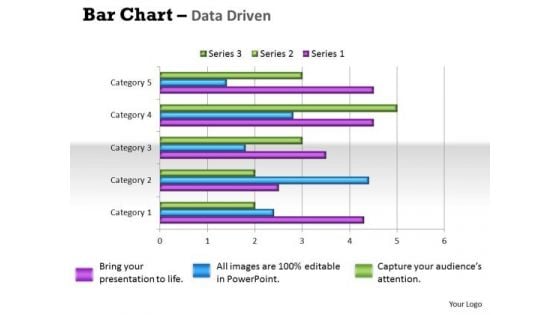
Quantitative Data Analysis Bar Chart For Different Categories PowerPoint Templates
Make Some Dough With Our quantitative data analysis bar chart for different categories Powerpoint Templates . Your Assets Will Rise Significantly.
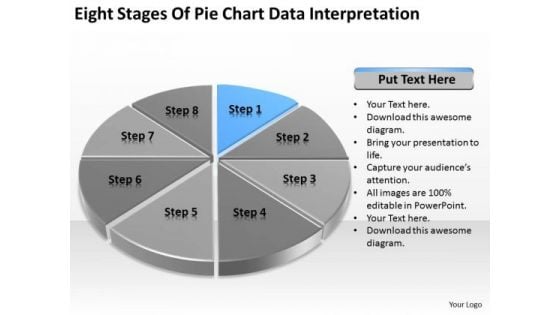
Eight Stages Of Pie Chart Data Interpretation Business Plan PowerPoint Templates
We present our eight stages of pie chart data interpretation business plan PowerPoint templates.Download and present our Competition PowerPoint Templates because Our PowerPoint Templates and Slides will embellish your thoughts. See them provide the desired motivation to your team. Download and present our Marketing PowerPoint Templates because You should Press the right buttons with our PowerPoint Templates and Slides. They will take your ideas down the perfect channel. Download our Arrows PowerPoint Templates because Your ideas provide food for thought. Our PowerPoint Templates and Slides will help you create a dish to tickle the most discerning palate. Use our Circle Charts PowerPoint Templates because You can Raise a toast with our PowerPoint Templates and Slides. Spread good cheer amongst your audience. Download and present our Business PowerPoint Templates because Our PowerPoint Templates and Slides will let your ideas bloom. Create a bed of roses for your audience.Use these PowerPoint slides for presentations relating to chart, graph, pie, 3d, diagram, graphic, icon, control, business, data, profit, market, sales, display, corporate, concept, render, success, presentation, finance, report, marketing, accounting, management, piece, strategy, money, growth, company, competition, progress, account, sheet, part, information, investment, improvement, banking, index, financial, reflect, results, performance, exchange. The prominent colors used in the PowerPoint template are Blue, Black, Gray. Our Eight Stages Of Pie Chart Data Interpretation Business Plan PowerPoint Templates capture the attention of your audience. With our money back guarantee you have nothing to lose.
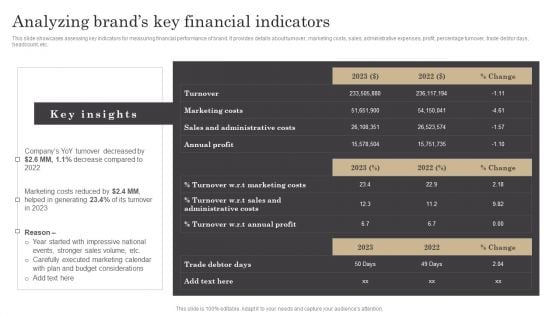
Analyzing Brands Key Financial Indicators Ppt Infographic Template Slides PDF
This slide showcases assessing key indicators for measuring financial performance of brand. It provides details about turnover, marketing costs, sales, administrative expenses, profit, percentage turnover, trade debtor days, headcount, etc. Are you in need of a template that can accommodate all of your creative concepts This one is crafted professionally and can be altered to fit any style. Use it with Google Slides or PowerPoint. Include striking photographs, symbols, depictions, and other visuals. Fill, move around, or remove text boxes as desired. Test out color palettes and font mixtures. Edit and save your work, or work with colleagues. Download Analyzing Brands Key Financial Indicators Ppt Infographic Template Slides PDF and observe how to make your presentation outstanding. Give an impeccable presentation to your group and make your presentation unforgettable.

Business Arrows PowerPoint Templates Business Data Mining Process Ppt Slides
Business Arrows PowerPoint Templates Business data mining process PPT Slides-Use this diagram to show Data Mining Process as a mechanism or group of parts performing one function or serving one purpose in a complex situation-Business Arrows PowerPoint Templates Business data mining process PPT Slides-This template can be used for presentations relating to Analysis, Anomaly, Artificial, Break, Clean, Computer, Cut, Data, Database, Decision, Detection, Discovery, Divide, Explore, Extract, Hammer, Helmet, Human, Index, Intelligence, Kdd, knowledge, Learning, Light, Mallet, Management, Mining, Model, Movement, Pattern, Predictive, Process, Records, Recycle, Repair, Safety, Science Crush doubts with our Business Arrows PowerPoint Templates Business Data Mining Process Ppt Slides. You will come out on top.
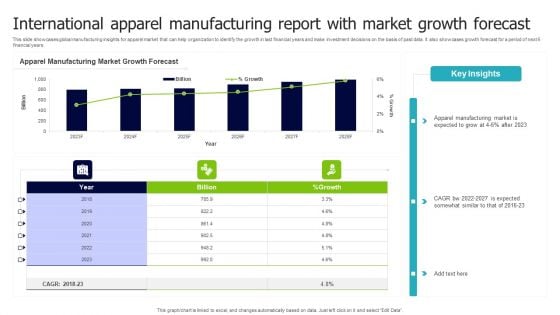
International Apparel Manufacturing Report With Market Growth Forecast Inspiration PDF
This slide showcases global manufacturing insights for apparel market that can help organization to identify the growth in last financial years and make investment decisions on the basis of past data. It also showcases growth forecast for a period of next 6 financial years. Pitch your topic with ease and precision using this International Apparel Manufacturing Report With Market Growth Forecast Inspiration PDF. This layout presents information on Apparel Manufacturing, Market Growth Forecast, Billion. It is also available for immediate download and adjustment. So, changes can be made in the color, design, graphics or any other component to create a unique layout.
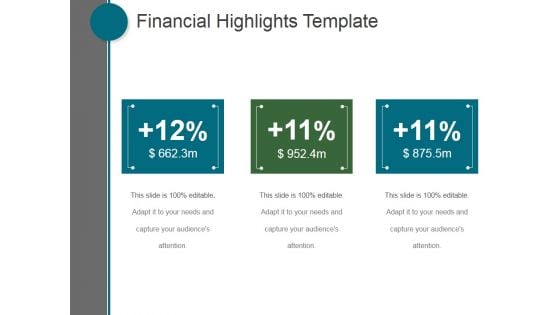
Financial Highlights Template Ppt PowerPoint Presentation Influencers
This is a financial highlights template ppt powerpoint presentation influencers. This is a three stage process. The stages in this process are business, marketing, management, finance, strategy.
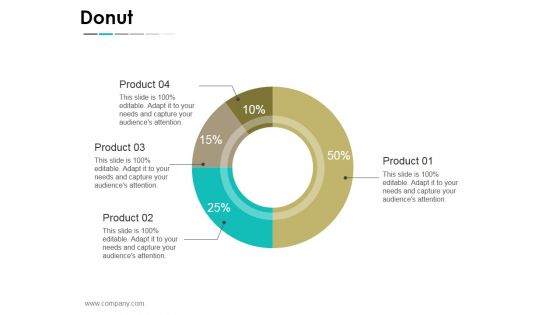
Donut Ppt PowerPoint Presentation Portfolio Examples
This is a donut ppt powerpoint presentation portfolio examples. This is a four stage process. The stages in this process are business, strategy, analysis, planning, donut, product.
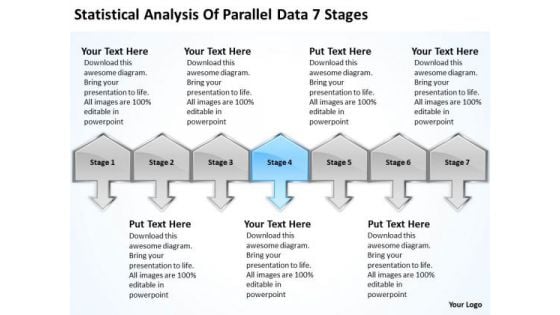
Analysis Of Parallel Data 7 Stages Ppt Cleaning Service Business Plan PowerPoint Templates
We present our analysis of parallel data 7 stages ppt cleaning service business plan PowerPoint templates.Use our Arrows PowerPoint Templates because you have a great training programme in mind to upgrade the skills of your staff. Use our Shapes PowerPoint Templates because you will be able to Highlight your ideas broad-based on strong fundamentals and illustrate how they step by step acheive the set growth factor. Present our Metaphors-Visual Concepts PowerPoint Templates because it helps to anticipate the doubts and questions in the minds of your colleagues and enlighten them with your inspired strategy to garner desired success. Present our Signs PowerPoint Templates because our presentation designs are for those on the go. Use our Business PowerPoint Templates because you have had a great year or so business wise. It is time to celebrate the efforts of your team.Use these PowerPoint slides for presentations relating to achieve, achievement, action, business, chinese, company, concept, conceptual, corporate, definition, idea, macro, market, nature, organization, paintbrush, plan, profit, research, results, sand, shape, single, success, successful, symbol, text, translation, treasure, vision, word. The prominent colors used in the PowerPoint template are Blue light, Gray, Black. People tell us our analysis of parallel data 7 stages ppt cleaning service business plan PowerPoint templates are Handsome. Use our concept PowerPoint templates and PPT Slides are Precious. Use our analysis of parallel data 7 stages ppt cleaning service business plan PowerPoint templates are Multicolored. PowerPoint presentation experts tell us our corporate PowerPoint templates and PPT Slides are topically designed to provide an attractive backdrop to any subject. People tell us our analysis of parallel data 7 stages ppt cleaning service business plan PowerPoint templates are Clever. Customers tell us our concept PowerPoint templates and PPT Slides are Glamorous. Take the plunge with our Analysis Of Parallel Data 7 Stages Ppt Cleaning Service Business Plan PowerPoint Templates. Success will surely ensue.
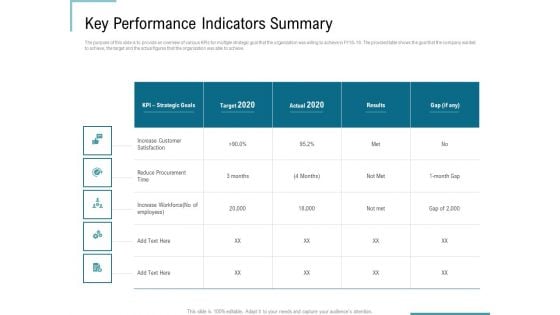
Corporate Execution Financial Liability Report Key Performance Indicators Summary Rules PDF
Presenting this set of slides with name corporate execution financial liability report key performance indicators summary rules pdf. The topics discussed in these slides are procurement, strategic, goals, target, procurement. This is a completely editable PowerPoint presentation and is available for immediate download. Download now and impress your audience.
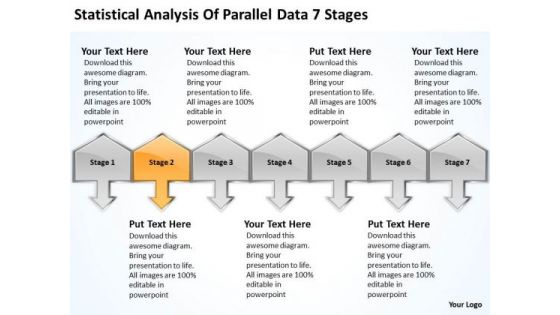
Analysis Of Parallel Data 7 Stages Ppt What Business Planning PowerPoint Templates
We present our analysis of parallel data 7 stages ppt what business planning PowerPoint templates.Use our Arrows PowerPoint Templates because you have the process in your head, our template design showing will illuminate your thoughts. Present our Shapes PowerPoint Templates because this template contains the material to highlight the key issues of your presentation. Download our Metaphors-Visual Concepts PowerPoint Templates because you have good reasons to back up the strength of your belief. Present our Signs PowerPoint Templates because you have made significant headway in this field. Download our Business PowerPoint Templates because the fruits of your labour are beginning to show.Enlighten them on the great plans you have for their enjoyment.Use these PowerPoint slides for presentations relating to achieve, achievement, action, business, chinese, company, concept, conceptual, corporate, definition, idea, macro, market, nature, organization, paintbrush, plan, profit, research, results, sand, shape, single, success, successful, symbol, text, translation, treasure, vision, word. The prominent colors used in the PowerPoint template are Orange, Gray, Black. People tell us our analysis of parallel data 7 stages ppt what business planning PowerPoint templates are visually appealing. Use our concept PowerPoint templates and PPT Slides are Festive. Use our analysis of parallel data 7 stages ppt what business planning PowerPoint templates are Awesome. PowerPoint presentation experts tell us our conceptual PowerPoint templates and PPT Slides are No-nonsense. People tell us our analysis of parallel data 7 stages ppt what business planning PowerPoint templates are Fun. Customers tell us our conceptual PowerPoint templates and PPT Slides will impress their bosses and teams. Bring on the heat with our Analysis Of Parallel Data 7 Stages Ppt What Business Planning PowerPoint Templates. All your doubts will begin to evaporate.
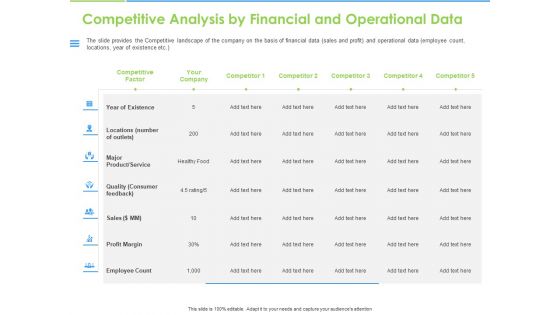
Convertible Bonds Pitch Deck For Increasing Capitals Competitive Analysis By Financial And Operational Data Microsoft PDF
The slide provides the Competitive landscape of the company on the basis of financial data sales and profit and operational data employee count, locations, year of existence etc. Deliver an awe-inspiring pitch with this creative convertible bonds pitch deck for increasing capitals competitive analysis by financial and operational data microsoft pdf bundle. Topics like locations number outlets, major product, service, quality consumer feedback, sales, profit margin, employee count, year existence can be discussed with this completely editable template. It is available for immediate download depending on the needs and requirements of the user.
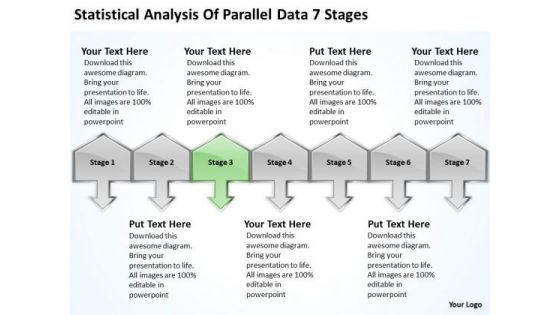
Analysis Of Parallel Data 7 Stages Ppt Franchise Business Plan Sample PowerPoint Slides
We present our analysis of parallel data 7 stages ppt franchise business plan sample PowerPoint Slides.Download our Arrows PowerPoint Templates because You have gained great respect for your brilliant ideas. Use our PowerPoint Templates and Slides to strengthen and enhance your reputation. Download and present our Shapes PowerPoint Templates because you can see clearly through to the bigger bowl ahead. Time your jump to perfection and hit the nail on the head. Download our Metaphors-Visual Concepts PowerPoint Templates because you know that the core of any organisation is the people who work for it. Use our Signs PowerPoint Templates because support groups are an essential element of the on going struggle against cancer. Download our Business PowerPoint Templates because this diagram can set an example to enthuse your team with the passion and fervour of your ideas.Use these PowerPoint slides for presentations relating to achieve, achievement, action, business, chinese, company, concept, conceptual, corporate, definition, idea, macro, market, nature, organization, paintbrush, plan, profit, research, results, sand, shape, single, success, successful, symbol, text, translation, treasure, vision, word. The prominent colors used in the PowerPoint template are Green, Gray, Black. People tell us our analysis of parallel data 7 stages ppt franchise business plan sample PowerPoint Slides are Quaint. Use our action PowerPoint templates and PPT Slides are Nifty. Use our analysis of parallel data 7 stages ppt franchise business plan sample PowerPoint Slides are Ultra. PowerPoint presentation experts tell us our corporate PowerPoint templates and PPT Slides are Magical. People tell us our analysis of parallel data 7 stages ppt franchise business plan sample PowerPoint Slides are Spiffy. Customers tell us our corporate PowerPoint templates and PPT Slides are Dynamic. Preach the value of good business ethics. Our Analysis Of Parallel Data 7 Stages Ppt Franchise Business Plan Sample PowerPoint Slides will keep the faith.

Donut Pie Chart Ppt PowerPoint Presentation File Slideshow
This is a donut pie chart ppt powerpoint presentation file slideshow. This is a four stage process. The stages in this process are business, strategy, analysis, planning, donut pie chart.
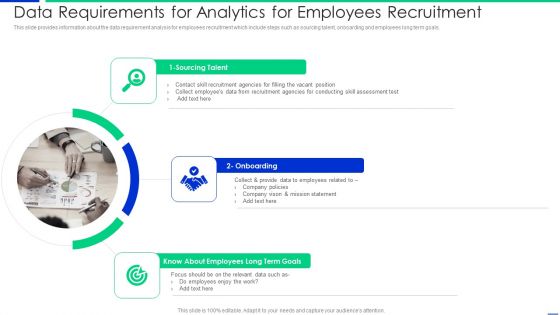
Data Requirements For Analytics For Employees Recruitment Professional PDF
This slide provides information about the data requirement analysis for employees recruitment which include steps such as sourcing talent, onboarding and employees long term goals. Persuade your audience using this data requirements for analytics for employees recruitment professional pdf. This PPT design covers three stages, thus making it a great tool to use. It also caters to a variety of topics including recruitment, goals, employees. Download this PPT design now to present a convincing pitch that not only emphasizes the topic but also showcases your presentation skills.
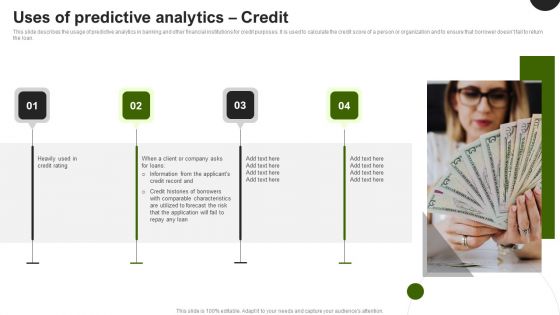
Predictive Analytics In The Age Of Big Data Uses Of Predictive Analytics Credit Ideas PDF
This slide describes the usage of predictive analytics in banking and other financial institutions for credit purposes. It is used to calculate the credit score of a person or organization and to ensure that borrower doesnot fail to return the loan. Present like a pro with Predictive Analytics In The Age Of Big Data Uses Of Predictive Analytics Credit Ideas PDF Create beautiful presentations together with your team, using our easy to use presentation slides. Share your ideas in real time and make changes on the fly by downloading our templates. So whether you are in the office, on the go, or in a remote location, you can stay in sync with your team and present your ideas with confidence. With Slidegeeks presentation got a whole lot easier. Grab these presentations today.


 Continue with Email

 Home
Home


