Revenue Dashboard
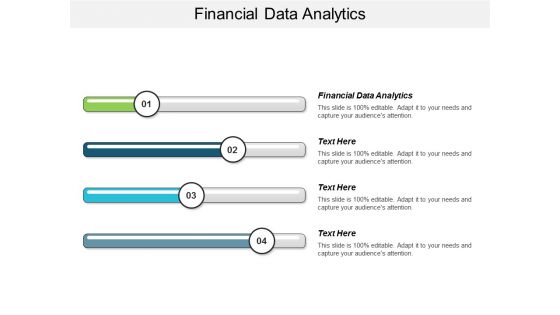
Financial Data Analytics Ppt Powerpoint Presentation Show Smartart Cpb
This is a financial data analytics ppt powerpoint presentation show smartart cpb. This is a four stage process. The stages in this process are financial data analytics.
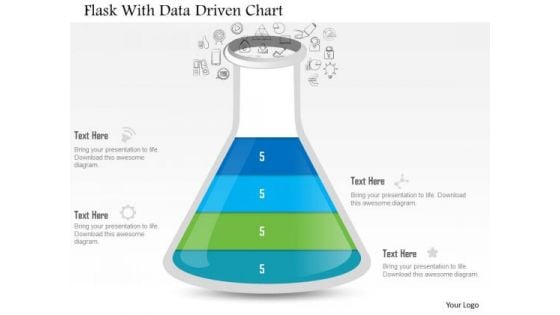
Business Diagram Flask With Data Driven Chart PowerPoint Slide
This data driven diagram has been designed with flask graphics. Download this diagram to give your presentations more effective look. It helps in clearly conveying your message to clients and audience.
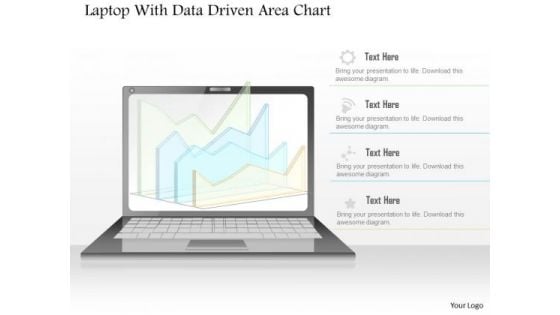
Business Diagram Laptop With Data Driven Area Chart PowerPoint Slide
This diagram has been designed with laptop and data driven area chart. Download this diagram to give your presentations more effective look. It helps in clearly conveying your message to clients and audience.
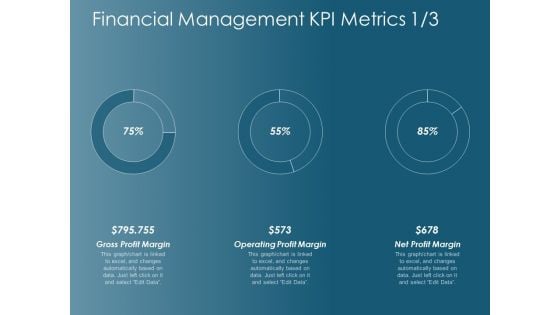
Financial Management Kpi Metrics Operating Profit Margin Ppt Powerpoint Presentation Infographic Template Images
This is a financial management kpi metrics operating profit margin ppt powerpoint presentation infographic template images. This is a three stage process. The stages in this process are finance, marketing, management, investment, analysis.
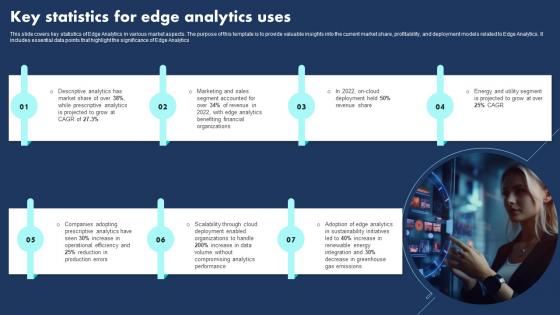
Key Statistics For Edge Analytics Uses Introduction Pdf
This slide covers key statistics of Edge Analytics in various market aspects. The purpose of this template is to provide valuable insights into the current market share, profitability, and deployment models related to Edge Analytics. It includes essential data points that highlight the significance of Edge Analytics.Showcasing this set of slides titled Key Statistics For Edge Analytics Uses Introduction Pdf The topics addressed in these templates are Descriptive Analytics, Production Errors, Decrease Greenhouse All the content presented in this PPT design is completely editable. Download it and make adjustments in color, background, font etc. as per your unique business setting. This slide covers key statistics of Edge Analytics in various market aspects. The purpose of this template is to provide valuable insights into the current market share, profitability, and deployment models related to Edge Analytics. It includes essential data points that highlight the significance of Edge Analytics.

Financial Data Revelation To Varied Stakeholders Limitations Related To Financial Reporting Management Information PDF
This slide shows the limitations related to managing financial reports such as not provides full information, other sources, etc. This Financial Data Revelation To Varied Stakeholders Limitations Related To Financial Reporting Management Information PDF is perfect for any presentation, be it in front of clients or colleagues. It is a versatile and stylish solution for organizing your meetings. The Financial Data Revelation To Varied Stakeholders Limitations Related To Financial Reporting Management Information PDF features a modern design for your presentation meetings. The adjustable and customizable slides provide unlimited possibilities for acing up your presentation. Slidegeeks has done all the homework before launching the product for you. So, do not wait, grab the presentation templates today.
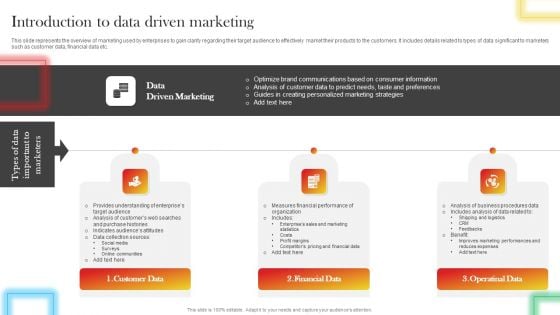
Introduction To Data Driven Marketing Portrait PDF
This slide represents the overview of marketing used by enterprises to gain clarity regarding their target audience to effectively market their products to the customers. It includes details related to types of data significant to marketers such as customer data, financial data etc. Explore a selection of the finest Introduction To Data Driven Marketing Portrait PDF here. With a plethora of professionally designed and pre-made slide templates, you can quickly and easily find the right one for your upcoming presentation. You can use our Introduction To Data Driven Marketing Portrait PDF to effectively convey your message to a wider audience. Slidegeeks has done a lot of research before preparing these presentation templates. The content can be personalized and the slides are highly editable. Grab templates today from Slidegeeks.
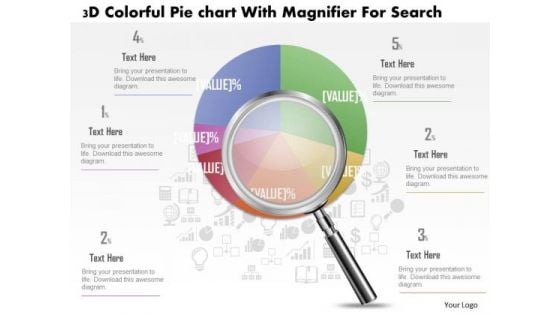
Business Diagram 3d Colorful Pie Graph With Magnifier Data Search PowerPoint Slide
This business slide displays 3d colorful pie graph with magnifier. This diagram is a data visualization tool that gives you a simple way to present statistical information. This slide helps your audience examine and interpret the data you present.

Business Diagram Data Driven Pie Chart Inside The Magnifier PowerPoint Slide
This business slide displays 3d colorful pie graph with magnifier. This diagram is a data visualization tool that gives you a simple way to present statistical information. This slide helps your audience examine and interpret the data you present.
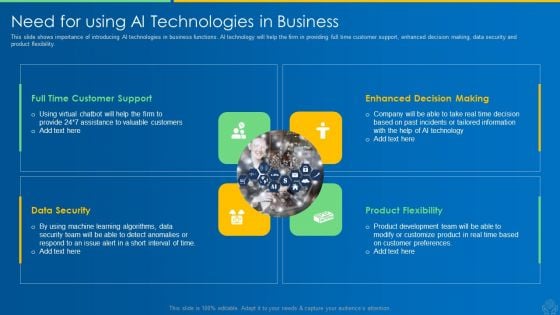
AI And ML Driving Monetary Value For Organization Need For Using AI Technologies In Business Portrait PDF
This slide shows importance of introducing AI technologies in business functions. AI technology will help the firm in providing full time customer support, enhanced decision making, data security and product flexibility. Presenting ai and ml driving monetary value for organization need for using ai technologies in business portrait pdf to provide visual cues and insights. Share and navigate important information on three stages that need your due attention. This template can be used to pitch topics like full time customer support, data security, product flexibility, enhanced decision making. In addtion, this PPT design contains high resolution images, graphics, etc, that are easily editable and available for immediate download.
Financial Management And Research Vector Icon Ppt PowerPoint Presentation Styles Outfit PDF
Presenting this set of slides with name financial management and research vector icon ppt powerpoint presentation styles outfit pdf. This is a two stage process. The stages in this process are financial management and research vector icon. This is a completely editable PowerPoint presentation and is available for immediate download. Download now and impress your audience.
Financial Calculations Sumbols And Signs Vector Ilustration Ppt PowerPoint Presentation File Inspiration PDF
Presenting this set of slides with name financial calculations sumbols and signs vector ilustration ppt powerpoint presentation file inspiration pdf. This is a three stage process. The stages in this process are financial calculations sumbols and signs vector ilustration. This is a completely editable PowerPoint presentation and is available for immediate download. Download now and impress your audience.
Vector Of Sales Planning To Ascertain Annual Financial Goals Ppt PowerPoint Presentation Icon Infographics PDF
Presenting this set of slides with name vector of sales planning to ascertain annual financial goals ppt powerpoint presentation icon infographics pdf. This is a three stage process. The stages in this process are vector of sales planning to ascertain annual financial goals. This is a completely editable PowerPoint presentation and is available for immediate download. Download now and impress your audience.
Vector Showing Financial Risk Mitigation Procedure Ppt PowerPoint Presentation Infographic Template Gridlines PDF
Presenting vector showing financial risk mitigation procedure ppt powerpoint presentation infographic template gridlines pdf to dispense important information. This template comprises three stages. It also presents valuable insights into the topics including vector showing financial risk mitigation procedure. This is a completely customizable PowerPoint theme that can be put to use immediately. So, download it and address the topic impactfully.

Benefits Of Implementing Artificial Intelligence In Analytics Data Analytics SS V
This slide outlines key advantages of leveraging artificial intelligence in analytics aimed at helping businesses objectively predict results of the actions before implementation in real world . It covers the benefits such as enhanced speed, better predictive capabilities, improved customer experience and reduced costs.Make sure to capture your audiences attention in your business displays with our gratis customizable Benefits Of Implementing Artificial Intelligence In Analytics Data Analytics SS V. These are great for business strategies, office conferences, capital raising or task suggestions. If you desire to acquire more customers for your tech business and ensure they stay satisfied, create your own sales presentation with these plain slides. This slide outlines key advantages of leveraging artificial intelligence in analytics aimed at helping businesses objectively predict results of the actions before implementation in real world . It covers the benefits such as enhanced speed, better predictive capabilities, improved customer experience and reduced costs.
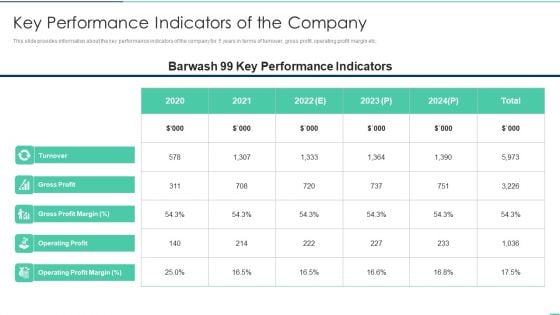
Key Performance Indicators Of The Company Ppt Professional Skills PDF
Deliver and pitch your topic in the best possible manner with this key performance indicators of the company ppt professional skills pdf. Use them to share invaluable insights on gross profit, turnover, gross profit margin, operating profit and impress your audience. This template can be altered and modified as per your expectations. So, grab it now.
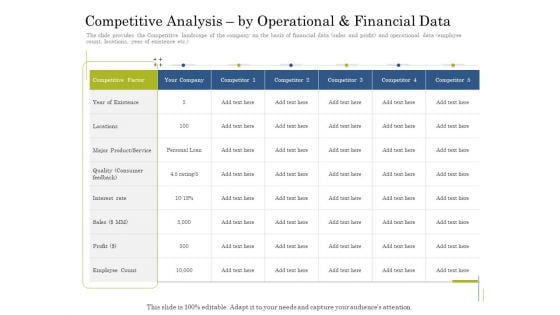
Supplementary Debt Financing Pitch Deck Competitive Analysis By Operational And Financial Data Mockup PDF
Deliver and pitch your topic in the best possible manner with this supplementary debt financing pitch deck competitive analysis by operational and financial data mockup pdf. Use them to share invaluable insights on sales, service, existence, competitive, quality and impress your audience. This template can be altered and modified as per your expectations. So, grab it now.
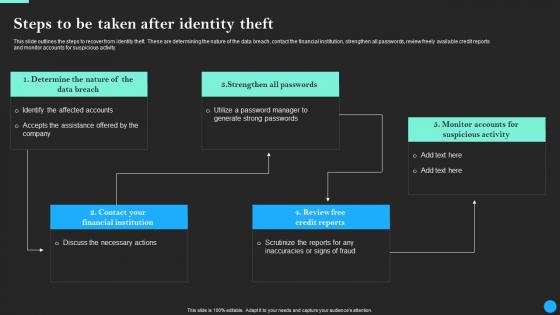
Steps To Be Taken After Identity Theft Data Breach Prevention Microsoft Pdf
Do you have to make sure that everyone on your team knows about any specific topic I yes, then you should give Steps To Be Taken After Identity Theft Data Breach Prevention Microsoft Pdf a try. Our experts have put a lot of knowledge and effort into creating this impeccable Steps To Be Taken After Identity Theft Data Breach Prevention Microsoft Pdf. You can use this template for your upcoming presentations, as the slides are perfect to represent even the tiniest detail. You can download these templates from the Slidegeeks website and these are easy to edit. So grab these today This slide outlines the steps to recover from identity theft. These are determining the nature of the data breach, contact the financial institution, strengthen all passwords, review freely available credit reports and monitor accounts for suspicious activity.
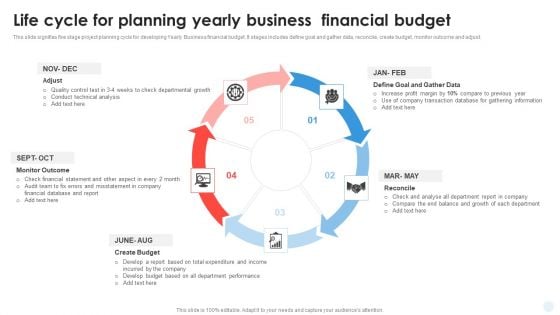
Life Cycle For Planning Yearly Business Financial Budget Template PDF
This slide signifies five stage project planning cycle for developing Yearly Business financial budget. It stages includes define goal and gather data, reconcile, create budget, monitor outcome and adjust.Persuade your audience using this Life Cycle For Planning Yearly Business Financial Budget Template PDF. This PPT design covers five stages, thus making it a great tool to use. It also caters to a variety of topics including Conduct Technical Analysis, Misstatement Company, Transaction Database. Download this PPT design now to present a convincing pitch that not only emphasizes the topic but also showcases your presentation skills.
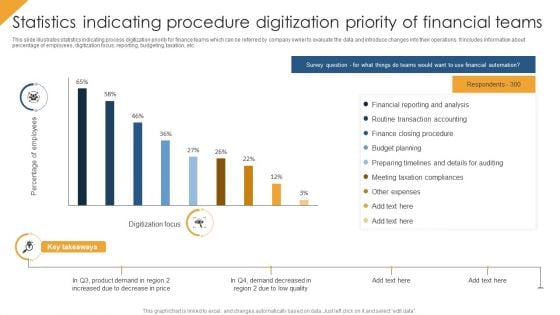
Statistics Indicating Procedure Digitization Priority Of Financial Teams Themes PDF
This slide illustrates statistics indicating process digitization priority for finance teams which can be referred by company owner to evaluate the data and introduce changes into their operations. It includes information about percentage of employees, digitization focus, reporting, budgeting, taxation, etc. Showcasing this set of slides titled Statistics Indicating Procedure Digitization Priority Of Financial Teams Themes PDF. The topics addressed in these templates are Budget Planning, Financial Reporting And Analysis, Other Expenses. All the content presented in this PPT design is completely editable. Download it and make adjustments in color, background, font etc. as per your unique business setting.
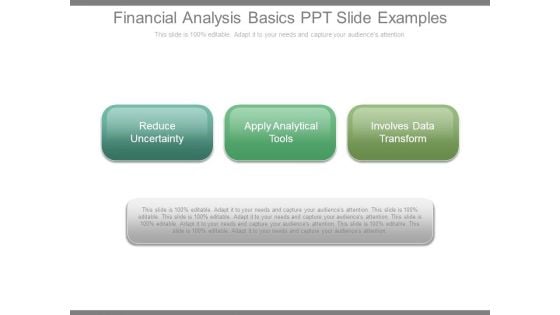
Financial Analysis Basics Ppt Slide Examples
This is a financial analysis basics ppt slide examples. This is a three stage process. The stages in this process are reduce uncertainty, apply analytical tools, involves data transform.
Business Diagram 3d Capsule With Multiple Icons For Business Data Flow PowerPoint Slide
This diagram has been designed with 3d graphic of capsule with multiple icons. This data driven PowerPoint slide can be used to give your presentations more effective look. It helps in clearly conveying your message to clients and audience.
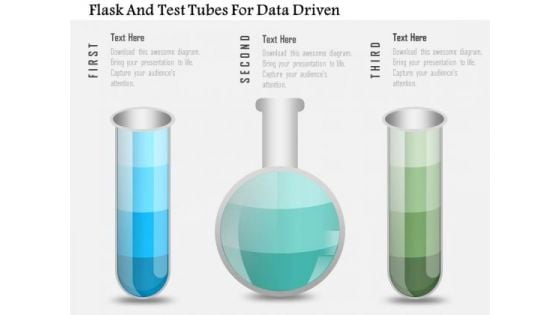
Business Diagram Flask And Test Tubes For Data Driven PowerPoint Slide
This data driven diagram has been designed with flask and test tubes. Download this diagram to give your presentations more effective look. It helps in clearly conveying your message to clients and audience.

Business Diagram Three Heads With Pie For Data Driven Technology PowerPoint Slide
This business diagram displays three human faces with pie charts. This Power Point template has been designed to compare and present business data. You may use this diagram to impart professional appearance to your presentations.
Company Financials Report Icon Illustrating Product Financial Performance Infographics PDF
Persuade your audience using this Company Financials Report Icon Illustrating Product Financial Performance Infographics PDF. This PPT design covers one stage, thus making it a great tool to use. It also caters to a variety of topics including Company Financials, Report Icon, Illustrating Product. Download this PPT design now to present a convincing pitch that not only emphasizes the topic but also showcases your presentation skills.
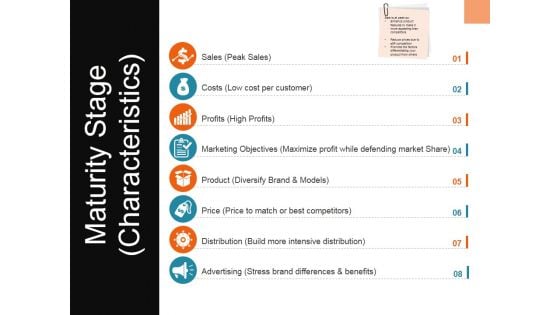
Maturity Stage Characteristics Ppt PowerPoint Presentation Slides Show
This is a maturity stage characteristics ppt powerpoint presentation slides show. This is a eight stage process. The stages in this process are sales, costs, profits, marketing objectives, product.
Business Financial Data Analysis Vector Icon Ppt PowerPoint Presentation File Samples PDF
Persuade your audience using this business financial data analysis vector icon ppt powerpoint presentation file samples pdf. This PPT design covers three stages, thus making it a great tool to use. It also caters to a variety of topics including business financial data analysis vector icon. Download this PPT design now to present a convincing pitch that not only emphasizes the topic but also showcases your presentation skills.
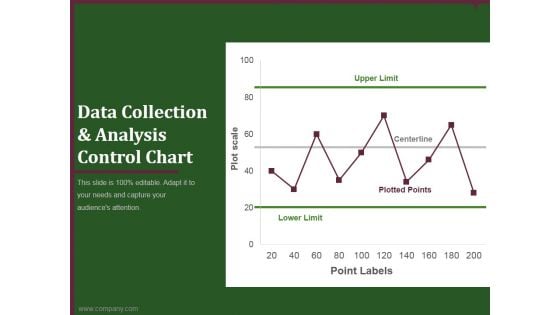
data collection and analysis control chart ppt powerpoint presentation styles
This is a data collection and analysis control chart ppt powerpoint presentation styles. This is a one stage process. The stages in this process are upper limit, centerline, plotted points, lower limit, point labels.
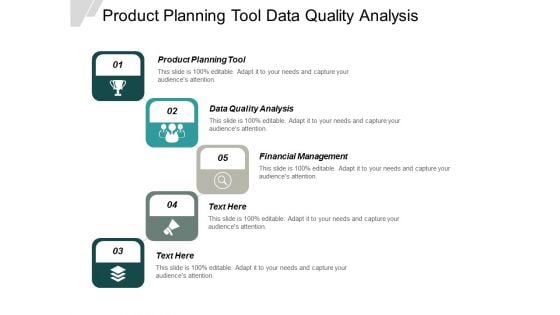
Product Planning Tool Data Quality Analysis Financial Management Ppt PowerPoint Presentation Styles Graphics Template
This is a product planning tool data quality analysis financial management ppt powerpoint presentation styles graphics template. This is a five stage process. The stages in this process are product planning tool, data quality analysis, financial management.

We Shall Overcome Business PowerPoint Templates And PowerPoint Backgrounds 0711
Microsoft PowerPoint Template and Background with the hand showing successful growth of stock market trends Your ideas are actually aspirational. Drive the ambition of your audience with our We Shall Overcome Business PowerPoint Templates And PowerPoint Backgrounds 0711.
Financial Planning Process Sample Diagram Ppt Slide
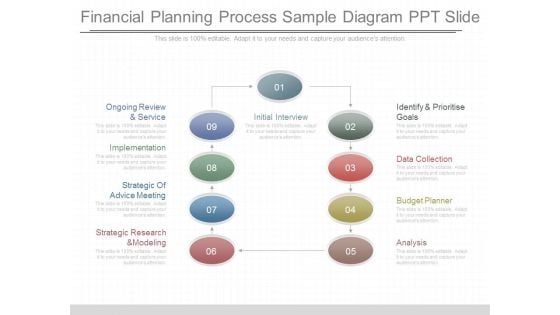
This is a financial planning process sample diagram ppt slide. This is a nine stage process. The stages in this process are initial interview, identify and prioritise goals, data collection, budget planner, analysis, strategic research and modeling, strategic of advice meeting, implementation, ongoing review and service.
Incoming Orders Storage Reporting Presentation Portfolio
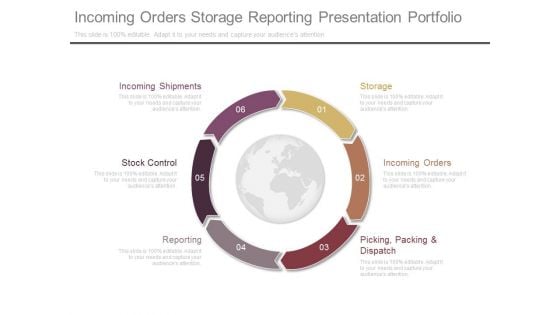
This is a incoming orders storage reporting presentation portfolio. This is a six stage process. The stages in this process are storage, incoming orders, picking packing and dispatch, reporting, stock control, incoming shipments.

Raising Stocks Business PowerPoint Templates And PowerPoint Backgrounds 0811
Microsoft PowerPoint Template and Background with stock market positive trend Recruit leaders with our Raising Stocks Business PowerPoint Templates And PowerPoint Backgrounds 0811. Download without worries with our money back guaranteee.
Test Tubes With Financial Data In Percentage Ratio Powerpoint Slides

Graph02 Business PowerPoint Templates And PowerPoint Backgrounds 0511
Microsoft PowerPoint Template and Background with line graph, showing up trend in business Draw them to your thoughts with our Graph02 Business PowerPoint Templates And PowerPoint Backgrounds 0511. They will cease to sit on the fence.
Funnel Ppt PowerPoint Presentation Backgrounds
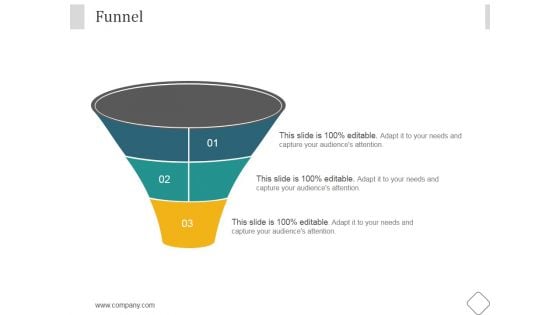
This is a funnel ppt powerpoint presentation backgrounds. This is a three stage process. The stages in this process are business, marketing, management, funnel, planning.
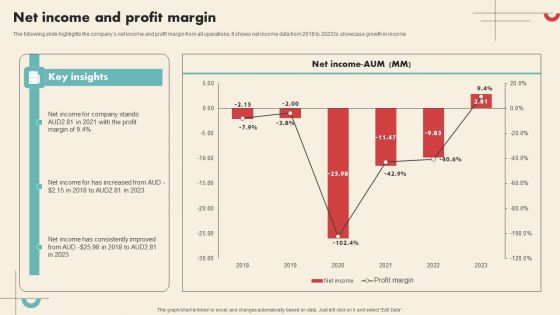
Data Driven Marketing Solutions Firm Company Profile Net Income And Profit Margin Portrait PDF
The following slide highlights the companys net income and profit margin from all operations. It shows net income data from 2018 to 2023 to showcase growth in income Explore a selection of the finest Data Driven Marketing Solutions Firm Company Profile Net Income And Profit Margin Portrait PDF here. With a plethora of professionally designed and pre made slide templates, you can quickly and easily find the right one for your upcoming presentation. You can use our Data Driven Marketing Solutions Firm Company Profile Net Income And Profit Margin Portrait PDF to effectively convey your message to a wider audience. Slidegeeks has done a lot of research before preparing these presentation templates. The content can be personalized and the slides are highly editable. Grab templates today from Slidegeeks.
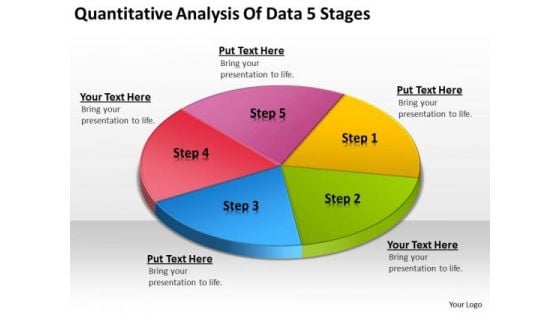
Quantitative Analysis Of Data 5 Stages Business Plan For Bar PowerPoint Slides
We present our quantitative analysis of data 5 stages business plan for bar PowerPoint Slides.Use our Circle Charts PowerPoint Templates because Our PowerPoint Templates and Slides will give good value for money. They also have respect for the value of your time. Download our Business PowerPoint Templates because Our PowerPoint Templates and Slides will let you Leave a lasting impression to your audiences. They possess an inherent longstanding recall factor. Use our Shapes PowerPoint Templates because You can safely bank on our PowerPoint Templates and Slides. They will provide a growth factor to your valuable thoughts. Use our Signs PowerPoint Templates because You have gained great respect for your brilliant ideas. Use our PowerPoint Templates and Slides to strengthen and enhance your reputation. Download and present our Metaphors-Visual Concepts PowerPoint Templates because Our PowerPoint Templates and Slides are Clear and concise. Use them and dispel any doubts your team may have.Use these PowerPoint slides for presentations relating to business, chart, circle, circular, diagram, economy, finance, framework, graph, isolated, percentage, pie chart, results, scheme, statistics, stats, strategy, success. The prominent colors used in the PowerPoint template are Purple, Yellow, Green. Examine all factors in detail. Give each one close attention with our Quantitative Analysis Of Data 5 Stages Business Plan For Bar PowerPoint Slides.
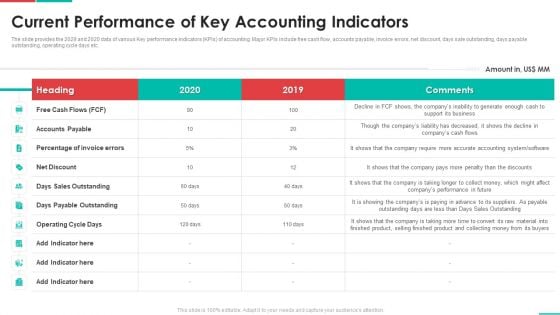
Roadmap For Financial Accounting Transformation Current Performance Of Key Accounting Indicators Elements PDF
The slide provides the 2029 and 2020 data of various Key performance indicators KPIs of accounting. Major KPIs include free cash flow, accounts payable, invoice errors, net discount, days sale outstanding, days payable outstanding, operating cycle days etc. Deliver an awe inspiring pitch with this creative roadmap for financial accounting transformation current performance of key accounting indicators elements pdf bundle. Topics like accounts payable, operating cycle days, days payable outstanding, net discount can be discussed with this completely editable template. It is available for immediate download depending on the needs and requirements of the user.
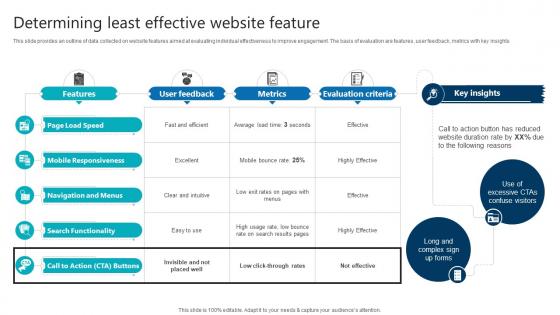
Determining Least Effective Website Feature Product Analytics Implementation Data Analytics V
This slide provides an outline of data collected on website features aimed at evaluating individual effectiveness to improve engagement. The basis of evaluation are features, user feedback, metrics with key insights Make sure to capture your audiences attention in your business displays with our gratis customizable Determining Least Effective Website Feature Product Analytics Implementation Data Analytics V. These are great for business strategies, office conferences, capital raising or task suggestions. If you desire to acquire more customers for your tech business and ensure they stay satisfied, create your own sales presentation with these plain slides. This slide provides an outline of data collected on website features aimed at evaluating individual effectiveness to improve engagement. The basis of evaluation are features, user feedback, metrics with key insights
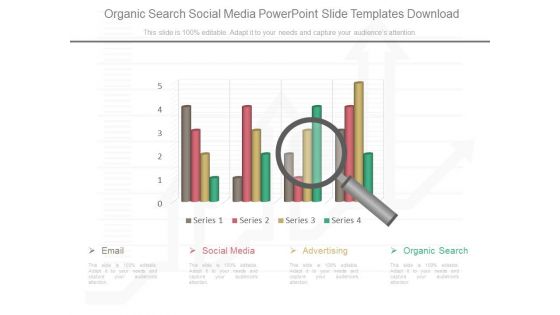
Organic Search Social Media Powerpoint Slide Templates Download
This is a organic search social media powerpoint slide templates download. This is a four stage process. The stages in this process are email, social media, advertising, organic search, series.
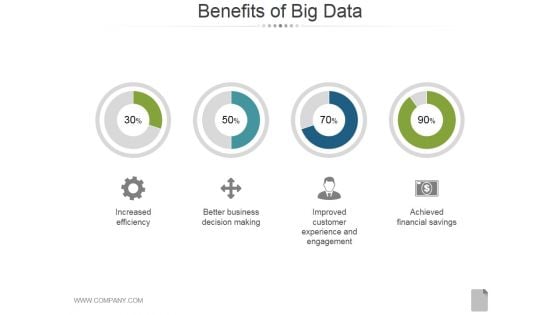
Benefits Of Big Data Ppt PowerPoint Presentation Inspiration
This is a benefits of big data ppt powerpoint presentation inspiration. This is a four stage process. The stages in this process are increased efficiency, better business decision making, improved customer experience and engagement, achieved financial savings.
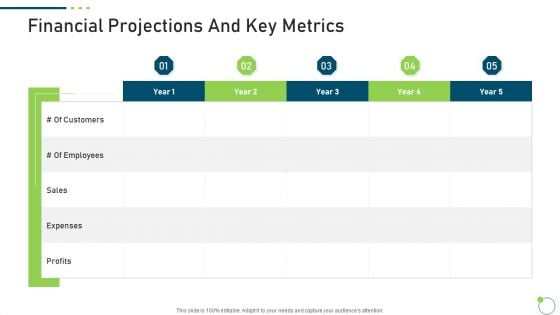
Investor Pitch Deck New Venture Capital Raising Financial Projections And Key Metrics Ideas PDF
Deliver and pitch your topic in the best possible manner with this investor pitch deck new venture capital raising financial projections and key metrics ideas pdf. Use them to share invaluable insights on sales, expenses, profits and impress your audience. This template can be altered and modified as per your expectations. So, grab it now.
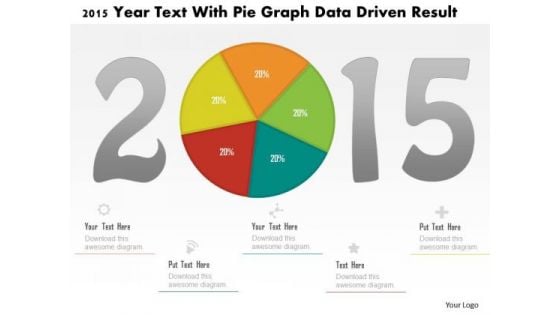
Business Diagram 2015 Year Text With Pie Graph Data Driven Result PowerPoint Slide
This business diagram displays 2015 year numbers with pie chart. This diagram is suitable to display business strategy for year 2015. Download this professional slide to present information in an attractive manner
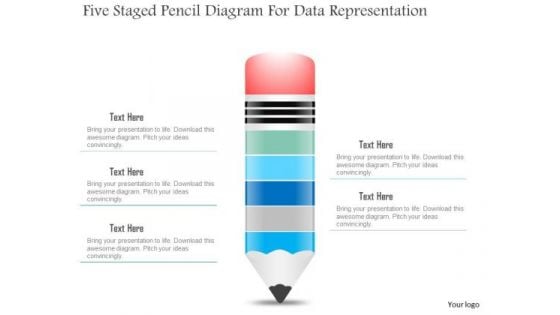
Business Diagram Five Staged Pencil Diagram For Data Representation PowerPoint Slide
This business slide displays five staged pencil diagram. It contains pencil graphic divided into five parts. This diagram slide depicts processes, stages, steps, points, options and education information display. Use this diagram, in your presentations to express your views innovatively.
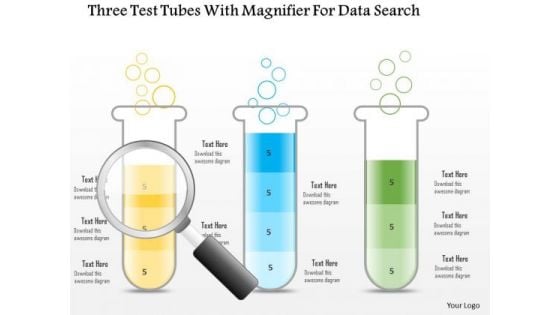
Business Diagram Three Test Tubes With Magnifier For Data Search PowerPoint Slide
This business diagram displays three test tubes with magnifying glass. This diagram is suitable to depict flow of business activities or steps. Download this professional slide to present information in an attractive manner.
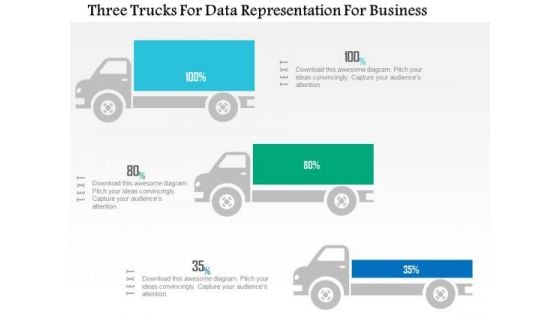
Business Diagram Three Trucks For Data Representation For Business PowerPoint Slide
This business diagram displays three trucks graphic. This diagram contains trucks for percentage value growth. Use this diagram to display business growth over a period of time.
Global Market Intelligence With Competitiveness And Diversification Ppt PowerPoint Presentation Icon Designs Download
Presenting this set of slides with name global market intelligence with competitiveness and diversification ppt powerpoint presentation icon designs download. This is a six stage process. The stages in this process are global competitiveness basics, diversifying sources of income, manageable risk, demanding customers. This is a completely editable PowerPoint presentation and is available for immediate download. Download now and impress your audience.
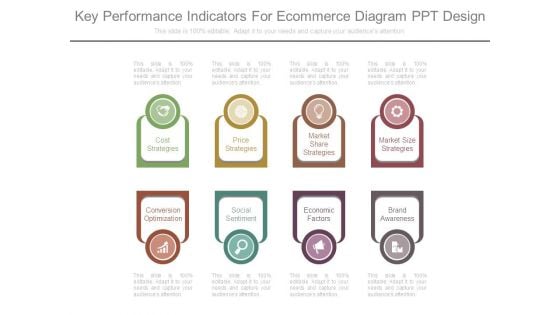
Key Performance Indicators For Ecommerce Diagram Ppt Design
This is a key performance indicators for ecommerce diagram ppt design. This is a eight stage process. The stages in this process are cost strategies, price strategies, market share strategies, market size strategies, conversion optimization, social sentiment, economic factors, brand awareness.
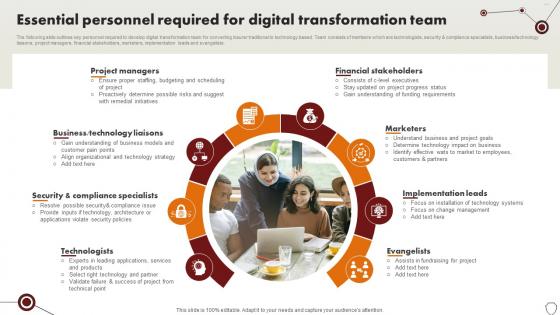
Technology Trends In Online Insurance Essential Personnel Required For Digital Transformation Team
The following slide outlines key personnel required to develop digital transformation team for converting insurer traditional to technology based. Team consists of members which are technologists, security and compliance specialists, business or technology liaisons, project managers, financial stakeholders, marketers, implementation leads and evangelists. The best PPT templates are a great way to save time, energy, and resources. Slidegeeks have 100 percent editable powerpoint slides making them incredibly versatile. With these quality presentation templates, you can create a captivating and memorable presentation by combining visually appealing slides and effectively communicating your message. Download Technology Trends In Online Insurance Essential Personnel Required For Digital Transformation Team from Slidegeeks and deliver a wonderful presentation. The following slide outlines key personnel required to develop digital transformation team for converting insurer traditional to technology based. Team consists of members which are technologists, security and compliance specialists, business or technology liaisons, project managers, financial stakeholders, marketers, implementation leads and evangelists.
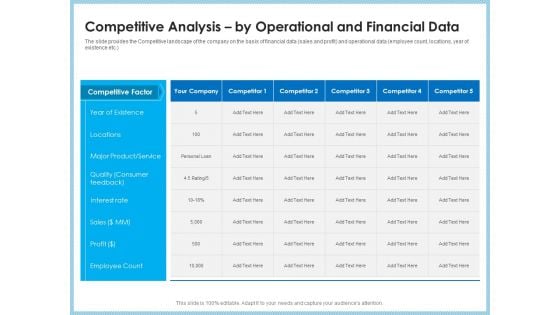
Investment Pitch To Generating Capital From Mezzanine Credit Competitive Analysis By Operational And Financial Data Inspiration PDF
The slide provides the Competitive landscape of the company on the basis of financial data sales and profit and operational data employee count, locations, year of existence etc. Deliver and pitch your topic in the best possible manner with this investment pitch to generating capital from mezzanine credit competitive analysis by operational and financial data inspiration pdf. Use them to share invaluable insights on competitive factor, year existence, locations, major product, service, quality consumer, interest rate and impress your audience. This template can be altered and modified as per your expectations. So, grab it now.
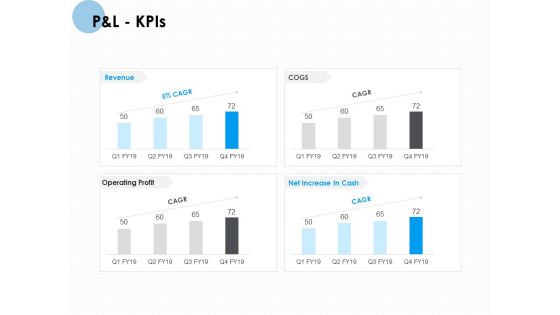
P And L Kpis Ppt PowerPoint Presentation Pictures Visual Aids
Presenting this set of slides with name p and l kpis ppt powerpoint presentation pictures visual aids. The topics discussed in these slides are net sales, total income, expenses, financing cost, profit before tax, profit after tax. This is a completely editable PowerPoint presentation and is available for immediate download. Download now and impress your audience.
3d Pie Chart PowerPoint Templates And PowerPoint Themes 1012
3d Pie Chart PowerPoint Templates And PowerPoint Themes 1012-Microsoft Powerpoint Templates and Background with pie chart -3d Pie Chart PowerPoint Templates And PowerPoint Themes 1012-This PowerPoint template can be used for presentations relating to-Pie chart, business, marketing, finance, success, money Report problems with our 3d Pie Chart PowerPoint Templates And PowerPoint Themes 1012. Download without worries with our money back guaranteee.
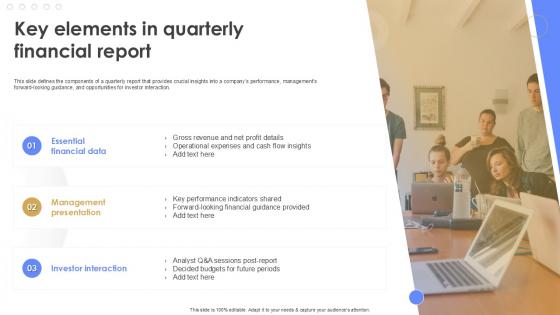
Key Elements In Quarterly Financial Report Quarterly Report Ppt Sample
This slide defines the components of a quarterly report that provides crucial insights into a companys performance, managements forward-looking guidance, and opportunities for investor interaction. Create an editable Key Elements In Quarterly Financial Report Quarterly Report Ppt Sample that communicates your idea and engages your audience. Whether you are presenting a business or an educational presentation, pre-designed presentation templates help save time. Key Elements In Quarterly Financial Report Quarterly Report Ppt Sample is highly customizable and very easy to edit, covering many different styles from creative to business presentations. Slidegeeks has creative team members who have crafted amazing templates. So, go and get them without any delay. This slide defines the components of a quarterly report that provides crucial insights into a companys performance, managements forward-looking guidance, and opportunities for investor interaction.
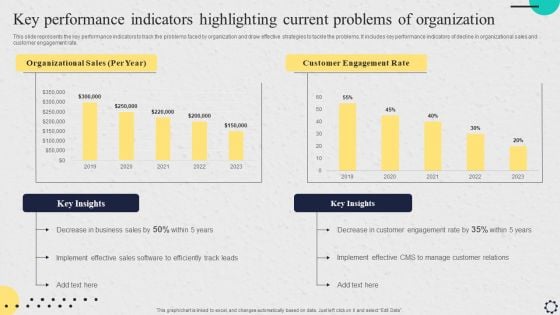
Software Implementation Strategy Key Performance Indicators Highlighting Current Problems Of Organization Professional PDF
This slide represents the key performance indicators to track the problems faced by organization and draw effective strategies to tackle the problems. It includes key performance indicators of decline in organizational sales and customer engagement rate. Make sure to capture your audiences attention in your business displays with our gratis customizable Software Implementation Strategy Key Performance Indicators Highlighting Current Problems Of Organization Professional PDF. These are great for business strategies, office conferences, capital raising or task suggestions. If you desire to acquire more customers for your tech business and ensure they stay satisfied, create your own sales presentation with these plain slides.
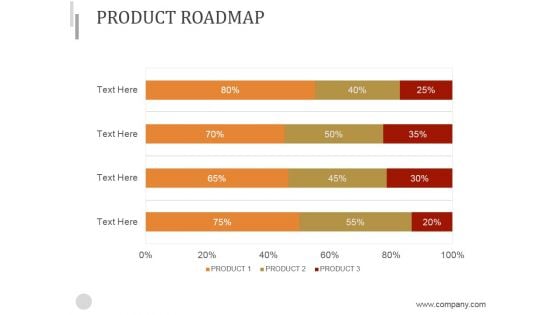
Product Roadmap Ppt PowerPoint Presentation Inspiration
This is a product roadmap ppt powerpoint presentation inspiration. This is a four stage process. The stages in this process are roadmap, finance, strategy, success, management.
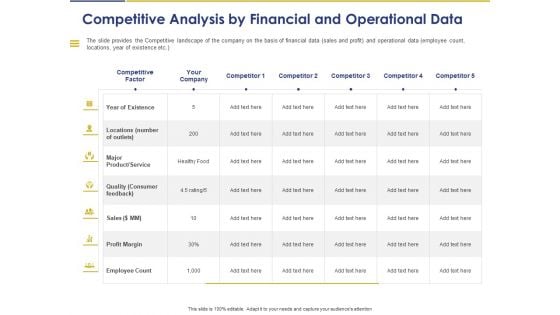
Convertible Note Pitch Deck Funding Strategy Competitive Analysis By Financial And Operational Data Ppt PowerPoint Presentation Styles Structure PDF
Presenting this set of slides with name convertible note pitch deck funding strategy competitive analysis by financial and operational data ppt powerpoint presentation styles structure pdf. The topics discussed in these slides are competitive factor, existence, locations, product service, quality consumer feedback, sales, profit marg, employee count. This is a completely editable PowerPoint presentation and is available for immediate download. Download now and impress your audience.
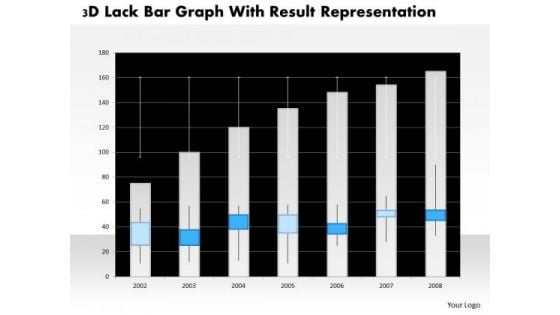
Business Diagram 3d Lack Bar Graph With Result Representation PowerPoint Slide
This business diagram has graphic of 3d lack bar graph. This diagram is a data visualization tool that gives you a simple way to present statistical information. This slide helps your audience examine and interpret the data you present.
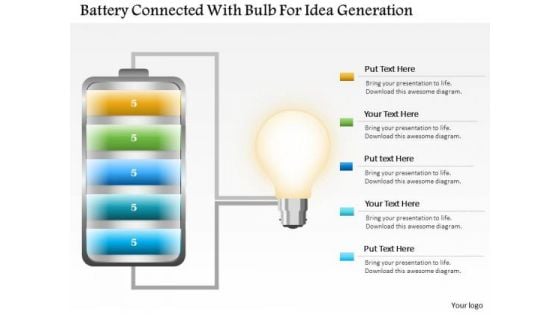
Business Diagram Battery Connected With Bulb For Idea Generation PowerPoint Slide
This business slide displays battery icon connected with bulb. This diagram is a data visualization tool that gives you a simple way to present statistical information. This slide helps your audience examine and interpret the data you present.
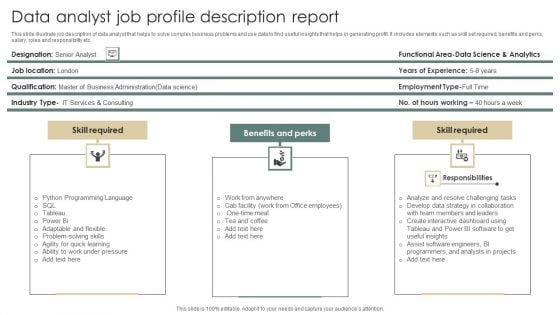
Data Analyst Job Profile Description Report Infographics PDF
This slide illustrate job description of data analyst that helps to solve complex business problems and use data to find useful insights that helps in generating profit. It includes elements such as skill set required, benefits and perks, salary, roles and responsibility etc. Presenting Data Analyst Job Profile Description Report Infographics PDF to dispense important information. This template comprises three stages. It also presents valuable insights into the topics including Skill Required, Benefits Perks, Skill Required. This is a completely customizable PowerPoint theme that can be put to use immediately. So, download it and address the topic impactfully.


 Continue with Email

 Home
Home


