Revenue Dashboard
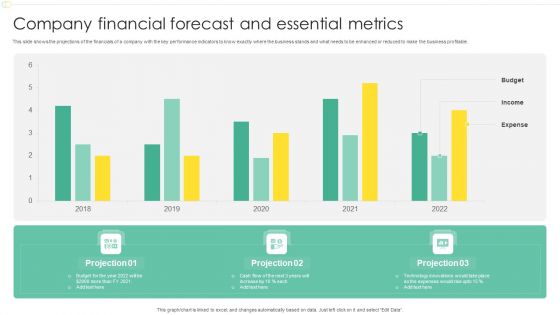
Company Financial Forecast And Essential Metrics Ppt Model Design Templates PDF
This slide shows the projections of the financials of a company with the key performance indicators to know exactly where the business stands and what needs to be enhanced or reduced to make the business profitable. Showcasing this set of slides titled Company Financial Forecast And Essential Metrics Ppt Model Design Templates PDF. The topics addressed in these templates are Budget, Income, Expense, 2018 To 2022. All the content presented in this PPT design is completely editable. Download it and make adjustments in color, background, font etc. as per your unique business setting.

Investor Report Finance PowerPoint Templates And PowerPoint Backgrounds 0711
Microsoft PowerPoint Template and Background with stock market charts for investor analysis Our Investor Report Finance PowerPoint Templates And PowerPoint Backgrounds 0711 can be aesthetically appealing. Expose your audience to the art of beauty.
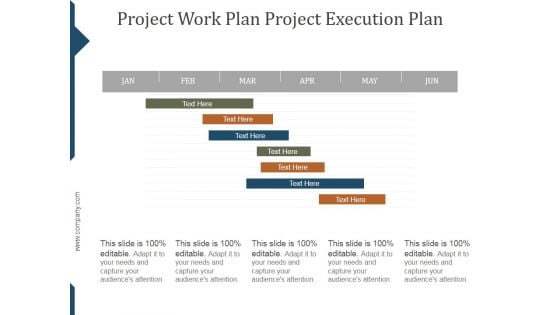
Project Work Plan Project Execution Plan Template Ppt PowerPoint Presentation Styles
This is a project work plan project execution plan template ppt powerpoint presentation styles. This is a seven stage process. The stages in this process are project, management, business, marketing, success.
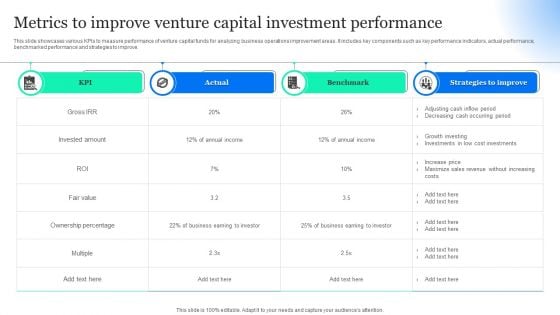
Metrics To Improve Venture Capital Investment Performance Information PDF
This slide showcases various KPIs to measure performance of venture capital funds for analyzing business operations improvement areas. It includes key components such as key performance indicators, actual performance, benchmarked performance and strategies to improve. Pitch your topic with ease and precision using this Metrics To Improve Venture Capital Investment Performance Information PDF. This layout presents information on Actual, Strategies Improve, Benchmark. It is also available for immediate download and adjustment. So, changes can be made in the color, design, graphics or any other component to create a unique layout.
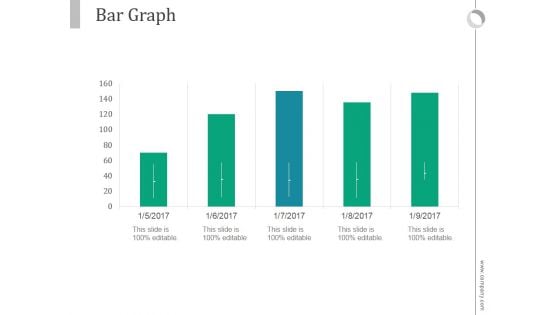
Bar Graph Ppt PowerPoint Presentation Model
This is a bar graph ppt powerpoint presentation model. This is a five stage process. The stages in this process are business, marketing, bar slides, management, finance.
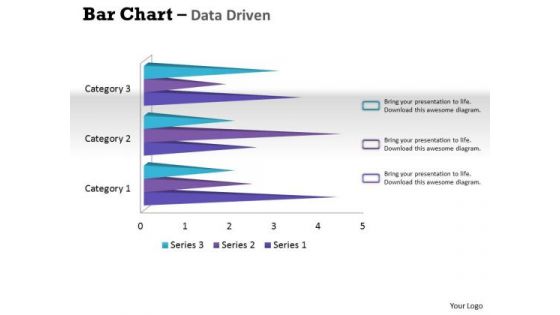
Data Analysis Techniques 3d Bar Chart For Financial Solutions PowerPoint Templates
Make Your Dreams A Reality With Our data analysis techniques 3d bar chart for financial solutions Powerpoint Templates . Your Ideas Will Begin To Take Shape.
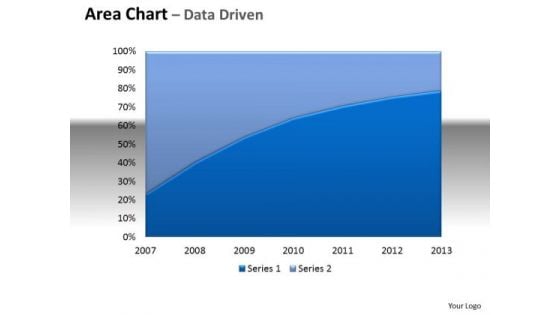
Financial Data Analysis Area Chart With Plotted Line Center PowerPoint Templates
Be The Doer With Our financial data analysis area chart with plotted line center Powerpoint Templates . Put Your Thoughts Into Practice.
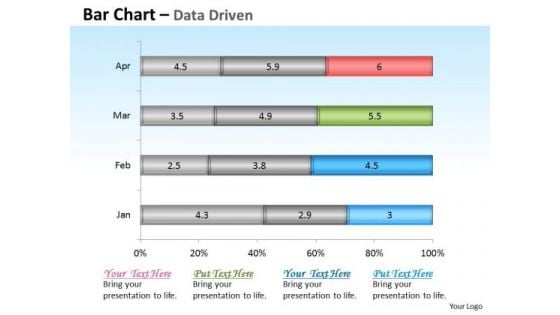
Financial Data Analysis Driven Base Bar Chart Design PowerPoint Slides Templates
Get The Domestics Right With Our financial data analysis driven base bar chart design powerpoint slides Templates . Create The Base For Thoughts To Grow.
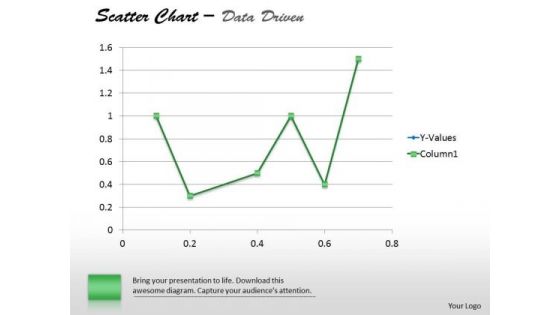
Financial Data Analysis Driven Demonstrate Statistics With Scatter Chart PowerPoint Slides Templates
Establish The Dominance Of Your Ideas. Our financial data analysis driven demonstrate statistics with scatter chart powerpoint slides Templates Will Put Them On Top.
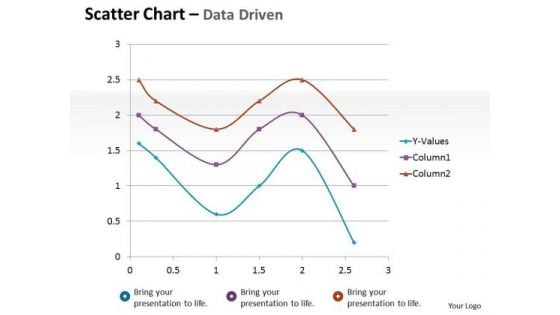
Financial Data Analysis Driven Scatter Chart Mathematical Diagram PowerPoint Slides Templates
Dominate Proceedings With Your Ideas. Our financial data analysis driven scatter chart mathematical diagram powerpoint slides Templates Will Empower Your Thoughts.
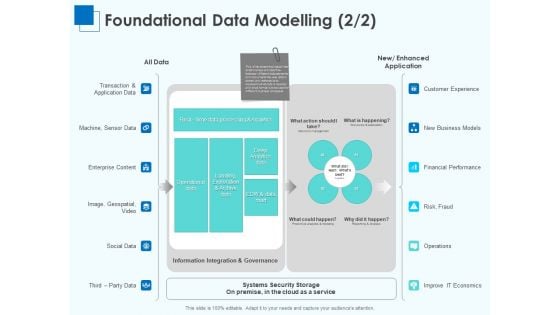
Corporate Intelligence Business Analysis Foundational Data Modelling Risk Ppt Infographics Vector PDF
Deliver an awe-inspiring pitch with this creative corporate intelligence business analysis foundational data modelling risk ppt infographics vector pdf bundle. Topics like sources systems, data cubes, financial and reporting can be discussed with this completely editable template. It is available for immediate download depending on the needs and requirements of the user.
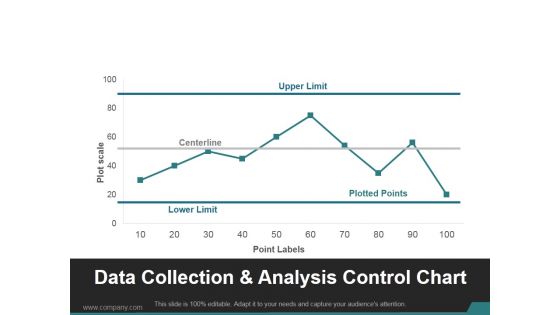
Data Collection And Analysis Control Chart Ppt PowerPoint Presentation Visuals
This is a data collection and analysis control chart ppt powerpoint presentation visuals. This is a ten stage process. The stages in this process are upper limit, centerline, lower limit, plotted points.
Pandl Kpis Tabular Form Ppt PowerPoint Presentation Icon
This is a pandl kpis tabular form ppt powerpoint presentation icon. This is a four stage process. The stages in this process are business, net sales, total income, expenses, profit before tax, profit after tax.
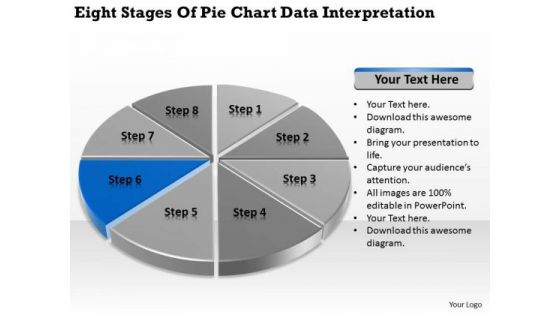
Stages Of Pie Chart Data Interpretation Example Business Plan PowerPoint Slides
We present our stages of pie chart data interpretation example business plan PowerPoint Slides.Download and present our Circle Charts PowerPoint Templates because It will let you Set new benchmarks with our PowerPoint Templates and Slides. They will keep your prospects well above par. Download our Marketing PowerPoint Templates because Our PowerPoint Templates and Slides will weave a web of your great ideas. They are gauranteed to attract even the most critical of your colleagues. Use our Business PowerPoint Templates because It will Strengthen your hand with your thoughts. They have all the aces you need to win the day. Present our Shapes PowerPoint Templates because It will get your audience in sync. Present our Process and Flows PowerPoint Templates because Our PowerPoint Templates and Slides will generate and maintain the level of interest you desire. They will create the impression you want to imprint on your audience.Use these PowerPoint slides for presentations relating to achievement, analysis, background, bank, banking, business, calculation, chart, circle, commerce, commercial, commission, concept, credit, crisis, debt, deposit, design, detail, diagram, earnings, economics, economy, element, finance, goal, gold, golden, graph, graphic, growth, icon, idea, illustration, income, increase, invest, isolated, level, loss, market, marketing, metal, modern, money, new, object, part, percent, percentage, pie, plot, politics, profit, progress, ratio, reflection, reflective. The prominent colors used in the PowerPoint template are Blue navy, Gray, Black. Add emphasis to your ideas with our Stages Of Pie Chart Data Interpretation Example Business Plan PowerPoint Slides. Lend greater credence to your expression.
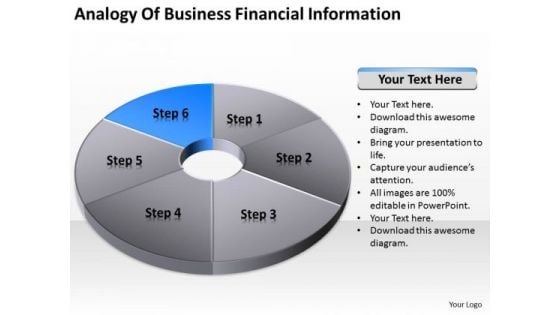
Pie Donut Diagram 6 Stages Ppt Free Downloadable Business Plan Template PowerPoint Templates
We present our pie donut diagram 6 stages ppt free downloadable business plan template PowerPoint templates.Present our Finance PowerPoint Templates because Our PowerPoint Templates and Slides are a sure bet. Gauranteed to win against all odds. Use our Marketing PowerPoint Templates because They will Put the wind in your sails. Skim smoothly over the choppy waters of the market. Present our Money PowerPoint Templates because Our PowerPoint Templates and Slides are conceived by a dedicated team. Use them and give form to your wondrous ideas. Download our Success PowerPoint Templates because Our PowerPoint Templates and Slides are designed to help you succeed. They have all the ingredients you need. Download our Business PowerPoint Templates because It will Give impetus to the hopes of your colleagues. Our PowerPoint Templates and Slides will aid you in winning their trust.Use these PowerPoint slides for presentations relating to Pie, Chart, Market, Statistics, Sales, Slice, Economy, Display, Corporate, Business, Concept, Render, Success, Presentation, Diagram, Percentage, Graphic, Finance, Data, Bank, Report, Marketing, Accounting, Management, Graph, Illustration, Icon, Piece, Strategy, Money, Growth, Company, Control, Competition, Progress, Account, Sheet, Profit, Part, Information, Investment, Improvement, Banking, Index, Financial. The prominent colors used in the PowerPoint template are Blue, Gray, White. With our Pie Donut Diagram 6 Stages Ppt Free Downloadable Business Plan Template PowerPoint Templates the goal is never far away. Your thoughts will always dribble through.
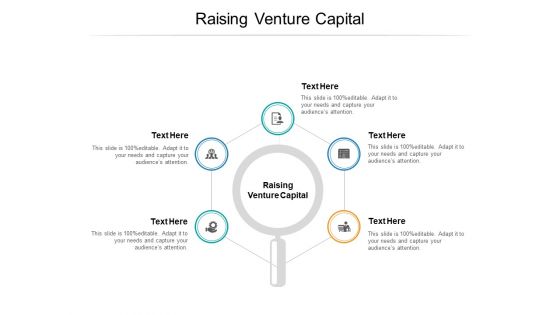
Raising Venture Capital Ppt PowerPoint Presentation Slides Show Cpb
Presenting this set of slides with name raising venture capital ppt powerpoint presentation slides show cpb. This is an editable Powerpoint five stages graphic that deals with topics like raising venture capital to help convey your message better graphically. This product is a premium product available for immediate download and is 100 percent editable in Powerpoint. Download this now and use it in your presentations to impress your audience.
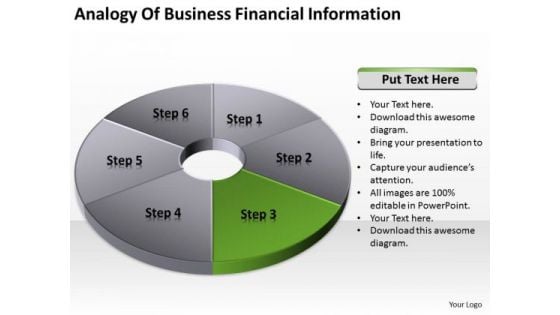
Pie Donut Diagram 6 Stages Professional Business Plan Template PowerPoint Templates
We present our pie donut diagram 6 stages professional business plan template PowerPoint templates.Use our Finance PowerPoint Templates because Our PowerPoint Templates and Slides come in all colours, shades and hues. They help highlight every nuance of your views. Present our Marketing PowerPoint Templates because Our PowerPoint Templates and Slides are effectively colour coded to prioritise your plans They automatically highlight the sequence of events you desire. Download and present our Money PowerPoint Templates because It can be used to Set your controls for the heart of the sun. Our PowerPoint Templates and Slides will be the propellant to get you there. Download and present our Success PowerPoint Templates because Our PowerPoint Templates and Slides will let your words and thoughts hit bullseye everytime. Download and present our Business PowerPoint Templates because Our PowerPoint Templates and Slides are conceived by a dedicated team. Use them and give form to your wondrous ideas.Use these PowerPoint slides for presentations relating to Pie, Chart, Market, Statistics, Sales, Slice, Economy, Display, Corporate, Business, Concept, Render, Success, Presentation, Diagram, Percentage, Graphic, Finance, Data, Bank, Report, Marketing, Accounting, Management, Graph, Illustration, Icon, Piece, Strategy, Money, Growth, Company, Control, Competition, Progress, Account, Sheet, Profit, Part, Information, Investment, Improvement, Banking, Index, Financial. The prominent colors used in the PowerPoint template are Green, Gray, White. You will find our Pie Donut Diagram 6 Stages Professional Business Plan Template PowerPoint Templates fighting fit. They will give you able-bodied assistance.
Startup Presentation For Collaborative Capital Funding Magnifying Glass Introduction PDF
Presenting this set of slides with name startup presentation for collaborative capital funding magnifying glass introduction pdf. This is a two stage process. The stages in this process are magnifying glass. This is a completely editable PowerPoint presentation and is available for immediate download. Download now and impress your audience.
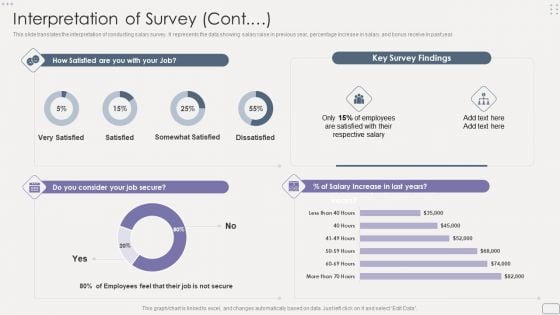
Income Assessment Report Interpretation Of Survey Contd Portrait PDF
This slide translates the interpretation of conducting salary survey. It represents the data showing salary raise in previous year, percentage increase in salary, and bonus receive in past year.Deliver and pitch your topic in the best possible manner with this Income Assessment Report Interpretation Of Survey Contd Portrait PDF. Use them to share invaluable insights on Increment Criteria, Projected Increment, Middle Management and impress your audience. This template can be altered and modified as per your expectations. So, grab it now.
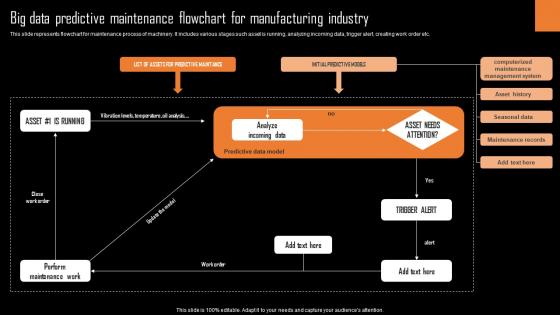
Big Data Predictive Maintenance Flowchart For Manufacturing Industry Information Pdf
This slide represents flowchart for maintenance process of machinery. It includes various stages such asset is running, analyzing incoming data, trigger alert, creating work order etc.Pitch your topic with ease and precision using this Big Data Predictive Maintenance Flowchart For Manufacturing Industry Information Pdf This layout presents information on Maintenance Records, Seasonal Data, Asset History It is also available for immediate download and adjustment. So, changes can be made in the color, design, graphics or any other component to create a unique layout. This slide represents flowchart for maintenance process of machinery. It includes various stages such asset is running, analyzing incoming data, trigger alert, creating work order etc.
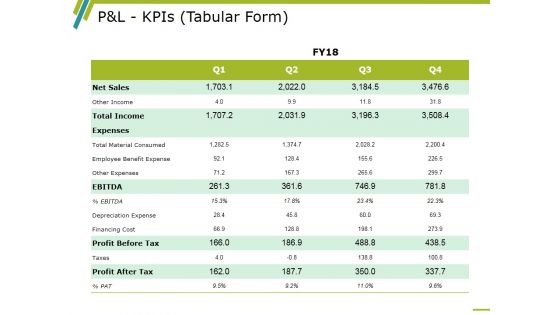
P And L Kpis Template 1 Ppt PowerPoint Presentation Infographics Professional
This is a p and l kpis template 1 ppt powerpoint presentation infographics professional. This is a four stage process. The stages in this process are Other Income, Total Income, Ebitda, Profit Before Tax, Profit After Tax.
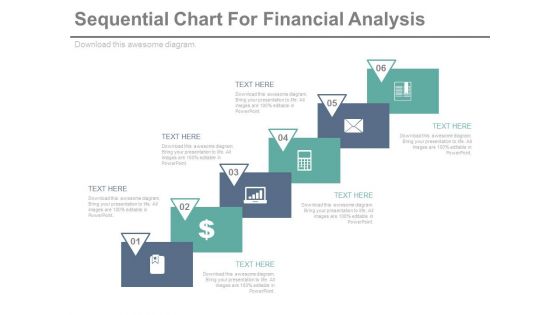
Sequential Steps Chart For Data Analysis Powerpoint Slides
This PowerPoint template has been designed sequential steps chart with icons. This PPT slide can be used to display corporate level financial strategy. You can download finance PowerPoint template to prepare awesome presentations.
Financial Charts Data Analysis Vector Icon Ppt PowerPoint Presentation Visual Aids Summary Cpb
This is a financial charts data analysis vector icon ppt powerpoint presentation visual aids summary cpb. This is a three stage process. The stages in this process are data analysis, analytics architecture, analytics framework.
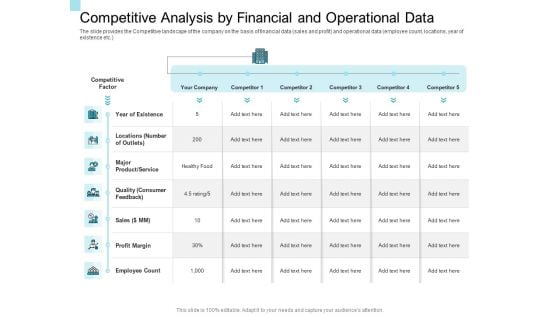
Convertible Market Notes Competitive Analysis By Financial And Operational Data Ppt Ideas Examples PDF
Deliver an awe inspiring pitch with this creative convertible market notes competitive analysis by financial and operational data ppt ideas examples pdf bundle. Topics like sales, profit margin, competitor, competitive can be discussed with this completely editable template. It is available for immediate download depending on the needs and requirements of the user.
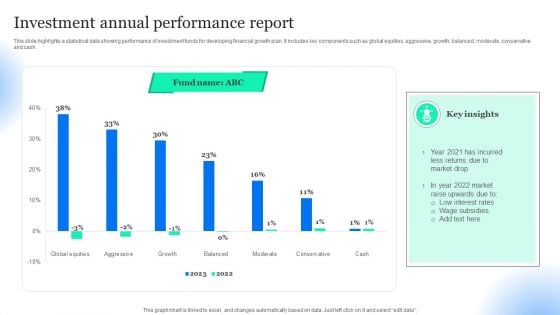
Investment Annual Performance Report Pictures PDF
This slide highlights a statistical data showing performance of investment funds for developing financial growth plan. It includes key components such as global equities, aggressive, growth, balanced, moderate, conservative and cash. Pitch your topic with ease and precision using this Investment Annual Performance Report Pictures PDF. This layout presents information on Low Interest Rates, Wage Subsidies, Returns Due Market Drop. It is also available for immediate download and adjustment. So, changes can be made in the color, design, graphics or any other component to create a unique layout.
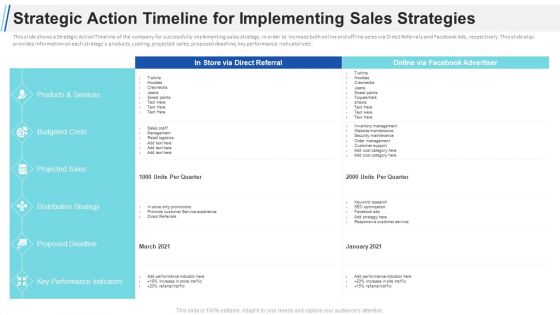
Maximizing Profitability Earning Through Sales Initiatives Strategic Action Timeline For Implementing Sales Strategies Formats PDF
This slide shows a Strategic Action Timeline of the company for successfully implementing sales strategy, in order to increase both online and offline sales via Direct Referrals and Facebook Ads, respectively. This slide also provides information on each strategys products, costing, projected sales, proposed deadline, key performance indicators etc. Deliver an awe inspiring pitch with this creative maximizing profitability earning through sales initiatives strategic action timeline for implementing sales strategies formats pdf bundle. Topics like products services, budgeted costs, projected sales, performance indicators can be discussed with this completely editable template. It is available for immediate download depending on the needs and requirements of the user.
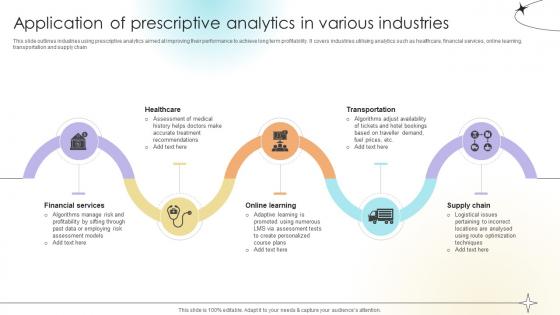
Application Of Prescriptive Analytics In Various Industries Data Analytics SS V
This slide outlines industries using prescriptive analytics aimed at improving their performance to achieve long term profitability. It covers industries utilising analytics such as healthcare, financial services, online learning, transportation and supply chain.Do you have to make sure that everyone on your team knows about any specific topic I yes, then you should give Application Of Prescriptive Analytics In Various Industries Data Analytics SS V a try. Our experts have put a lot of knowledge and effort into creating this impeccable Application Of Prescriptive Analytics In Various Industries Data Analytics SS V. You can use this template for your upcoming presentations, as the slides are perfect to represent even the tiniest detail. You can download these templates from the Slidegeeks website and these are easy to edit. So grab these today This slide outlines industries using prescriptive analytics aimed at improving their performance to achieve long term profitability. It covers industries utilising analytics such as healthcare, financial services, online learning, transportation and supply chain.
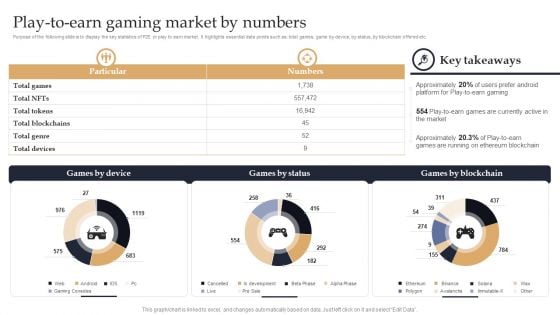
Web 3 0 Blockchain Based P2E Mobile Game Sector Report Promotional Plan Play To Earn Gaming Market By Numbers Summary PDF
Purpose of the following slide is to display the key statistics of P2E or play to earn market. It highlights essential data points such as total games, game by device, by status, by blockchain offered etc. Coming up with a presentation necessitates that the majority of the effort goes into the content and the message you intend to convey. The visuals of a PowerPoint presentation can only be effective if it supplements and supports the story that is being told. Keeping this in mind our experts created Web 3 0 Blockchain Based P2E Mobile Game Sector Report Promotional Plan Play To Earn Gaming Market By Numbers Summary PDF to reduce the time that goes into designing the presentation. This way, you can concentrate on the message while our designers take care of providing you with the right template for the situation.
Icon Showing Market Research Of Financial Information Template PDF
Persuade your audience using this Icon Showing Market Research Of Financial Information Template PDF This PPT design covers three stages, thus making it a great tool to use. It also caters to a variety of topics including Icon Showing, Market Research, Financial Information Download this PPT design now to present a convincing pitch that not only emphasizes the topic but also showcases your presentation skills.
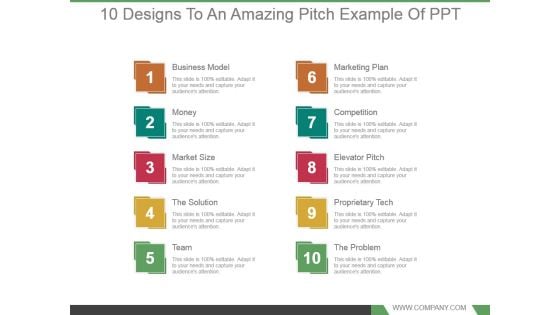
10 Designs To An Amazing Pitch Example Of Ppt
This is a 10 designs to an amazing pitch example of ppt. This is a ten stage process. The stages in this process are business model, money, market size, the solution, team, marketing plan, competition, elevator pitch, proprietary tech, the problem.
Bar Graph Icon For Research Analysis Ppt PowerPoint Presentation Summary Portfolio
Presenting this set of slides with name bar graph icon for research analysis ppt powerpoint presentation summary portfolio. This is a three stage process. The stages in this process are data visualization icon, research analysis, business focus. This is a completely editable PowerPoint presentation and is available for immediate download. Download now and impress your audience.
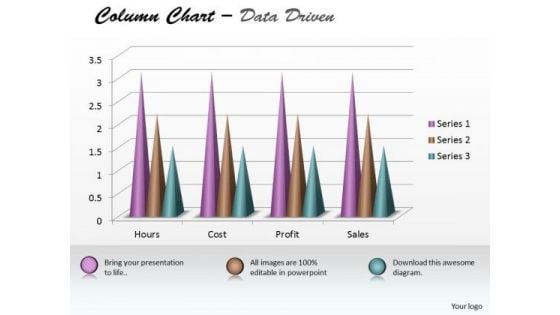
Excel Data Analysis Data Tools Data Methods Statistical Tool Survey Chart PowerPoint Templates
Analyze Ailments On Our excel data analysis data tools data methods statistical tool survey chart Powerpoint Templates . Bring Out The Thinking Doctor In You. Dock Your Thoughts With Our Excel Data Analysis . They Will Launch Them Into Orbit.
Bar Graph Icon For Data Analysis Ppt PowerPoint Presentation Pictures Ideas
This is a bar graph icon for data analysis ppt powerpoint presentation pictures ideas. This is a four stage process. The stages in this process are financial analysis, quantitative, statistical modelling.
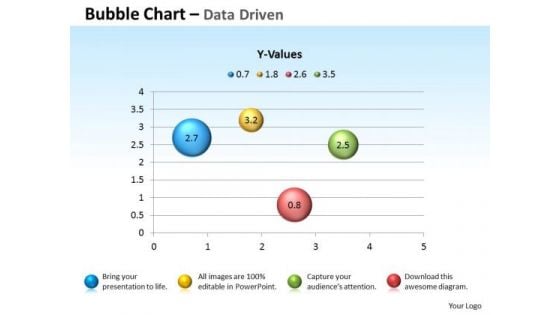
Excel Data Analysis Data Tools Data Methods Statistical Chart For Process PowerPoint Templates
Blend Your Views With Our excel data analysis data tools data methods statistical chart for process Powerpoint Templates . They Are Made For Each Other.
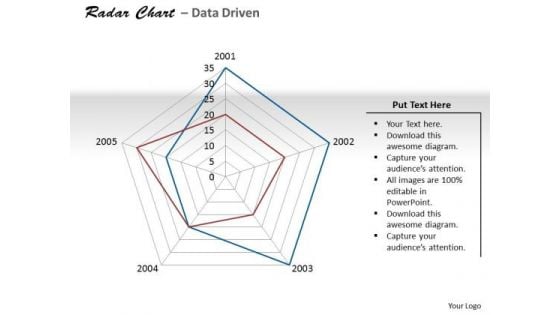
Excel Data Analysis Data Tools Data Methods Statistical Driven PowerPoint Slides Templates
There Is No Subject Too Dull For Our excel data analysis data tools data methods statistical driven powerpoint slides Templates . They Will Always Generate Keenness.
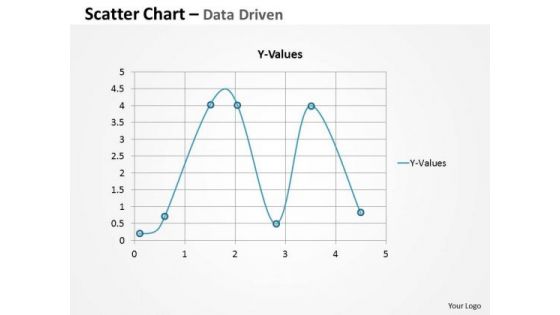
Excel Data Analysis Data Tools Data Methods Statistical Survey Driven PowerPoint Slides Templates
Ask For Assistance From Our excel data analysis data tools data methods statistical survey driven powerpoint slides Templates . You Will Be Duly Satisfied.
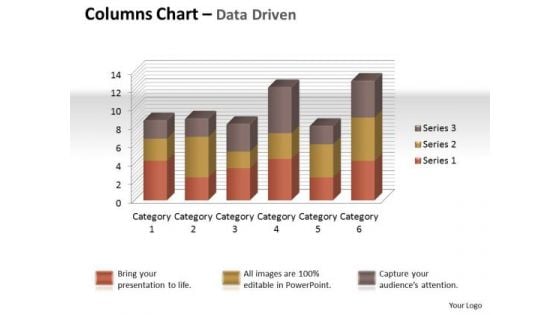
Excel Data Analysis Data Tools Data Methods Statistical Tool Chart PowerPoint Templates
Give Your Thoughts Some Durability. Coat Them With Our excel data analysis data tools data methods statistical tool chart Powerpoint Templates .
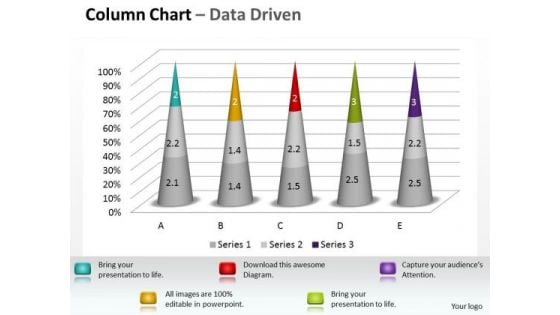
Excel Data Analysis Data Tools Data Methods Statistical Tool Survey 3d Chart PowerPoint Templates
Dumbfound Them With Our excel data analysis data tools data methods statistical tool survey 3d chart Powerpoint Templates . Your Audience Will Be Astounded With Your Ideas.
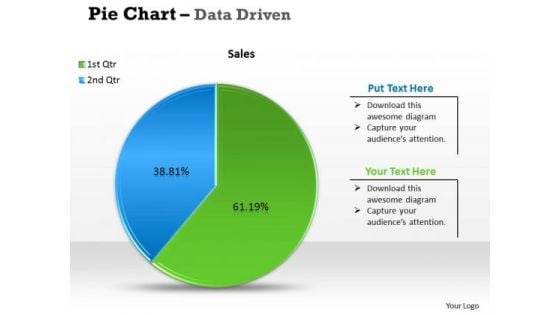
Excel Data Analysis Data Tools Data Methods Statistical Tool Survey PowerPoint Slides Templates
Get Out Of The Dock With Our excel data analysis data tools data methods statistical tool survey powerpoint slides Templates . Your Mind Will Be Set Free.
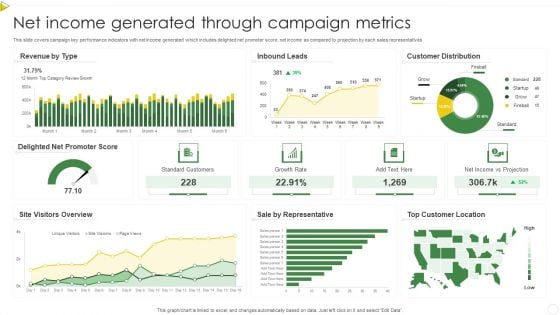
Net Income Generated Through Campaign Metrics Summary PDF
This slide covers campaign key performance indicators with net income generated which includes delighted net promoter score, net income as compared to projection by each sales representatives. Pitch your topic with ease and precision using this Net Income Generated Through Campaign Metrics Summary PDF. This layout presents information on Standard Customers, Growth Rate, Net Income. It is also available for immediate download and adjustment. So, changes can be made in the color, design, graphics or any other component to create a unique layout.
Financial Data And Analytics Expansion Icon Mockup PDF
Persuade your audience using this Financial Data And Analytics Expansion Icon Mockup PDF. This PPT design covers three stages, thus making it a great tool to use. It also caters to a variety of topics including Financial Data, Analytics, Expansion Icon. Download this PPT design now to present a convincing pitch that not only emphasizes the topic but also showcases your presentation skills.
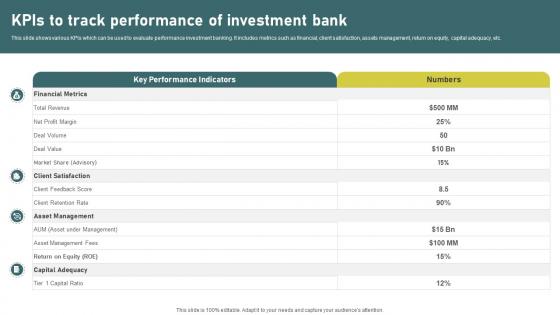
KPIs To Track Performance Of Investment Banking Simplified Functions Fin SS V
This slide shows various KPIs which can be used to evaluate performance investment banking. It includes metrics such as financial, client satisfaction, assets management, return on equity, capital adequacy, etc. Here you can discover an assortment of the finest PowerPoint and Google Slides templates. With these templates, you can create presentations for a variety of purposes while simultaneously providing your audience with an eye-catching visual experience. Download KPIs To Track Performance Of Investment Banking Simplified Functions Fin SS V to deliver an impeccable presentation. These templates will make your job of preparing presentations much quicker, yet still, maintain a high level of quality. Slidegeeks has experienced researchers who prepare these templates and write high-quality content for you. Later on, you can personalize the content by editing the NNNNNNNNNNNNNNNNNNNNNNNNNNNNNN. This slide shows various KPIs which can be used to evaluate performance investment banking. It includes metrics such as financial, client satisfaction, assets management, return on equity, capital adequacy, etc.
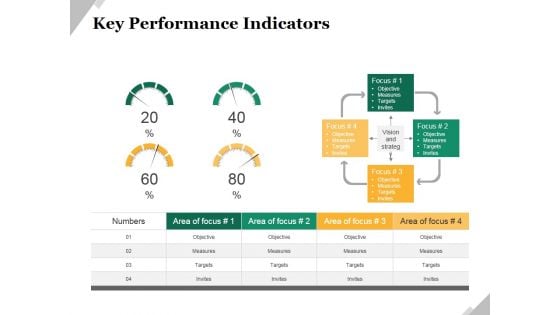
Key Performance Indicators Template 2 Ppt PowerPoint Presentation Model Example
This is a key performance indicators template 2 ppt powerpoint presentation model example. This is a four stage process. The stages in this process are objective, measures, targets, invites, indicators.
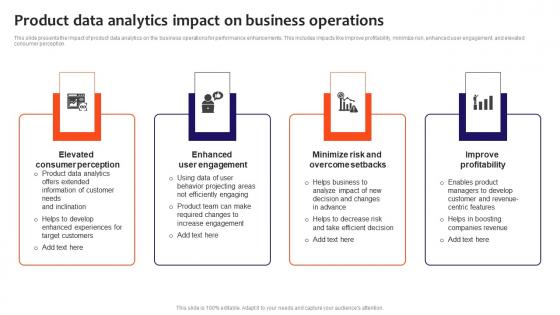
Product Data Analytics Impact On Business Operations Elements Pdf
This slide presents the impact of product data analytics on the business operations for performance enhancements. This includes impacts like improve profitability, minimize risk, enhanced user engagement, and elevated consumer perception. Pitch your topic with ease and precision using this Product Data Analytics Impact On Business Operations Elements Pdf. This layout presents information on Elevated Consumer Perception, Enhanced User Engagement, Improve Profitability. It is also available for immediate download and adjustment. So, changes can be made in the color, design, graphics or any other component to create a unique layout. This slide presents the impact of product data analytics on the business operations for performance enhancements. This includes impacts like improve profitability, minimize risk, enhanced user engagement, and elevated consumer perception.
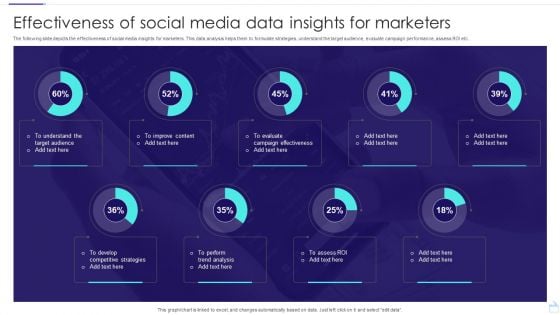
Effectiveness Of Social Media Data Insights For Marketers Ideas PDF
The following slide depicts the effectiveness of social media insights for marketers. This data analysis helps them to formulate strategies, understand the target audience, evaluate campaign performance, assess ROI etc. Showcasing this set of slides titled Effectiveness Of Social Media Data Insights For Marketers Ideas PDF. The topics addressed in these templates are Effectiveness, Social Media, Marketers. All the content presented in this PPT design is completely editable. Download it and make adjustments in color, background, font etc. as per your unique business setting.
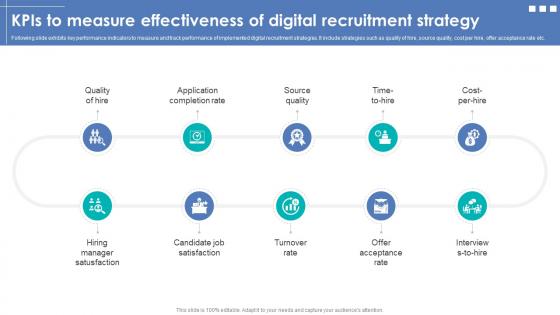
Integrating Automation For Effective Business Kpis To Measure Effectiveness Of Digital Recruitment
Following slide exhibits key performance indicators to measure and track performance of implemented digital recruitment strategies. It include strategies such as quality of hire, source quality, cost per hire, offer acceptance rate etc. Make sure to capture your audiences attention in your business displays with our gratis customizable Integrating Automation For Effective Business Kpis To Measure Effectiveness Of Digital Recruitment. These are great for business strategies, office conferences, capital raising or task suggestions. If you desire to acquire more customers for your tech business and ensure they stay satisfied, create your own sales presentation with these plain slides. Following slide exhibits key performance indicators to measure and track performance of implemented digital recruitment strategies. It include strategies such as quality of hire, source quality, cost per hire, offer acceptance rate etc.
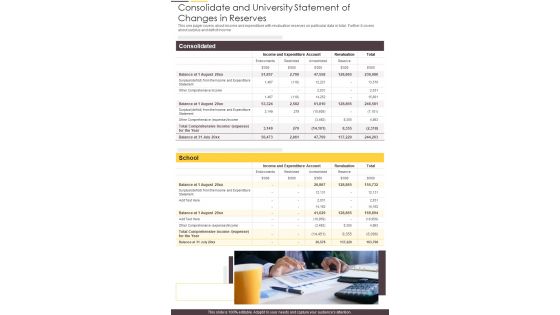
Consolidate And University Statement Of Changes In Reserves One Pager Documents
This one pager covers about income and expenditure with revaluation reserves on particular data in total. Further it covers about surplus and deficit income. Presenting you an exemplary Consolidate And University Statement Of Changes In Reserves One Pager Documents. Our one-pager comprises all the must-have essentials of an inclusive document. You can edit it with ease, as its layout is completely editable. With such freedom, you can tweak its design and other elements to your requirements. Download this Consolidate And University Statement Of Changes In Reserves One Pager Documents brilliant piece now.
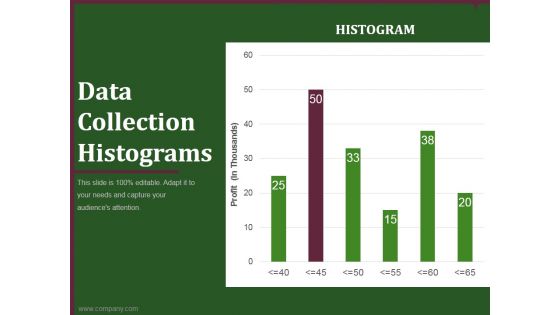
data collection histograms ppt powerpoint presentation example
This is a data collection histograms ppt powerpoint presentation example. This is a six stage process. The stages in this process are business, planning, marketing, histograms, graph.
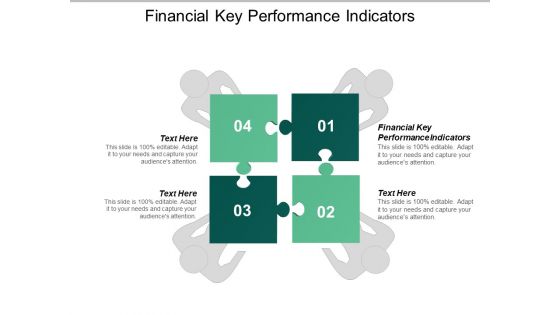
Financial Key Performance Indicators Ppt PowerPoint Presentation Ideas Aids Cpb
This is a financial key performance indicators ppt powerpoint presentation ideas aids cpb. This is a four stage process. The stages in this process are financial key performance indicators.

Key Performance Indicators Template 2 Ppt PowerPoint Presentation Layouts Portfolio
This is a key performance indicators template 2 ppt powerpoint presentation layouts portfolio. This is a four stage process. The stages in this process are objective, measures, targets, invites.

American Dollar Cash Business PowerPoint Templates And PowerPoint Themes 1012
Heighten the anticipation of your audience with this slide listing American dollar. This image signifies the concept of money, foreign currency. This image has been conceived to enable you to emphatically communicate your ideas in your Financial PPT presentations on American financial system, investment, stock market investment, international transactions etc. Add personality to your presentations with our stunning template. Examine data with our American Dollar Cash Business PowerPoint Templates And PowerPoint Themes 1012. You will come out on top.
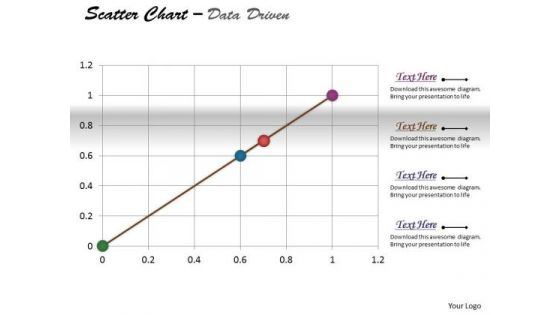
Excel Data Analysis Data Methods Statistical Tool Survey Driven PowerPoint Slides Templates
Be The Duke Of The Dais With Our excel data analysis data methods statistical tool survey driven powerpoint slides Templates . Acquire Royalty Status With Your Thoughts.
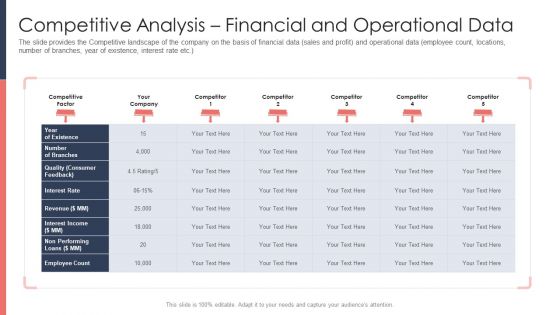
Pitch Deck For Fundraising From Post Market Financing Competitive Analysis Financial And Operational Data Themes PDF
The slide provides the Competitive landscape of the company on the basis of financial data sales and profit and operational data employee count, locations, number of branches, year of existence, interest rate etc.Deliver and pitch your topic in the best possible manner with this pitch deck for fundraising from post market financing competitive analysis financial and operational data themes pdf. Use them to share invaluable insights on quality consumer feedback, interest rate, employee count and impress your audience. This template can be altered and modified as per your expectations. So, grab it now.
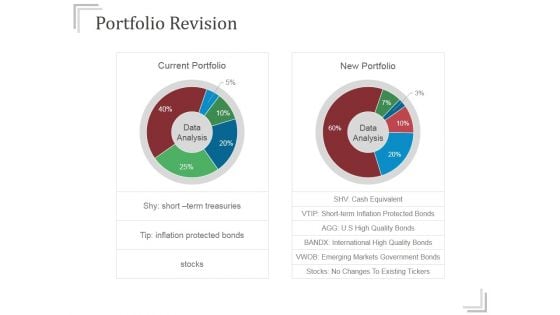
Portfolio Revision Ppt PowerPoint Presentation Slide
This is a portfolio revision ppt powerpoint presentation slide. This is a two stage process. The stages in this process are current portfolio, new portfolio, data analysis.
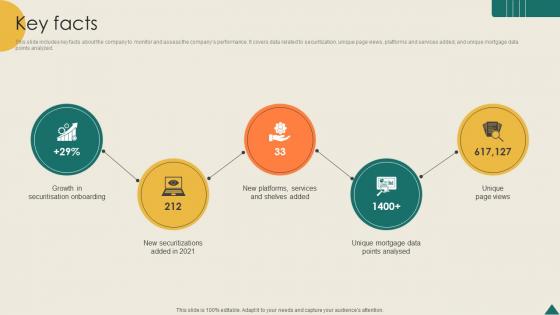
Key Facts Financial Analytics Platform Investor Elevator Pitch Deck
This slide includes key facts about the company to monitor and assess the companys performance. It covers data related to securitization, unique page views, platforms and services added, and unique mortgage data points analyzed. There are so many reasons you need a Key Facts Financial Analytics Platform Investor Elevator Pitch Deck. The first reason is you can not spend time making everything from scratch, Thus, Slidegeeks has made presentation templates for you too. You can easily download these templates from our website easily. This slide includes key facts about the company to monitor and assess the companys performance. It covers data related to securitization, unique page views, platforms and services added, and unique mortgage data points analyzed.

Deck Presentation Solutions for Enhanced Data Reach and Visibility PPT Sample

Stock Photo Golden Dollar Symbol With Pie Graph PowerPoint Slide
This Power Point template has been crafted with graphic of golden dollar symbol and pie chart on a tablet. Display the concept of financial data analysis with this image. Use this image to present financial reports in business presentations.
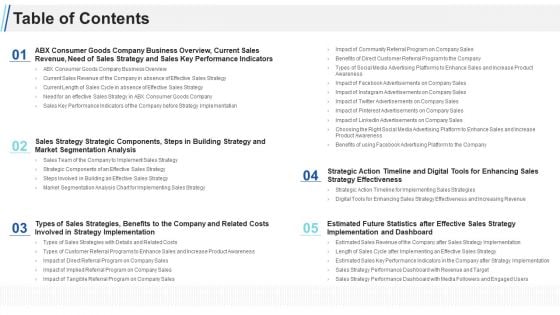
Maximizing Profitability Earning Through Sales Initiatives Table Of Contents Ppt Visual Aids Outline PDF
Deliver an awe inspiring pitch with this creative maximizing profitability earning through sales initiatives table of contents ppt visual aids outline pdf bundle. Topics like strategy implementation, market segmentation analysis, sales key performance indicators, types of sales strategies with details and related costs, business overview can be discussed with this completely editable template. It is available for immediate download depending on the needs and requirements of the user.
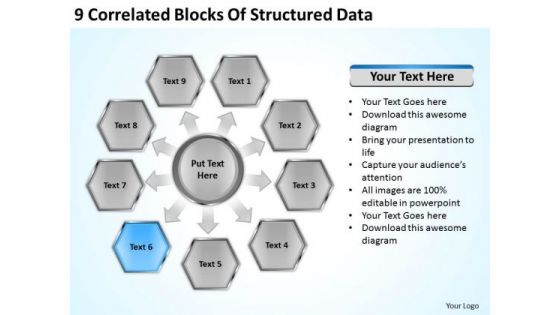
9 Correlated Blocks Of Structured Data Download Business Plans PowerPoint Templates
We present our 9 correlated blocks of structured data download business plans PowerPoint templates.Download our Marketing PowerPoint Templates because Our PowerPoint Templates and Slides are conceived by a dedicated team. Use them and give form to your wondrous ideas. Download our Business PowerPoint Templates because It can Bubble and burst with your ideas. Present our Finance PowerPoint Templates because Our PowerPoint Templates and Slides will let you Hit the right notes. Watch your audience start singing to your tune. Present our Process and Flows PowerPoint Templates because Our PowerPoint Templates and Slides will give good value for money. They also have respect for the value of your time. Download our Arrows PowerPoint Templates because It will let you Set new benchmarks with our PowerPoint Templates and Slides. They will keep your prospects well above par.Use these PowerPoint slides for presentations relating to Diagram, Chart, Business, Background, Vector, Pie, Brown, Abstract, Wheel, Options, Board, Website, Cross, Statistics, Model, Item, Document, Media, Beehives, Red, Hive, Concept, Presentation, Template, Matt, Brochure, Orange, Guide, Description, Multicolor, Marketing, Gray, Development, Title, Management, Honeycomb, Illustration, Six, Catalog, Direction, Plans, Blue, Text, Reports, Financial, Workplace, Navigation, Parts. The prominent colors used in the PowerPoint template are Blue, Gray, Black. Decrease wastage with our 9 Correlated Blocks Of Structured Data Download Business Plans PowerPoint Templates. Download without worries with our money back guaranteee.
Financial Key Performance Indicators Table Powerpoint Slide Deck
This is a financial key performance indicators table powerpoint slide deck. This is a six stage process. The stages in this process are business, strategy, marketing, success, table.


 Continue with Email

 Home
Home


