Snapshot
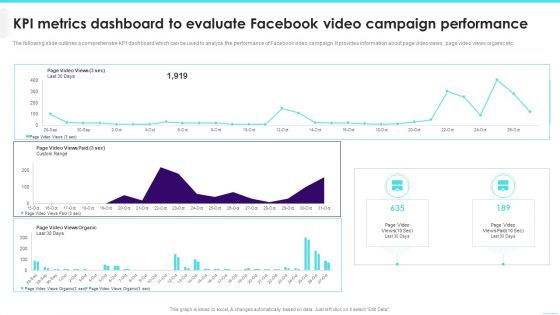
KPI Metrics Dashboard To Evaluate Facebook Video Campaign Performance Elements PDF
The following slide outlines a comprehensive KPI dashboard which can be used to analyze the performance of Facebook video campaign. It provides information about page video views, page video views organic etc.Deliver and pitch your topic in the best possible manner with this KPI Metrics Dashboard To Evaluate Facebook Video Campaign Performance Elements PDF. Use them to share invaluable insights on Custom Range, Page Video, Views Paid and impress your audience. This template can be altered and modified as per your expectations. So, grab it now.
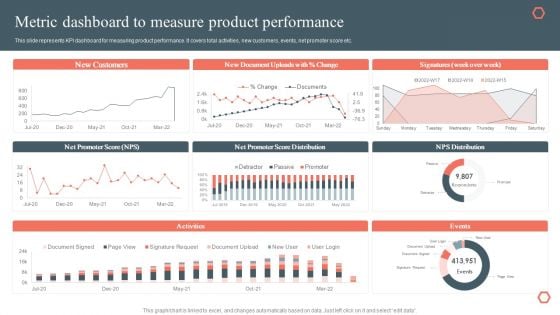
Metric Dashboard To Measure Product Performance Product Development And Management Plan Demonstration PDF
This slide represents dashboard for tracking product success. It covers new customer, total sessions, purchase, total inquires, total crashes etc.If your project calls for a presentation, then Slidegeeks is your go to partner because we have professionally designed, easy to edit templates that are perfect for any presentation. After downloading, you can easily edit Metric Dashboard To Measure Product Performance Product Development And Management Plan Demonstration PDF and make the changes accordingly. You can rearrange slides or fill them with different images. Check out all the handy templates.
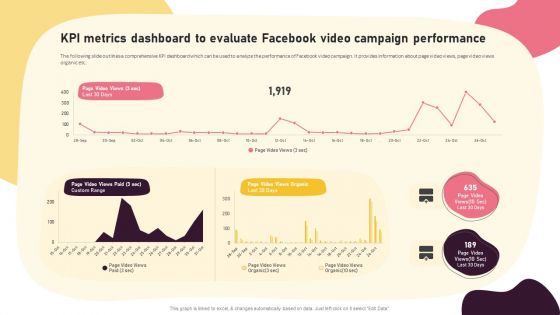
Video Promotion Techniques KPI Metrics Dashboard To Evaluate Facebook Video Introduction PDF
The following slide outlines a comprehensive KPI dashboard which can be used to analyze the performance of Facebook video campaign. It provides information about page video views, page video views organic etc. The best PPT templates are a great way to save time, energy, and resources. Slidegeeks have 100 percent editable powerpoint slides making them incredibly versatile. With these quality presentation templates, you can create a captivating and memorable presentation by combining visually appealing slides and effectively communicating your message. Download Video Promotion Techniques KPI Metrics Dashboard To Evaluate Facebook Video Introduction PDF from Slidegeeks and deliver a wonderful presentation.
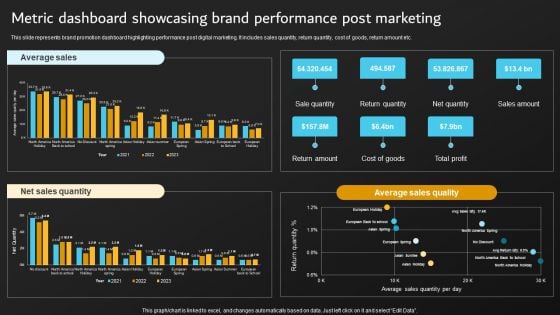
Implementation Of Digital Marketing Metric Dashboard Showcasing Brand Performance Diagrams PDF
This slide represents brand promotion dashboard highlighting performance post digital marketing. It includes sales quantity, return quantity, cost of goods, return amount etc. Slidegeeks has constructed Implementation Of Digital Marketing Metric Dashboard Showcasing Brand Performance Diagrams PDF after conducting extensive research and examination. These presentation templates are constantly being generated and modified based on user preferences and critiques from editors. Here, you will find the most attractive templates for a range of purposes while taking into account ratings and remarks from users regarding the content. This is an excellent jumping-off point to explore our content and will give new users an insight into our top-notch PowerPoint Templates.
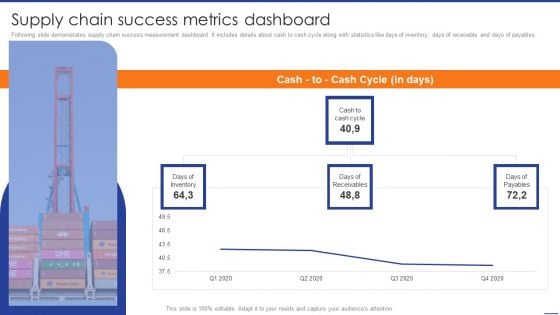
Digital Transformation Of Supply Supply Chain Success Metrics Dashboard Graphics PDF
Following slide demonstrates supply chain success measurement dashboard. It includes details about cash to cash cycle along with statistics like days of inventory, days of receivable and days of payables. If your project calls for a presentation, then Slidegeeks is your go-to partner because we have professionally designed, easy-to-edit templates that are perfect for any presentation. After downloading, you can easily edit Digital Transformation Of Supply Supply Chain Success Metrics Dashboard Graphics PDF and make the changes accordingly. You can rearrange slides or fill them with different images. Check out all the handy templates.
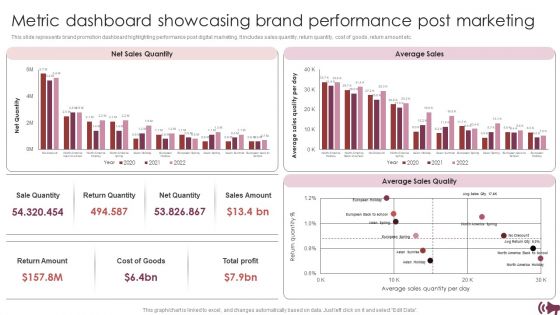
Guide Digital Advertising Optimize Lead Targeting Metric Dashboard Showcasing Brand Performance Post Slides PDF
This slide represents brand promotion dashboard highlighting performance post digital marketing. It includes sales quantity, return quantity, cost of goods, return amount etc. From laying roadmaps to briefing everything in detail, our templates are perfect for you. You can set the stage with your presentation slides. All you have to do is download these easy to edit and customizable templates. Guide Digital Advertising Optimize Lead Targeting Metric Dashboard Showcasing Brand Performance Post Slides PDF will help you deliver an outstanding performance that everyone would remember and praise you for. Do download this presentation today.
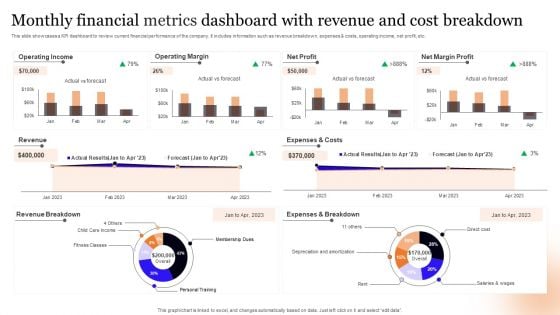
Monthly Financial Metrics Dashboard With Revenue And Cost Breakdown Information PDF
This slide showcases a KPI dashboard to review current financial performance of the company. It includes information such as revenue breakdown, expenses and costs, operating income, net profit, etc. Pitch your topic with ease and precision using this Monthly Financial Metrics Dashboard With Revenue And Cost Breakdown Information PDF. This layout presents information on Operating Income, Operating Margin, Net Profit. It is also available for immediate download and adjustment. So, changes can be made in the color, design, graphics or any other component to create a unique layout.
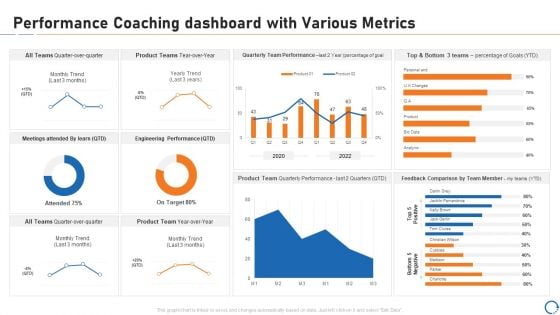
Upskill Training For Employee Performance Improvement Performance Coaching Dashboard With Various Metrics Designs PDF
Deliver an awe inspiring pitch with this creative upskill training for employee performance improvement performance coaching dashboard with various metrics designs pdf bundle. Topics like quarterly team performance, product teams, engineering performance, product team can be discussed with this completely editable template. It is available for immediate download depending on the needs and requirements of the user.
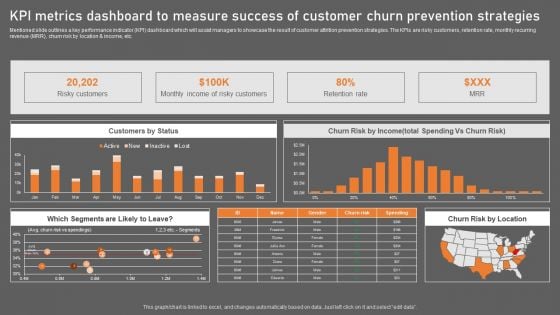
KPI Metrics Dashboard To Measure Success Of Customer Churn Prevention Strategies Structure PDF
There are so many reasons you need a KPI Metrics Dashboard To Measure Success Of Customer Churn Prevention Strategies Structure PDF. The first reason is you can not spend time making everything from scratch, Thus, Slidegeeks has made presentation templates for you too. You can easily download these templates from our website easily.
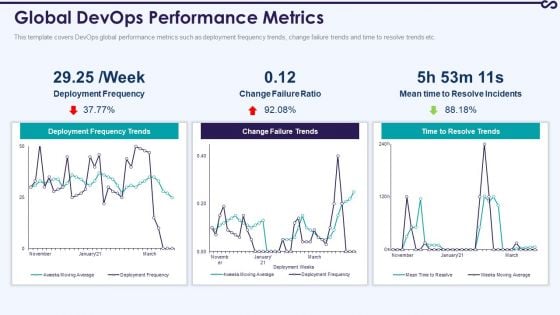
Development And Operations KPI Dashboard IT Global Devops Performance Metrics Themes PDF
This template covers DevOps global performance metrics such as deployment frequency trends, change failure trends and time to resolve trends etc. Deliver an awe inspiring pitch with this creative development and operations kpi dashboard it global devops performance metrics themes pdf bundle. Topics like global devops performance metrics can be discussed with this completely editable template. It is available for immediate download depending on the needs and requirements of the user.
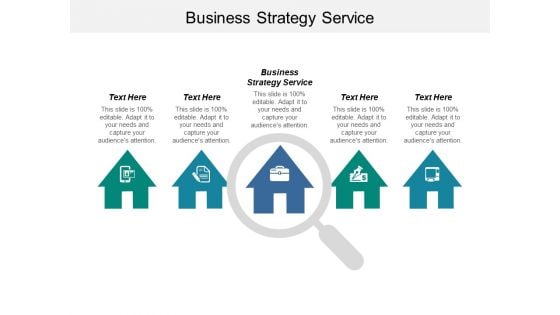
Business Strategy Service Ppt PowerPoint Presentation Pictures Background Images Cpb
This is a business strategy service ppt powerpoint presentation pictures background images cpb. This is a five stage process. The stages in this process are business strategy service.
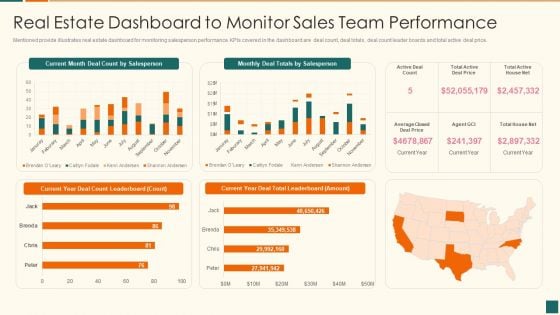
Developing Marketing Campaign For Real Estate Project Real Estate Dashboard To Monitor Demonstration PDF
Mentioned provide illustrates real estate dashboard for monitoring salesperson performance. KPIs covered in the dashboard are deal count, deal totals, deal count leader boards and total active deal price. Deliver an awe inspiring pitch with this creative developing marketing campaign for real estate project real estate dashboard to monitor demonstration pdf bundle. Topics like real estate dashboard to monitor sales team performance can be discussed with this completely editable template. It is available for immediate download depending on the needs and requirements of the user.
Real Estate Marketing Plan To Sell Real Estate Dashboard To Monitor Sales Team Demonstration PDF
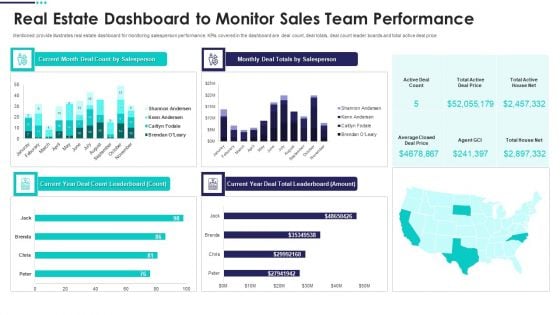
Mentioned provide illustrates real estate dashboard for monitoring salesperson performance. KPIs covered in the dashboard are deal count, deal totals, deal count leader boards and total active deal price Deliver an awe inspiring pitch with this creative Real Estate Marketing Plan To Sell Real Estate Dashboard To Monitor Sales Team Demonstration PDF bundle. Topics like Real Estate Dashboard To Monitor Sales Team Performance can be discussed with this completely editable template. It is available for immediate download depending on the needs and requirements of the user.
Key Measures For Customer Satisfaction Powerpoint Templates
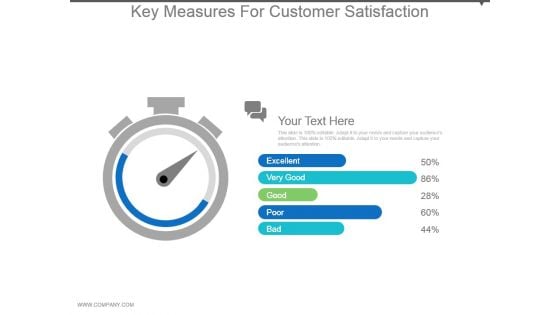
This is a key measures for customer satisfaction powerpoint templates. This is a one stage process. The stages in this process are excellent, very good, good, poor, bad.

Data Quality Dashboard For Linked Data Integrating Linked Data To Enhance Operational Template PDF
This slide describes the data quality dashboard for linked data by covering details of account information quality, contact details quality, financial data quality, and missing account information.This Data Quality Dashboard For Linked Data Integrating Linked Data To Enhance Operational Template PDF from Slidegeeks makes it easy to present information on your topic with precision. It provides customization options, so you can make changes to the colors, design, graphics, or any other component to create a unique layout. It is also available for immediate download, so you can begin using it right away. Slidegeeks has done good research to ensure that you have everything you need to make your presentation stand out. Make a name out there for a brilliant performance.

Magnify Glass Ppt PowerPoint Presentation Pictures Example Topics
This is a magnify glass ppt powerpoint presentation pictures example topics. This is a five stage process. The stages in this process are magnify glass, business, technology, communication, marketing.
Magnifier Glass Ppt PowerPoint Presentation Pictures Graphics Tutorials
This is a magnifier glass ppt powerpoint presentation pictures graphics tutorials. This is a one stage process. The stages in this process are magnifying glass, business, marketing, technology, communication.
Key Societal Priorities Ppt PowerPoint Presentation Graphics
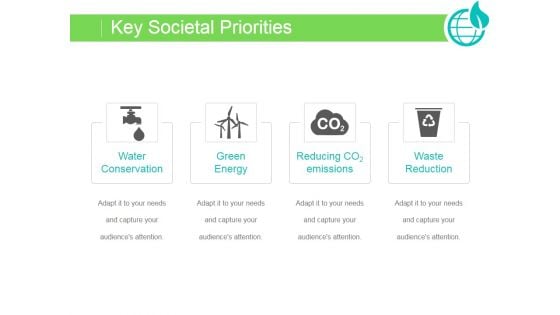
This is a key societal priorities ppt powerpoint presentation graphics. This is a four stage process. The stages in this process are water conservation, green energy, reducing co emissions, waste reduction.
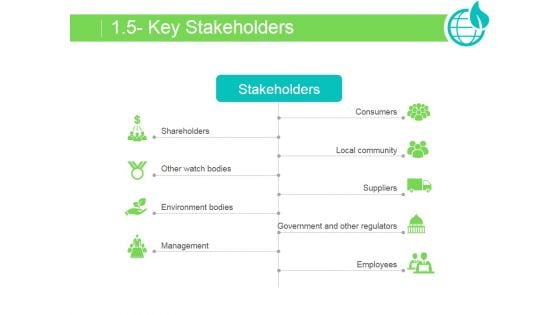
Key Stakeholders Ppt PowerPoint Presentation Example 2015
This is a key stakeholders ppt powerpoint presentation example 2015. This is a nine stage process. The stages in this process are shareholders, other watch bodies, environment bodies, management, consumers, local community, suppliers, government and other regulators, employees.
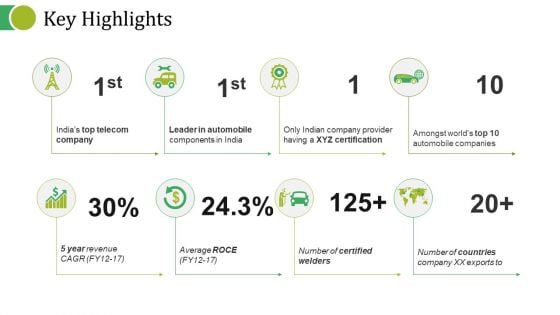
Key Highlights Ppt PowerPoint Presentation Summary Demonstration
This is a key highlights ppt powerpoint presentation summary demonstration. This is a eight stage process. The stages in this process are top telecom company, leader in automobile, xyz certification, automobile companies.
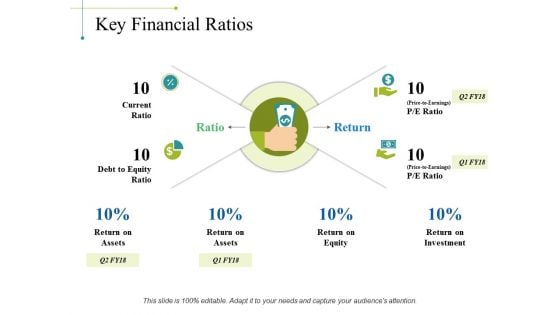
Key Financial Ratios Ppt PowerPoint Presentation Guidelines
This is a key financial ratios ppt powerpoint presentation guidelines. This is a four stage process. The stages in this process are current ratio, debt to equity ratio, ratio, return, return on assets.
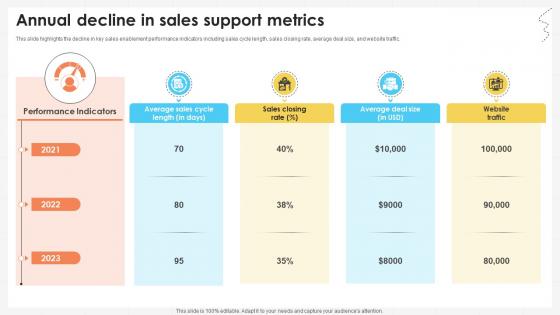
Business Development Team Annual Decline In Sales Support Metrics SA SS V
This slide highlights the decline in key sales enablement performance indicators including sales cycle length, sales closing rate, average deal size, and website traffic. Create an editable Business Development Team Annual Decline In Sales Support Metrics SA SS V that communicates your idea and engages your audience. Whether you are presenting a business or an educational presentation, pre-designed presentation templates help save time. Business Development Team Annual Decline In Sales Support Metrics SA SS V is highly customizable and very easy to edit, covering many different styles from creative to business presentations. Slidegeeks has creative team members who have crafted amazing templates. So, go and get them without any delay. This slide highlights the decline in key sales enablement performance indicators including sales cycle length, sales closing rate, average deal size, and website traffic.
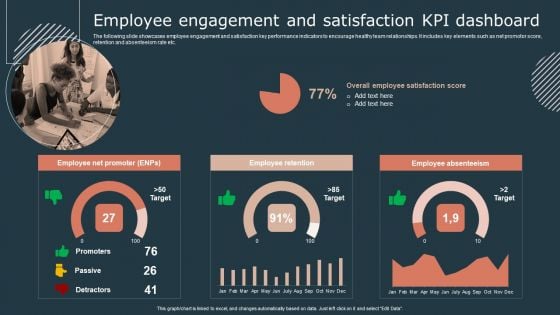
Effective Workforce Participation Action Planning Employee Engagement And Satisfaction Kpi Dashboard Themes PDF
The following slide showcases employee engagement and satisfaction key performance indicators to encourage healthy team relationships. It includes key elements such as net promotor score, retention and absenteeism rate etc. From laying roadmaps to briefing everything in detail, our templates are perfect for you. You can set the stage with your presentation slides. All you have to do is download these easy to edit and customizable templates. Effective Workforce Participation Action Planning Employee Engagement And Satisfaction Kpi Dashboard Themes PDF will help you deliver an outstanding performance that everyone would remember and praise you for. Do download this presentation today.
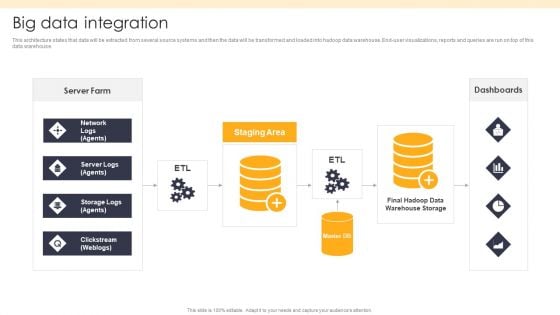
ETL Repository Big Data Integration Ppt PowerPoint Presentation Ideas Outline PDF
This architecture states that data will be extracted from several source systems and then the data will be transformed and loaded into hadoop data warehouse. End-user visualizations, reports and queries are run on top of this data warehouse.Deliver and pitch your topic in the best possible manner with this ETL Repository Big Data Integration Ppt PowerPoint Presentation Ideas Outline PDF. Use them to share invaluable insights on Server Farm, Staging Area, Dashboards and impress your audience. This template can be altered and modified as per your expectations. So, grab it now.
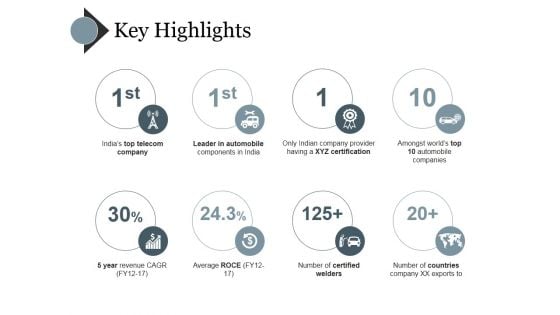
Key Highlights Ppt PowerPoint Presentation Gallery Deck
This is a key highlights ppt powerpoint presentation gallery deck. This is a eight stage process. The stages in this process are indias top telecom company, leader in automobile components in india, only indian company provider having a xyz certification, amongst worlds top 10 automobile companies, number of certified welders.
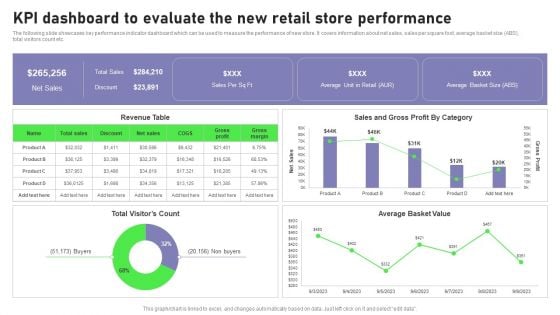
Retail Outlet Opening To Enhance Product Sale Kpi Dashboard To Evaluate The New Retail Guidelines PDF
The following slide showcases key performance indicator dashboard which can be used to measure the performance of new store. It covers information about net sales, sales per square foot, average basket size ABS, total visitors count etc. There are so many reasons you need a Retail Outlet Opening To Enhance Product Sale Kpi Dashboard To Evaluate The New Retail Guidelines PDF. The first reason is you can not spend time making everything from scratch, Thus, Slidegeeks has made presentation templates for you too. You can easily download these templates from our website easily.
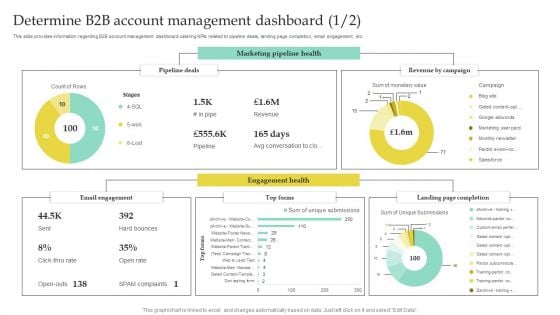
Determine B2B Account Management Dashboard Slides PDF
This slide provides information regarding B2B account management dashboard catering KPIs related to pipeline deals, landing page completion, email engagement, etc. Crafting an eye catching presentation has never been more straightforward. Let your presentation shine with this tasteful yet straightforward Determine B2B Account Management Dashboard Slides PDF template. It offers a minimalistic and classy look that is great for making a statement. The colors have been employed intelligently to add a bit of playfulness while still remaining professional. Construct the ideal Determine B2B Account Management Dashboard Slides PDF that effortlessly grabs the attention of your audience Begin now and be certain to wow your customers.
Our Keys To Success Template Ppt PowerPoint Presentation Guide
This is a our keys to success template ppt powerpoint presentation guide. This is a four stage process. The stages in this process are shapes, key, business, marketing, strategy.
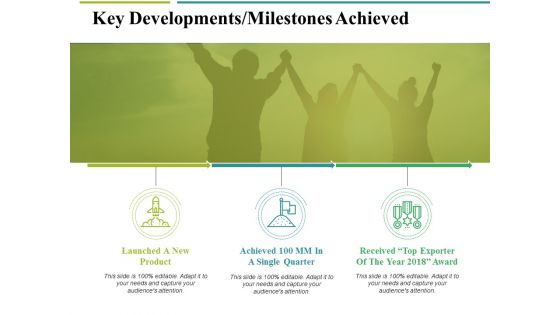
Key Developments Milestones Achieved Ppt PowerPoint Presentation Ideas Styles
This is a key developments milestones achieved ppt powerpoint presentation ideas styles. This is a three stage process. The stages in this process are launched a new product, single quarter, key developments, business, marketing.
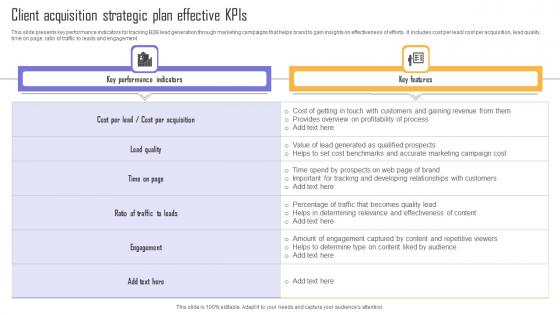
Client Acquisition Strategic Plan Effective Kpis Microsoft Pdf
This slide presents key performance indicators for tracking B2B lead generation through marketing campaigns that helps brand to gain insights on effectiveness of efforts. It includes cost per lead cost per acquisition, lead quality, time on page, ratio of traffic to leads and engagement. Pitch your topic with ease and precision using this Client Acquisition Strategic Plan Effective Kpis Microsoft Pdf. This layout presents information on Key Performance Indicators, Key Features. It is also available for immediate download and adjustment. So, changes can be made in the color, design, graphics or any other component to create a unique layout. This slide presents key performance indicators for tracking B2B lead generation through marketing campaigns that helps brand to gain insights on effectiveness of efforts. It includes cost per lead cost per acquisition, lead quality, time on page, ratio of traffic to leads and engagement.
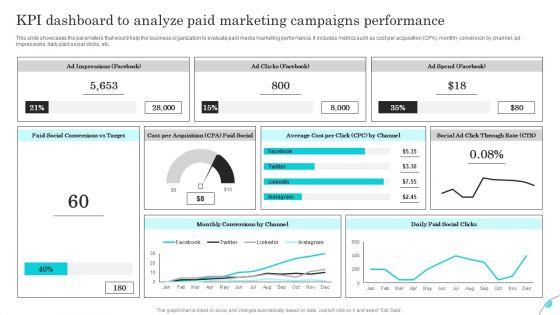
KPI Dashboard To Analyze Paid Marketing Campaigns Performance Background PDF
This slide showcases the parameters that would help the business organization to evaluate paid media marketing performance. It includes metrics such as cost per acquisition CPA, monthly conversion by channel, ad impressions, daily paid social clicks, etc. Present like a pro with KPI Dashboard To Analyze Paid Marketing Campaigns Performance Background PDF Create beautiful presentations together with your team, using our easy to use presentation slides. Share your ideas in real time and make changes on the fly by downloading our templates. So whether you are in the office, on the go, or in a remote location, you can stay in sync with your team and present your ideas with confidence. With Slidegeeks presentation got a whole lot easier. Grab these presentations today.

Improving Corporate Performance Sales Opportunity Monitoring Dashboard Portrait PDF
This graph or chart is linked to excel, and changes automatically based on data. Just left click on it and select Edit Data. Welcome to our selection of the Improving Corporate Performance Sales Opportunity Monitoring Dashboard Portrait PDF. These are designed to help you showcase your creativity and bring your sphere to life. Planning and Innovation are essential for any business that is just starting out. This collection contains the designs that you need for your everyday presentations. All of our PowerPoints are 100 percent editable, so you can customize them to suit your needs. This multi-purpose template can be used in various situations. Grab these presentation templates today.
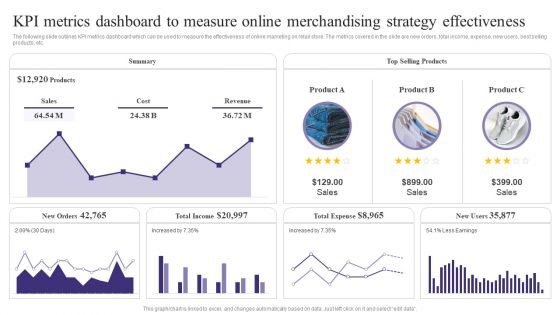
KPI Metrics Dashboard To Measure Online Merchandising Strategy Effectiveness Sample PDF
The following slide outlines KPI metrics dashboard which can be used to measure the effectiveness of online marketing on retail store. The metrics covered in the slide are new orders, total income, expense, new users, best selling products, etc. Coming up with a presentation necessitates that the majority of the effort goes into the content and the message you intend to convey. The visuals of a PowerPoint presentation can only be effective if it supplements and supports the story that is being told. Keeping this in mind our experts created KPI Metrics Dashboard To Measure Online Merchandising Strategy Effectiveness Sample PDF to reduce the time that goes into designing the presentation. This way, you can concentrate on the message while our designers take care of providing you with the right template for the situation.
Key Measures For Judging Success Powerpoint Slide Ideas
This is a key measures for judging success powerpoint slide ideas. This is a eight stage process. The stages in this process are marketing, management, strategy, success, business.
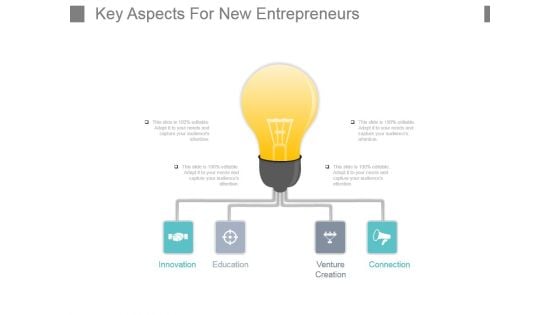
Key Aspects For New Entrepreneurs Powerpoint Slide Ideas
This is a key aspects for new entrepreneurs powerpoint slide ideas. This is a four stage process. The stages in this process are innovation, education, venture creation, connection.
Key Attributes Of Fixed Price Model Ppt PowerPoint Presentation Icon
This is a key attributes of fixed price model ppt powerpoint presentation icon. This is a six stage process. The stages in this process are fixed price model.
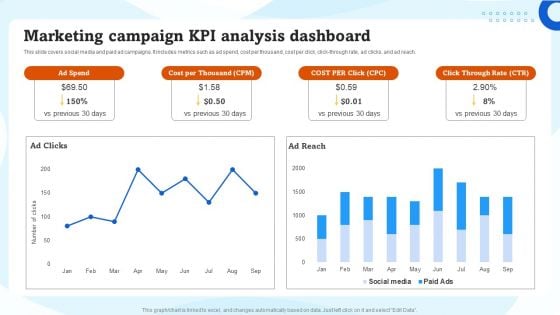
Marketing Campaign KPI Analysis Dashboard Ppt Inspiration Example File PDF
This slide covers social media and paid ad campaigns. It includes metrics such as ad spend, cost per thousand, cost per click, click-through rate, ad clicks, and ad reach. Coming up with a presentation necessitates that the majority of the effort goes into the content and the message you intend to convey. The visuals of a PowerPoint presentation can only be effective if it supplements and supports the story that is being told. Keeping this in mind our experts created Marketing Campaign KPI Analysis Dashboard Ppt Inspiration Example File PDF to reduce the time that goes into designing the presentation. This way, you can concentrate on the message while our designers take care of providing you with the right template for the situation.
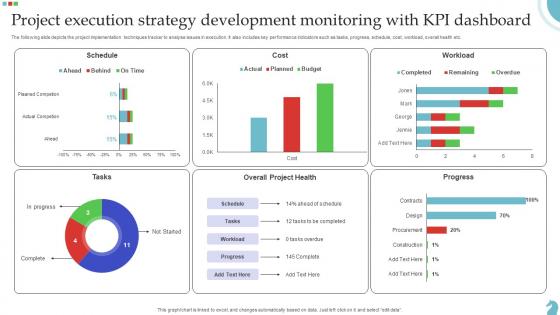
Project Execution Strategy Development Monitoring With Kpi Dashboard Download Pdf
The following slide depicts the project implementation techniques tracker to analyse issues in execution. It also includes key performance indicators such as tasks, progress, schedule, cost, workload, overall health etc. Pitch your topic with ease and precision using this Project Execution Strategy Development Monitoring With Kpi Dashboard Download Pdf. This layout presents information on Project Execution, Strategy Development, Monitoring Kpi Dashboard. It is also available for immediate download and adjustment. So, changes can be made in the color, design, graphics or any other component to create a unique layout. The following slide depicts the project implementation techniques tracker to analyse issues in execution. It also includes key performance indicators such as tasks, progress, schedule, cost, workload, overall health etc.
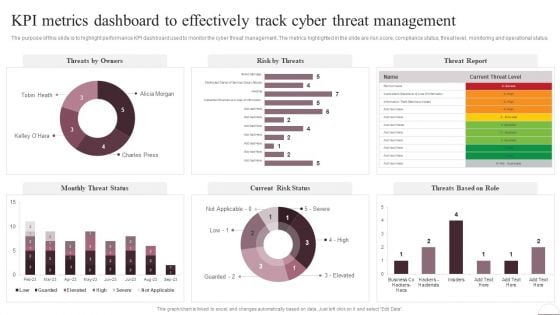
Prevention Of Information KPI Metrics Dashboard To Effectively Track Cyber Guidelines PDF
The purpose of this slide is to highlight performance KPI dashboard used to monitor the cyber threat management. The metrics highlighted in the slide are risk score, compliance status, threat level, monitoring and operational status. Welcome to our selection of the Prevention Of Information KPI Metrics Dashboard To Effectively Track Cyber Guidelines PDF. These are designed to help you showcase your creativity and bring your sphere to life. Planning and Innovation are essential for any business that is just starting out. This collection contains the designs that you need for your everyday presentations. All of our PowerPoints are 100 percent editable, so you can customize them to suit your needs. This multi-purpose template can be used in various situations. Grab these presentation templates today
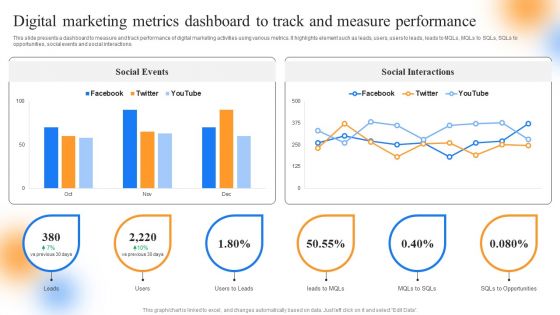
Strategic Guide To Perform Marketing Digital Marketing Metrics Dashboard To Track Diagrams PDF
This slide presents a dashboard to measure and track performance of digital marketing activities using various metrics. It highlights element such as leads, users, users to leads, leads to MQLs, MQLs to SQLs, SQLs to opportunities, social events and social interactions. Retrieve professionally designed Strategic Guide To Perform Marketing Digital Marketing Metrics Dashboard To Track Diagrams PDF to effectively convey your message and captivate your listeners. Save time by selecting pre-made slideshows that are appropriate for various topics, from business to educational purposes. These themes come in many different styles, from creative to corporate, and all of them are easily adjustable and can be edited quickly. Access them as PowerPoint templates or as Google Slides themes. You dont have to go on a hunt for the perfect presentation because Slidegeeks got you covered from everywhere.
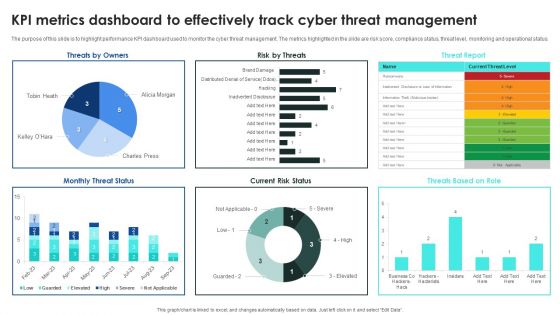
Implementing Cybersecurity Awareness Program To Prevent Attacks KPI Metrics Dashboard To Effectively Track Inspiration PDF
The purpose of this slide is to highlight performance KPI dashboard used to monitor the cyber threat management. The metrics highlighted in the slide are risk score, compliance status, threat level, monitoring and operational status. Welcome to our selection of the Implementing Cybersecurity Awareness Program To Prevent Attacks KPI Metrics Dashboard To Effectively Track Inspiration PDF. These are designed to help you showcase your creativity and bring your sphere to life. Planning and Innovation are essential for any business that is just starting out. This collection contains the designs that you need for your everyday presentations. All of our PowerPoints are 100 percent editable, so you can customize them to suit your needs. This multi purpose template can be used in various situations. Grab these presentation templates today.
Insurance Company Business Plan Insurance Agency Activities Tracking Dashboard Information PDF
This slide provides glimpse about insurance agency activities tracking dashboard which help management in monitoring activities. Deliver an awe inspiring pitch with this creative Insurance Company Business Plan Insurance Agency Activities Tracking Dashboard Information PDF bundle. Topics like Insurance Agency, Activities Tracking Dashboard can be discussed with this completely editable template. It is available for immediate download depending on the needs and requirements of the user.
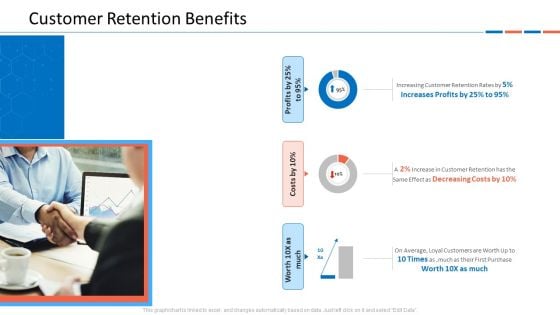
Customer Relationship Management Dashboard Customer Retention Benefits Inspiration PDF
This graph or chart is linked to excel, and changes automatically based on data. Just left click on it and select Edit Data.Deliver an awe inspiring pitch with this creative customer relationship management dashboard customer retention benefits inspiration pdf bundle. Topics like increasing customer retention rates, on average, loyal customers are worth up to 10 times as ,much as their first purchase, profits by 25percent to 95percent can be discussed with this completely editable template. It is available for immediate download depending on the needs and requirements of the user.
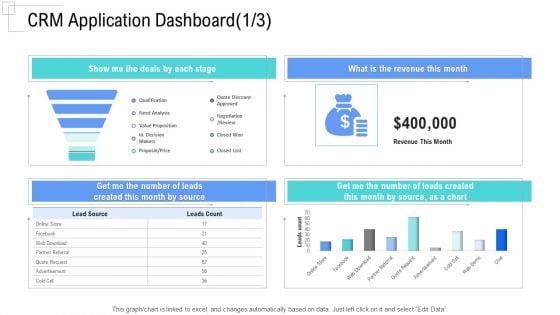
Managing Customer Experience CRM Application Dashboard Month Mockup PDF
This graph or chart is linked to excel, and changes automatically based on data. Just left click on it and select Edit Data.Deliver an awe-inspiring pitch with this creative managing customer experience crm application dashboard month mockup pdf bundle. Topics like show me the deals by each stage, what is the revenue this month, get me the number of leads created this month by source can be discussed with this completely editable template. It is available for immediate download depending on the needs and requirements of the user.
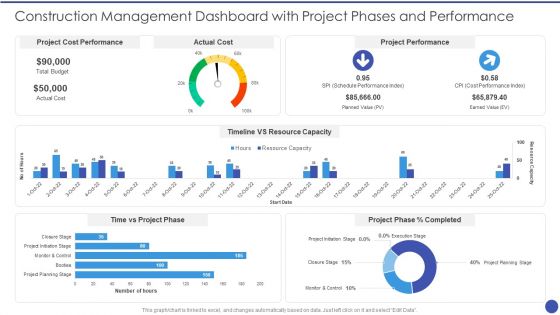
Construction Management Dashboard With Project Phases And Performance Inspiration PDF
This graph for chart is linked to excel, and changes automatically based on data. Just left click on it and select Edit Data. Deliver and pitch your topic in the best possible manner with this Construction Management Dashboard With Project Phases And Performance Inspiration PDF. Use them to share invaluable insights on Project Cost Performance, Actual Cost, Project Performance, Timeline VS Resource Capacity, Time vs Project Phase and impress your audience. This template can be altered and modified as per your expectations. So, grab it now.
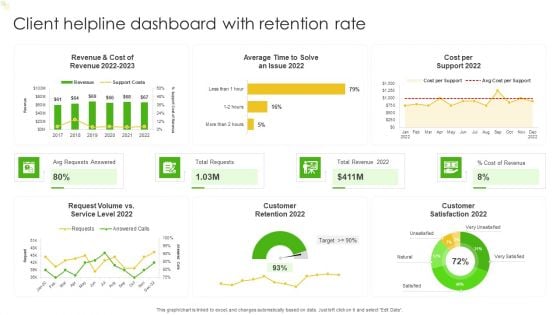
Client Helpline Dashboard With Retention Rate Ppt Gallery Ideas PDF
This graph or chart is linked to excel, and changes automatically based on data. Just left click on it and select Edit Data. Pitch your topic with ease and precision using this Client Helpline Dashboard With Retention Rate Ppt Gallery Ideas PDF. This layout presents information on Cost per Support 2022, Total Requests, Total Revenue 2022, Avg Requests Answered. It is also available for immediate download and adjustment. So, changes can be made in the color, design, graphics or any other component to create a unique layout.
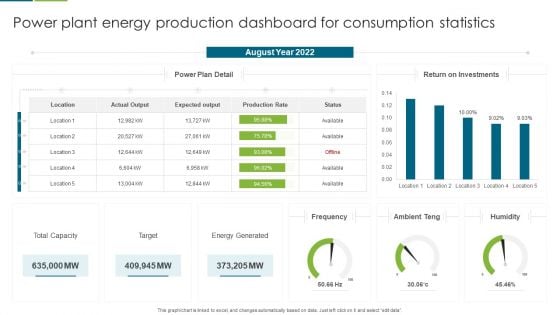
Power Plant Energy Production Dashboard For Consumption Statistics Download PDF
This graph or chart is linked to excel, and changes automatically based on data. Just left click on it and select edit data. Pitch your topic with ease and precision using this Multiple Country Energy Consumption Statistics Comparison Dashboard Formats PDF. This layout presents information on August Year 2022, Return on Investments, Power Plan Detail . It is also available for immediate download and adjustment. So, changes can be made in the color, design, graphics or any other component to create a unique layout.
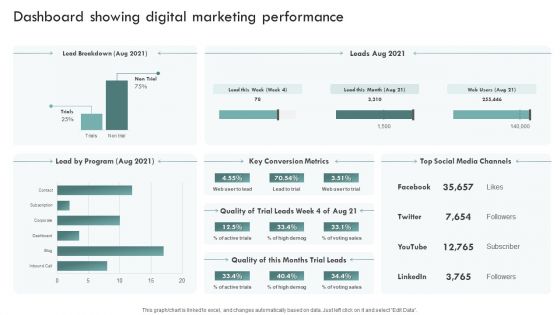
Brand Awareness Plan Dashboard Showing Digital Marketing Performance Sample PDF
This graph or chart is linked to excel, and changes automatically based on data. Just left click on it and select Edit Data. The best PPT templates are a great way to save time, energy, and resources. Slidegeeks have 100 percent editable powerpoint slides making them incredibly versatile. With these quality presentation templates, you can create a captivating and memorable presentation by combining visually appealing slides and effectively communicating your message. Download Brand Awareness Plan Dashboard Showing Digital Marketing Performance Sample PDF from Slidegeeks and deliver a wonderful presentation.
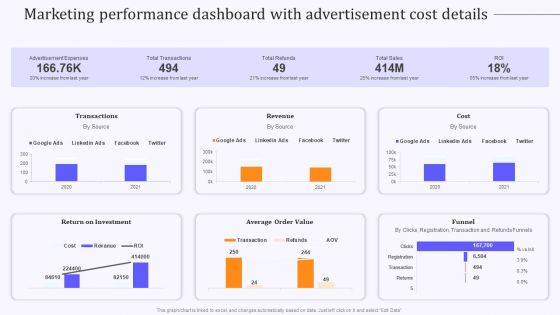
Product Marketing And Awareness Programs Marketing Performance Dashboard Information PDF
This graph or chart is linked to excel, and changes automatically based on data. Just left click on it and select Edit Data. Slidegeeks is one of the best resources for PowerPoint templates. You can download easily and regulate Product Marketing And Awareness Programs Marketing Performance Dashboard Information PDF for your personal presentations from our wonderful collection. A few clicks is all it takes to discover and get the most relevant and appropriate templates. Use our Templates to add a unique zing and appeal to your presentation and meetings. All the slides are easy to edit and you can use them even for advertisement purposes.
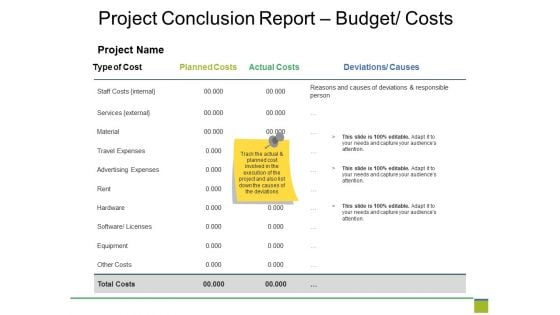
Project Conclusion Report Budget Costs Ppt PowerPoint Presentation Ideas Graphics Template
This is a project conclusion report budget costs ppt powerpoint presentation ideas graphics template. This is a four stage process. The stages in this process are type of cost, planned costs, actual costs, deviations.
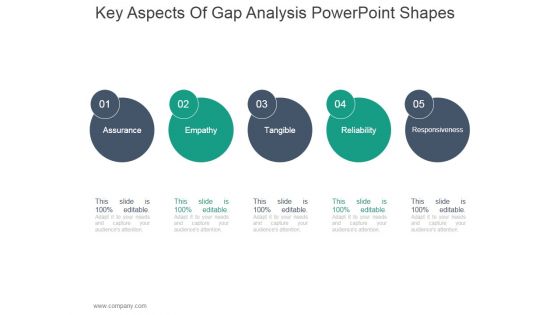
Key Aspects Of Gap Analysis Ppt PowerPoint Presentation Guide
This is a key aspects of gap analysis ppt powerpoint presentation guide. This is a five stage process. The stages in this process are assurance, empathy, tangible, reliability, responsiveness.
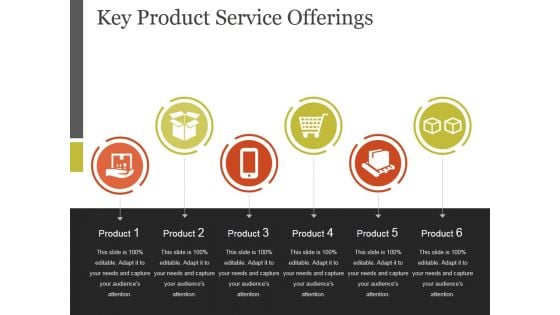
Key Product Service Offerings Template 2 Ppt PowerPoint Presentation Templates
This is a key product service offerings template 2 ppt powerpoint presentation templates. This is a six stage process. The stages in this process are product, marketing, business, management, strategy.
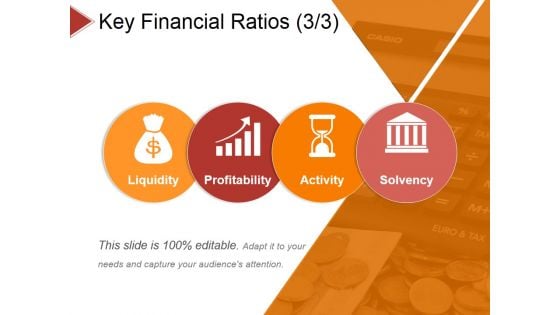
Key Financial Ratios Template 3 Ppt PowerPoint Presentation Summary Sample
This is a key financial ratios template 3 ppt powerpoint presentation summary sample. This is a four stage process. The stages in this process are liquidity, profitability, activity, solvency.
Key Financial Ratios Template Ppt PowerPoint Presentation Show Graphics Design
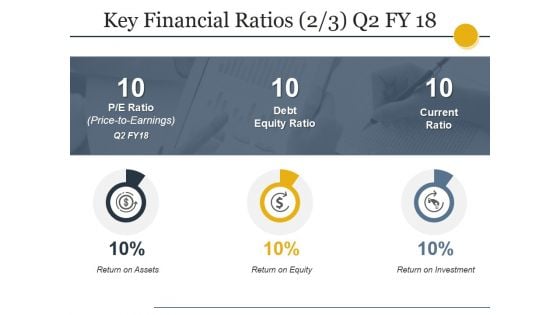
This is a key financial ratios template ppt powerpoint presentation show graphics design. This is a four stage process. The stages in this process are liquidity, profitability, activity, solvency.
Key Sales Initiative Ppt PowerPoint Presentation Infographics Show
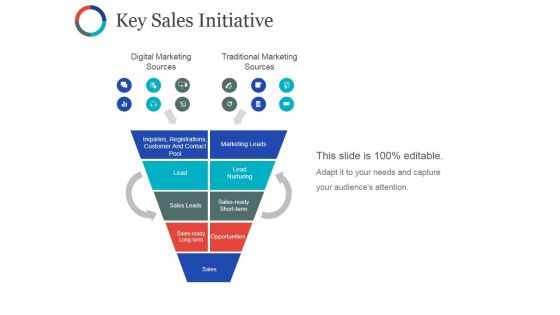
This is a key sales initiative ppt powerpoint presentation infographics show. This is a five stage process. The stages in this process are digital marketing sources, traditional marketing sources, lead, lead nurturing, sales leads.
Key Financial Ratios Ppt PowerPoint Presentation Infographic Template Master Slide
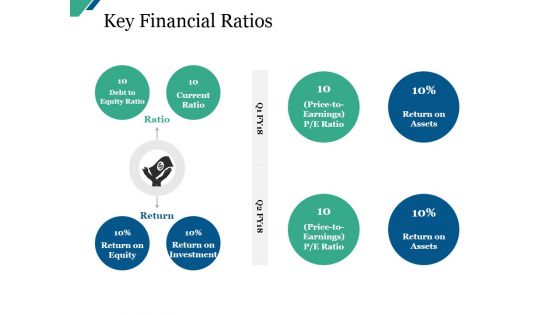
This is a key financial ratios ppt powerpoint presentation infographic template master slide. This is a eight stage process. The stages in this process are debt to equity ratio, current ratio, return on equity, return on investment.
Key Financial Ratios Ppt PowerPoint Presentation Model Elements
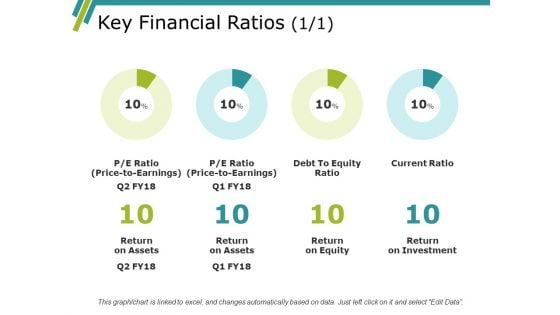
This is a key financial ratios ppt powerpoint presentation model elements. This is a four stage process. The stages in this process are return on assets, return on equity, return on investment.
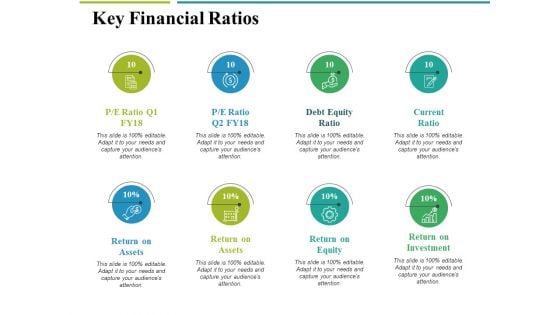
Key Financial Ratios Ppt PowerPoint Presentation Portfolio Summary
This is a key financial ratios ppt powerpoint presentation portfolio summary. This is a eight stage process. The stages in this process are return on assets, return on equity, return on investment, debt equity ratio, current ratio.
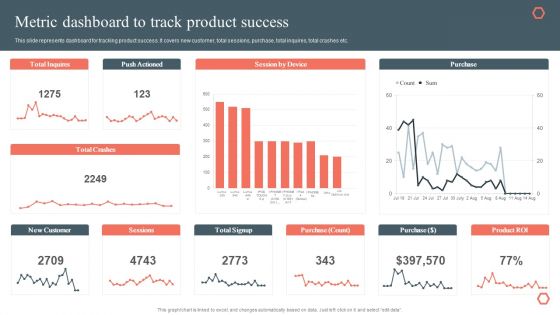
Metric Dashboard To Track Product Success Product Development And Management Plan Portrait PDF
This slide represents product development timeline. It covers gathering resources, strategy development, performance validation, prototyping etc.If you are looking for a format to display your unique thoughts, then the professionally designed Metric Dashboard To Track Product Success Product Development And Management Plan Portrait PDF is the one for you. You can use it as a Google Slides template or a PowerPoint template. Incorporate impressive visuals, symbols, images, and other charts. Modify or reorganize the text boxes as you desire. Experiment with shade schemes and font pairings. Alter, share or cooperate with other people on your work. Download Metric Dashboard To Track Product Success Product Development And Management Plan Portrait PDF and find out how to give a successful presentation. Present a perfect display to your team and make your presentation unforgettable.
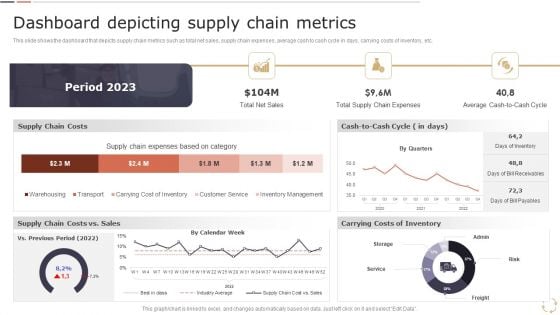
Optimizing Logistics Models To Enhance Supply Chain Management Dashboard Depicting Supply Chain Metrics Download PDF
This slide shows the dashboard that depicts supply chain metrics such as total net sales, supply chain expenses, average cash to cash cycle in days, carrying costs of inventory, etc. Coming up with a presentation necessitates that the majority of the effort goes into the content and the message you intend to convey. The visuals of a PowerPoint presentation can only be effective if it supplements and supports the story that is being told. Keeping this in mind our experts created Optimizing Logistics Models To Enhance Supply Chain Management Dashboard Depicting Supply Chain Metrics Download PDF to reduce the time that goes into designing the presentation. This way, you can concentrate on the message while our designers take care of providing you with the right template for the situation.


 Continue with Email

 Home
Home


