Snapshot
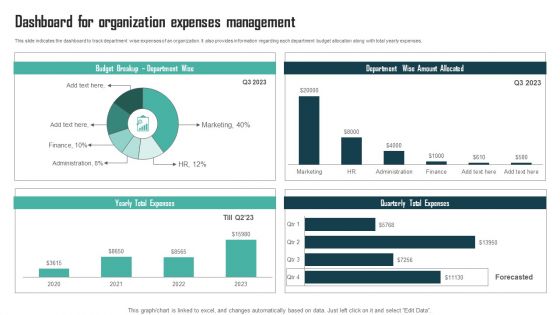
Expenses Management Plan Dashboard For Organization Expenses Management Mockup PDF
This slide indicates the dashboard to track department wise expenses of an organization. It also provides information regarding each department budget allocation along with total yearly expenses. Slidegeeks is one of the best resources for PowerPoint templates. You can download easily and regulate Expenses Management Plan Dashboard For Organization Expenses Management Mockup PDF for your personal presentations from our wonderful collection. A few clicks is all it takes to discover and get the most relevant and appropriate templates. Use our Templates to add a unique zing and appeal to your presentation and meetings. All the slides are easy to edit and you can use them even for advertisement purposes.
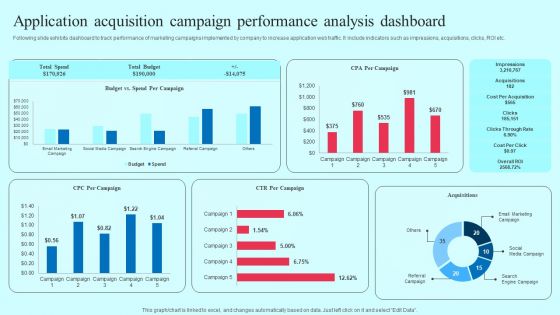
Application Acquisition Campaign Performance Analysis Dashboard Information PDF
Following slide exhibits dashboard to track performance of marketing campaigns implemented by company to increase application web traffic. It include indicators such as impressions, acquisitions, clicks, ROI etc. Find a pre designed and impeccable Application Acquisition Campaign Performance Analysis Dashboard Information PDF. The templates can ace your presentation without additional effort. You can download these easy to edit presentation templates to make your presentation stand out from others. So, what are you waiting for Download the template from Slidegeeks today and give a unique touch to your presentation.
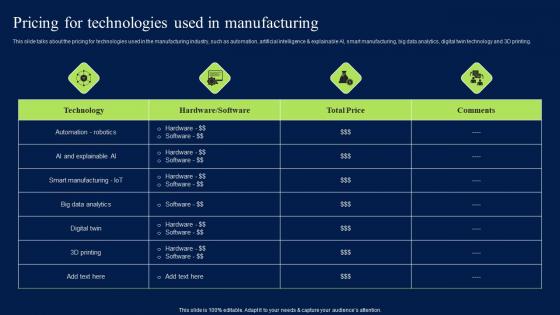
Pricing For Technologies Used In Manufacturing Pictures Grid PDF
This slide talks about the pricing for technologies used in the manufacturing industry, such as automation, artificial intelligence and explainable AI, smart manufacturing, big data analytics, digital twin technology and 3D printing. Boost your pitch with our creative Pricing For Technologies Used In Manufacturing Pictures Grid PDF. Deliver an awe-inspiring pitch that will mesmerize everyone. Using these presentation templates you will surely catch everyones attention. You can browse the ppts collection on our website. We have researchers who are experts at creating the right content for the templates. So you do not have to invest time in any additional work. Just grab the template now and use them. This slide talks about the pricing for technologies used in the manufacturing industry, such as automation, artificial intelligence and explainable AI, smart manufacturing, big data analytics, digital twin technology and 3D printing
Data Assimilation Your Title Here Metrics Ppt Icon Skills PDF
This is a data assimilation your title here metrics ppt icon skills pdf template with various stages. Focus and dispense information on two stages using this creative set, that comes with editable features. It contains large content boxes to add your information on topics like kpi metrics, kpi dashboards. You can also showcase facts, figures, and other relevant content using this PPT layout. Grab it now.
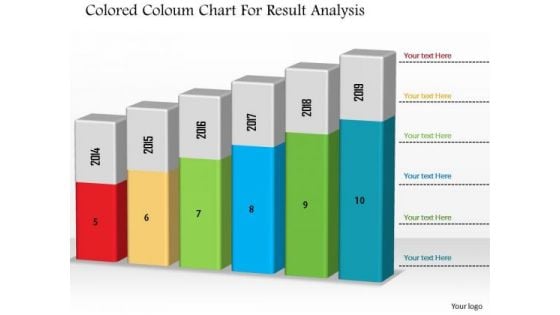
Business Diagram Colored Column Chart For Result Analysis PowerPoint Slide
This Power Point diagram has been designed with graphic of column chart. It contains diagram of bar char depicting annual business progress report. Use this diagram to build professional presentations for your viewers.

Omnichannel Banking Services Platform Dashboard To Track Performance Of Digital Loan Applications Background PDF
This slide covers dashboard to assess outcomes for loan applications applied by customer through various omnichannel banking services. It includes results based on elements such as debt restructuring, commercial property loans, credit card along with branch based loans, approval rates, etc. There are so many reasons you need a Omnichannel Banking Services Platform Dashboard To Track Performance Of Digital Loan Applications Background PDF. The first reason is you can not spend time making everything from scratch, Thus, Slidegeeks has made presentation templates for you too. You can easily download these templates from our website easily.
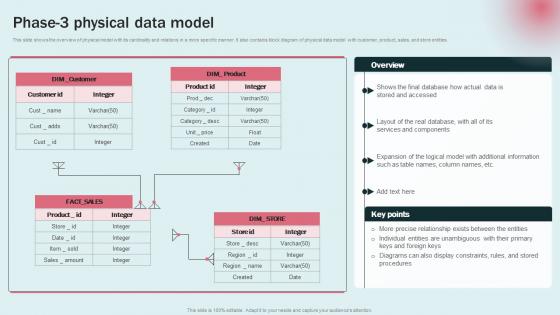
Phase 3 Physical Data Model Data Modeling Approaches For Modern Analytics Pictures Pdf
This slide shows the overview of physical model with its cardinality and relations in a more specific manner. It also contains block diagram of physical data model with customer, product, sales, and store entities. qExplore a selection of the finest Phase 3 Physical Data Model Data Modeling Approaches For Modern Analytics Pictures Pdf here. With a plethora of professionally designed and pre made slide templates, you can quickly and easily find the right one for your upcoming presentation. You can use our Phase 3 Physical Data Model Data Modeling Approaches For Modern Analytics Pictures Pdf to effectively convey your message to a wider audience. Slidegeeks has done a lot of research before preparing these presentation templates. The content can be personalized and the slides are highly editable. Grab templates today from Slidegeeks. This slide shows the overview of physical model with its cardinality and relations in a more specific manner. It also contains block diagram of physical data model with customer, product, sales, and store entities.
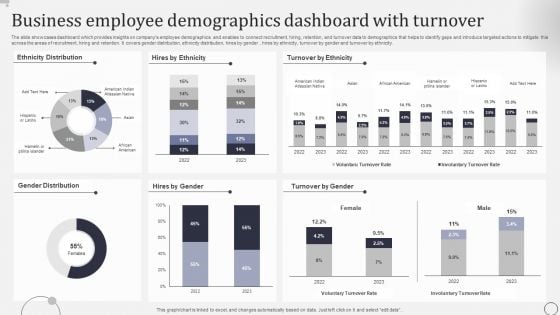
Business Employee Demographics Dashboard With Turnover Graphics PDF
The slide showcases dashboard which provides insights on companys employee demographics and enables to connect recruitment, hiring, retention, and turnover data to demographics that helps to identify gaps and introduce targeted actions to mitigate this across the areas of recruitment, hiring and retention. It covers gender distribution, ethnicity distribution, hires by gender , hires by ethnicity, turnover by gender and turnover by ethnicity. Showcasing this set of slides titled Business Employee Demographics Dashboard With Turnover Graphics PDF The topics addressed in these templates are Ethnicity Distribution, Turnover Ethnicity, Gender Distribution. All the content presented in this PPT design is completely editable. Download it and make adjustments in color, background, font etc. as per your unique business setting.
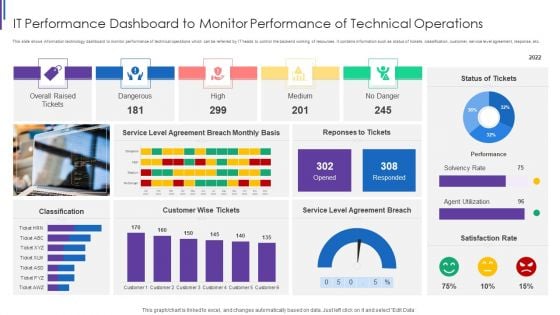
IT Performance Dashboard To Monitor Performance Of Technical Operations Download PDF
This slide shows information technology dashboard to monitor performance of technical operations which can be referred by IT heads to control the backend working of resources. It contains information such as status of tickets, classification, customer, service level agreement, response, etc. Showcasing this set of slides titled IT Performance Dashboard To Monitor Performance Of Technical Operations Download PDF. The topics addressed in these templates are Overall Raised Tickets, Dangerous High Medium, Service Level Agreement, Customer Wise Tickets. All the content presented in this PPT design is completely editable. Download it and make adjustments in color, background, font etc. as per your unique business setting.
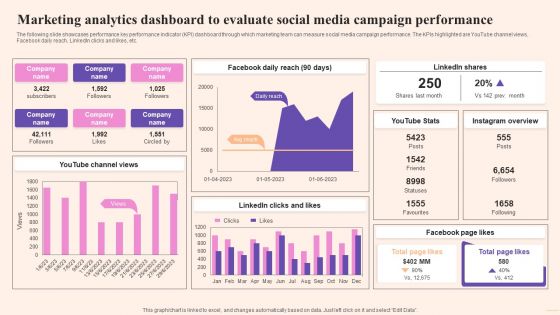
Comprehensive Guide To Build Marketing Marketing Analytics Dashboard To Evaluate Structure PDF
The following slide showcases performance key performance indicator KPI dashboard through which marketing team can measure social media campaign performance. The KPIs highlighted are YouTube channel views, Facebook daily reach, LinkedIn clicks and likes, etc. Explore a selection of the finest Comprehensive Guide To Build Marketing Marketing Analytics Dashboard To Evaluate Structure PDF here. With a plethora of professionally designed and pre-made slide templates, you can quickly and easily find the right one for your upcoming presentation. You can use our Comprehensive Guide To Build Marketing Marketing Analytics Dashboard To Evaluate Structure PDF to effectively convey your message to a wider audience. Slidegeeks has done a lot of research before preparing these presentation templates. The content can be personalized and the slides are highly editable. Grab templates today from Slidegeeks.
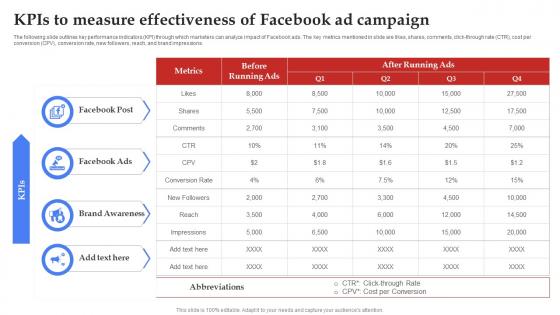
Facebook Marketing Plan Kpis To Measure Effectiveness Of Facebook Ad Strategy SS V
Devops Continuous Workflow Tracking Dashboard Slides PDF
This slide provides the glimpse of facts and figures related to continuous monitoring of project with DevOps. It includes planned vs. completed work items, work item priority wise, active bugs severity wise, etc. Showcasing this set of slides titled Devops Continuous Workflow Tracking Dashboard Slides PDF. The topics addressed in these templates are Continuous Workflow, Tracking Dashboard, Sprint Analysis By Assignee. All the content presented in this PPT design is completely editable. Download it and make adjustments in color, background, font etc. as per your unique business setting.
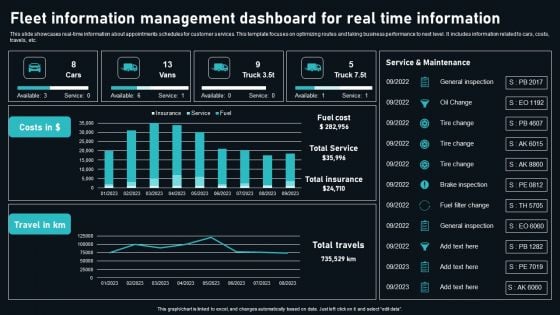
Fleet Information Management Dashboard For Real Time Information Graphics PDF
This slide showcases real time information about appointments schedules for customer services. This template focuses on optimizing routes and taking business performance to next level. It includes information related to cars, costs, travels, etc. Pitch your topic with ease and precision using this Fleet Information Management Dashboard For Real Time Information Graphics PDF. This layout presents information on General Inspection, Oil Change, Tire Change. It is also available for immediate download and adjustment. So, changes can be made in the color, design, graphics or any other component to create a unique layout.
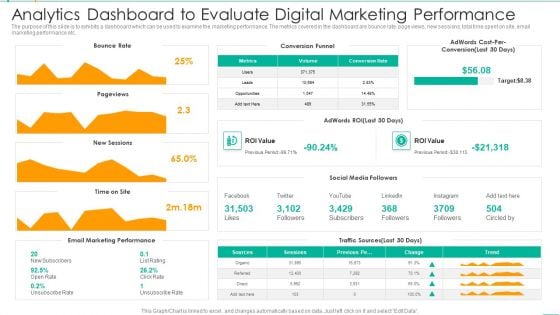
Analytics Dashboard To Evaluate Digital Marketing Performance Mockup PDF
The purpose of this slide is to exhibits a dashboard which can be used to examine the marketing performance. The metrics covered in the dashboard are bounce rate, page views, new sessions, total time spent on site, email marketing performance etc. Showcasing this set of slides titled Analytics Dashboard To Evaluate Digital Marketing Performance Mockup PDF. The topics addressed in these templates are Conversion Funnel, Target, Marketing Performance. All the content presented in this PPT design is completely editable. Download it and make adjustments in color, background, font etc. as per your unique business setting.
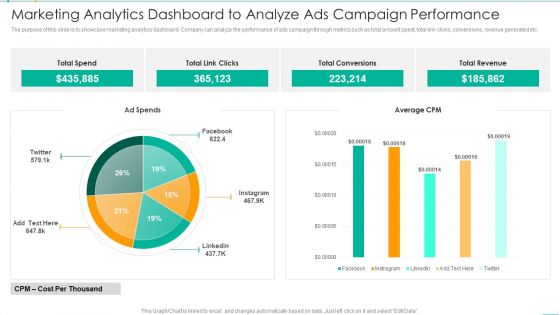
Marketing Analytics Dashboard To Analyze Ads Campaign Performance Microsoft PDF
The purpose of this slide is to showcase marketing analytics dashboard. Company can analyze the performance of ads campaign through metrics such as total amount spent, total link clicks, conversions, revenue generated etc. Showcasing this set of slides titled Marketing Analytics Dashboard To Analyze Ads Campaign Performance Microsoft PDF. The topics addressed in these templates are Marketing Analytics Dashboard To Analyze Ads Campaign Performance. All the content presented in this PPT design is completely editable. Download it and make adjustments in color, background, font etc. as per your unique business setting.
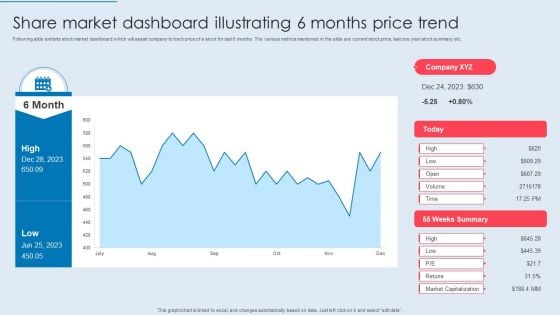
Share Market Dashboard Illustrating 6 Months Price Trend Ideas PDF
Following slide exhibits stock market dashboard which will assist company to track price of a stock for last 6 months. The various metrics mentioned in the slide are current stock price, last one year stock summary etc. Showcasing this set of slides titled Share Market Dashboard Illustrating 6 Months Price Trend Ideas PDF. The topics addressed in these templates are Share Market, Dashboard Illustrating, Months Price Trend. All the content presented in this PPT design is completely editable. Download it and make adjustments in color, background, font etc. as per your unique business setting.
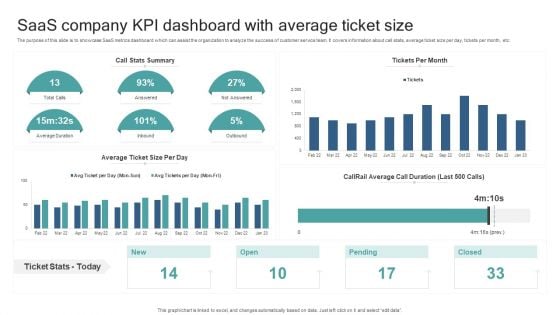
Saas Company KPI Dashboard With Average Ticket Size Sample PDF
The purpose of this slide is to showcase SaaS metrics dashboard which can assist the organization to analyze the success of customer service team. It covers information about call stats, average ticket size per day, tickets per month, etc. Showcasing this set of slides titled Saas Company KPI Dashboard With Average Ticket Size Sample PDF. The topics addressed in these templates are Saas Company Kpi, Dashboard, Average Ticket Size. All the content presented in this PPT design is completely editable. Download it and make adjustments in color, background, font etc. as per your unique business setting.
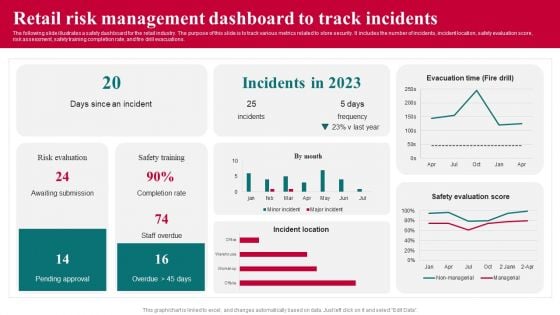
Retail Risk Management Dashboard To Track Incidents Professional PDF
The following slide illustrates a safety dashboard for the retail industry. The purpose of this slide is to track various metrics related to store security. It includes the number of incidents, incident location, safety evaluation score,risk assessment, safety training completion rate, and fire drill evacuations. Showcasing this set of slides titled Retail Risk Management Dashboard To Track Incidents Professional PDF. The topics addressed in these templates are Risk Evaluation, Retail Risk Management Dashboard, Track Incidents. All the content presented in this PPT design is completely editable. Download it and make adjustments in color, background, font etc. as per your unique business setting.
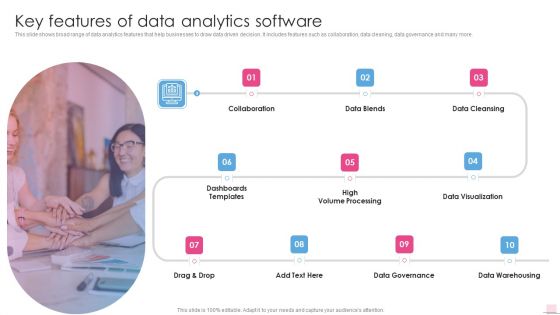
Key Features Of Data Analytics Software Business Analysis Modification Toolkit Brochure PDF
This slide shows broad range of data analytics features that help businesses to draw data driven decision. It includes features such as collaboration, data cleaning, data governance and many more.This is a Key Features Of Data Analytics Software Business Analysis Modification Toolkit Brochure PDF template with various stages. Focus and dispense information on ten stages using this creative set, that comes with editable features. It contains large content boxes to add your information on topics like Data Visualization, Data Warehousing, Dashboards Templates. You can also showcase facts, figures, and other relevant content using this PPT layout. Grab it now.
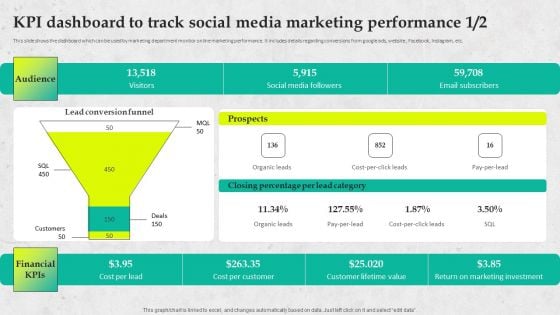
Service Promotion Plan KPI Dashboard To Track Social Media Marketing Performance Slides PDF
This slide shows the dashboard which can be used by marketing department monitor online marketing performance. It includes details regarding conversions from google ads, website , Facebook, Instagram, etc. Crafting an eye-catching presentation has never been more straightforward. Let your presentation shine with this tasteful yet straightforward Service Promotion Plan KPI Dashboard To Track Social Media Marketing Performance Slides PDF template. It offers a minimalistic and classy look that is great for making a statement. The colors have been employed intelligently to add a bit of playfulness while still remaining professional. Construct the ideal Service Promotion Plan KPI Dashboard To Track Social Media Marketing Performance Slides PDF that effortlessly grabs the attention of your audience Begin now and be certain to wow your customers.
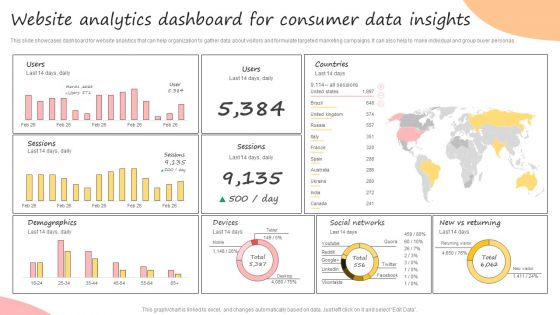
Developing Promotional Strategic Plan For Online Marketing Website Analytics Dashboard For Consumer Summary PDF
This slide showcases dashboard for website analytics that can help organization to gather data about visitors and formulate targeted marketing campaigns. It can also help to make individual and group buyer personas. Are you in need of a template that can accommodate all of your creative concepts This one is crafted professionally and can be altered to fit any style. Use it with Google Slides or PowerPoint. Include striking photographs, symbols, depictions, and other visuals. Fill, move around, or remove text boxes as desired. Test out color palettes and font mixtures. Edit and save your work, or work with colleagues. Download Developing Promotional Strategic Plan For Online Marketing Website Analytics Dashboard For Consumer Summary PDF and observe how to make your presentation outstanding. Give an impeccable presentation to your group and make your presentation unforgettable.
Online Ad Campaign Performance Tracking Dashboard Demonstration PDF
This slide covers the KPI dashboard for measuring digital campaign results. It includes metrics such as Ad cost, clicks, impressions, CTR, cost per click, conversions, conversion rate, cost per click, cost per thousand impressions, etc. Deliver and pitch your topic in the best possible manner with this Online Ad Campaign Performance Tracking Dashboard Demonstration PDF. Use them to share invaluable insights on Online Ad Campaign Performance, Tracking Dashboard and impress your audience. This template can be altered and modified as per your expectations. So, grab it now.
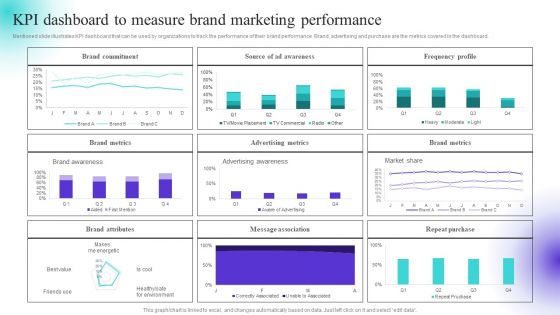
KPI Dashboard To Measure Brand Marketing Performance Inspiration PDF
Mentioned slide illustrates KPI dashboard that can be used by organizations to track the performance of their brand performance. Brand, advertising and purchase are the metrics covered in the dashboard. Boost your pitch with our creative KPI Dashboard To Measure Brand Marketing Performance Inspiration PDF. Deliver an awe inspiring pitch that will mesmerize everyone. Using these presentation templates you will surely catch everyones attention. You can browse the ppts collection on our website. We have researchers who are experts at creating the right content for the templates. So you do not have to invest time in any additional work. Just grab the template now and use them.
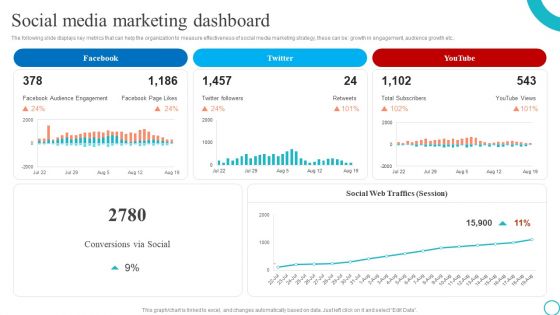
Social Media Marketing Dashboard Marketing Tactics To Enhance Business Topics PDF
The following slide displays key metrics that can help the organization to measure effectiveness of social media marketing strategy, these can be growth in engagement, audience growth etc. Slidegeeks is here to make your presentations a breeze with Social Media Marketing Dashboard Marketing Tactics To Enhance Business Topics PDF With our easy-to-use and customizable templates, you can focus on delivering your ideas rather than worrying about formatting. With a variety of designs to choose from, you are sure to find one that suits your needs. And with animations and unique photos, illustrations, and fonts, you can make your presentation pop. So whether you are giving a sales pitch or presenting to the board, make sure to check out Slidegeeks first.
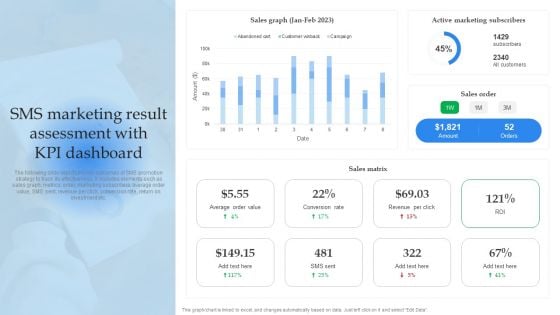
Mobile Promotion Strategic Guide For Micro Businesses Sms Marketing Result Assessment With Kpi Dashboard Slides PDF
The following slide depicts the key outcomes of SMS promotion strategy to track its effectiveness. It includes elements such as sales graph, metrics, order, marketing subscribers, average order value, SMS sent, revenue per click, conversion rate, return on investment etc. Slidegeeks is here to make your presentations a breeze with Mobile Promotion Strategic Guide For Micro Businesses Sms Marketing Result Assessment With Kpi Dashboard Slides PDF With our easy to use and customizable templates, you can focus on delivering your ideas rather than worrying about formatting. With a variety of designs to choose from, you are sure to find one that suits your needs. And with animations and unique photos, illustrations, and fonts, you can make your presentation pop. So whether you are giving a sales pitch or presenting to the board, make sure to check out Slidegeeks first.
Content Marketing Dashboard For Effective Tracking Marketing Tactics To Enhance Business Guidelines PDF
Purpose of the following slide is to show key metrics that can help the organization to track their content marketing efforts, these metrics are ad cost, visits, cost per click etc. Whether you have daily or monthly meetings, a brilliant presentation is necessary. Content Marketing Dashboard For Effective Tracking Marketing Tactics To Enhance Business Guidelines PDF can be your best option for delivering a presentation. Represent everything in detail using Content Marketing Dashboard For Effective Tracking Marketing Tactics To Enhance Business Guidelines PDF and make yourself stand out in meetings. The template is versatile and follows a structure that will cater to your requirements. All the templates prepared by Slidegeeks are easy to download and edit. Our research experts have taken care of the corporate themes as well. So, give it a try and see the results.
Target Audience Strategy For B2B And B2C Business Content Marketing Dashboard For Effective Tracking Mockup PDF
Purpose of the following slide is to show key metrics that can help the organization to track their content marketing efforts, these metrics are ad cost, visits, cost per click etc.. Do you have an important presentation coming up Are you looking for something that will make your presentation stand out from the rest Look no further than Target Audience Strategy For B2B And B2C Business Content Marketing Dashboard For Effective Tracking Mockup PDF. With our professional designs, you can trust that your presentation will pop and make delivering it a smooth process. And with Slidegeeks, you can trust that your presentation will be unique and memorable. So why wait Grab Target Audience Strategy For B2B And B2C Business Content Marketing Dashboard For Effective Tracking Mockup PDF today and make your presentation stand out from the rest
Key Features To Implement Data Analytics Software Business Analysis Modification Toolkit Icons PDF
This slide shows broad range of data analytics features that help businesses to draw data driven decision. It includes features such as collaboration, data cleaning, data governance and many more.This is a Key Features To Implement Data Analytics Software Business Analysis Modification Toolkit Icons PDF template with various stages. Focus and dispense information on seven stages using this creative set, that comes with editable features. It contains large content boxes to add your information on topics like Dashboards, Versatility, Flexible Data. You can also showcase facts, figures, and other relevant content using this PPT layout. Grab it now.
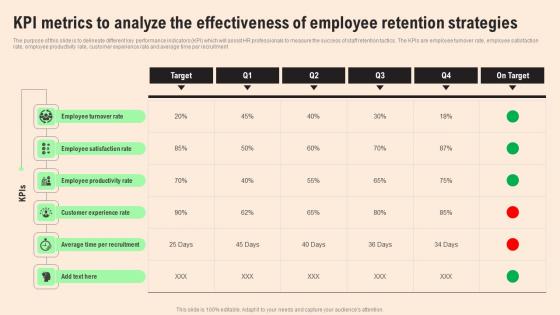
KPI Metrics To Analyze HR Retention Techniques For Business Owners Topics Pdf
The purpose of this slide is to delineate different key performance indicators KPI which will assist HR professionals to measure the success of staff retention tactics. The KPIs are employee turnover rate, employee satisfaction rate, employee productivity rate, customer experience rate and average time per recruitment Want to ace your presentation in front of a live audience Our KPI Metrics To Analyze HR Retention Techniques For Business Owners Topics Pdf can help you do that by engaging all the users towards you. Slidegeeks experts have put their efforts and expertise into creating these impeccable powerpoint presentations so that you can communicate your ideas clearly. Moreover, all the templates are customizable, and easy to edit and downloadable. Use these for both personal and commercial use. The purpose of this slide is to delineate different key performance indicators KPI which will assist HR professionals to measure the success of staff retention tactics. The KPIs are employee turnover rate, employee satisfaction rate, employee productivity rate, customer experience rate and average time per recruitment
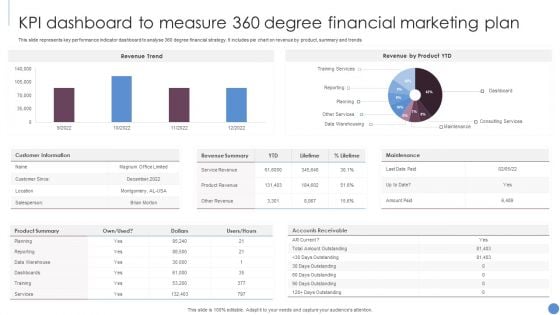
KPI Dashboard To Measure 360 Degree Financial Marketing Plan Slides PDF
This slide represents key performance indicator dashboard to analyse 360 degree financial strategy. It includes pie chart on revenue by product, summary and trends. Showcasing this set of slides titled KPI Dashboard To Measure 360 Degree Financial Marketing Plan Slides PDF. The topics addressed in these templates are Revenue Trend, Revenue Product YTD, Customer Information. All the content presented in this PPT design is completely editable. Download it and make adjustments in color, background, font etc. as per your unique business setting.
Magnify Glass Ppt PowerPoint Presentation Pictures Example
This is a magnify glass ppt powerpoint presentation pictures example. This is a one stage process. The stages in this process are magnify glass, business, marketing, success, technology.
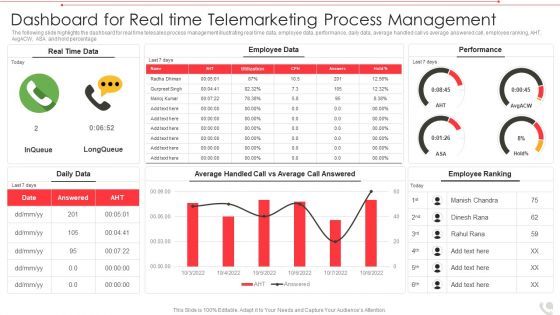
Dashboard For Real Time Telemarketing Process Management Themes PDF
The following slide highlights the dashboard for real time telesales process management illustrating real time data, employee data, performance, daily data, average handled call vs average answered call, employee ranking, AHT, AvgACW, ASA and hold percentage Showcasing this set of slides titled dashboard for real time telemarketing process management themes pdf The topics addressed in these templates are dashboard for real time telemarketing process management All the content presented in this PPT design is completely editable. Download it and make adjustments in color, background, font etc. as per your unique business setting.
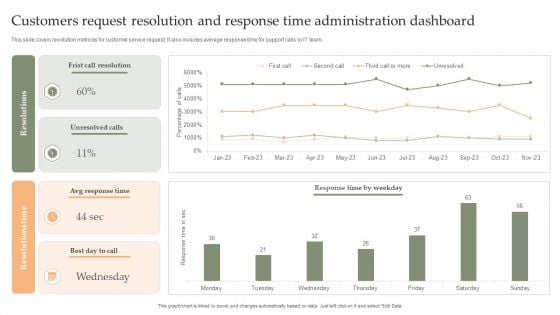
Customers Request Resolution And Response Time Administration Dashboard Mockup PDF
This slide covers resolution metrices for customer service request. It also includes average response time for support calls by IT team. Showcasing this set of slides titled Customers Request Resolution And Response Time Administration Dashboard Mockup PDF. The topics addressed in these templates are Frist Call Resolution, Unresolved Calls, Avg Response Time. All the content presented in this PPT design is completely editable. Download it and make adjustments in color, background, font etc. as per your unique business setting.
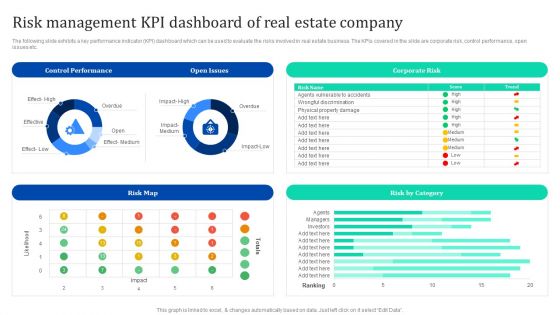
Risk Management Kpi Dashboard Of Real Estate Company Enhancing Process Improvement By Regularly Inspiration PDF
The following slide exhibits a key performance indicator KPI dashboard which can be used to evaluate the risks involved in real estate business. The KPIs covered in the slide are corporate risk, control performance, open issues etc. This Risk Management Kpi Dashboard Of Real Estate Company Enhancing Process Improvement By Regularly Inspiration PDF from Slidegeeks makes it easy to present information on your topic with precision. It provides customization options, so you can make changes to the colors, design, graphics, or any other component to create a unique layout. It is also available for immediate download, so you can begin using it right away. Slidegeeks has done good research to ensure that you have everything you need to make your presentation stand out. Make a name out there for a brilliant performance.
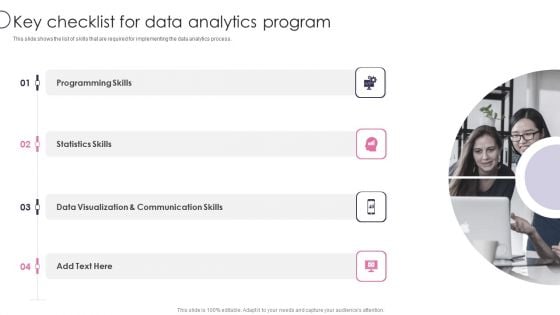
Information Transformation Process Toolkit Key Checklist For Data Analytics Program Template PDF
This diagram illustrates the Stream Analytics pipeline, showing how data is ingested, analyzed, and then sent for presentation or action. Deliver an awe inspiring pitch with this creative Information Transformation Process Toolkit Key Checklist For Data Analytics Program Template PDF bundle. Topics like Batch Analytics, Term Storage, Dashboard can be discussed with this completely editable template. It is available for immediate download depending on the needs and requirements of the user.
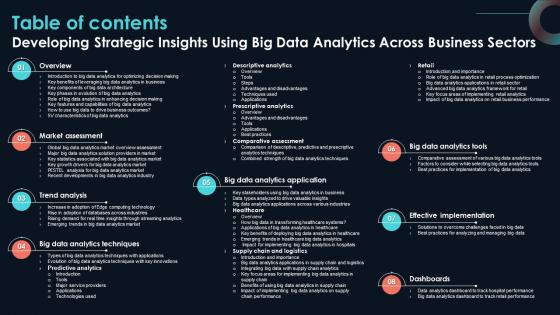
Table Of Contents Developing Strategic Insights Using Big Data Analytics Across Business Sectors
Retrieve professionally designed Table Of Contents Developing Strategic Insights Using Big Data Analytics Across Business Sectors to effectively convey your message and captivate your listeners. Save time by selecting pre-made slideshows that are appropriate for various topics, from business to educational purposes. These themes come in many different styles, from creative to corporate, and all of them are easily adjustable and can be edited quickly. Access them as PowerPoint templates or as Google Slides themes. You do not have to go on a hunt for the perfect presentation because Slidegeeks got you covered from everywhere. Our Table Of Contents Developing Strategic Insights Using Big Data Analytics Across Business Sectors are topically designed to provide an attractive backdrop to any subject. Use them to look like a presentation pro.

Dashboard To Analyze City Ecological And Carbon Footprints Consumption Mockup PDF
This slide illustrates the dashboard to analyze ecological and carbon footprint of a city. The purpose of this template is to provide layout to analyze footprint data and define measures to protect environment. It includes metrics related to carbon emissions, usage of air, water and energy. Showcasing this set of slides titled Dashboard To Analyze City Ecological And Carbon Footprints Consumption Mockup PDF. The topics addressed in these templates are Installing Rooftop Photovoltaic, Using Mass Transport, Composting. All the content presented in this PPT design is completely editable. Download it and make adjustments in color, background, font etc. as per your unique business setting.
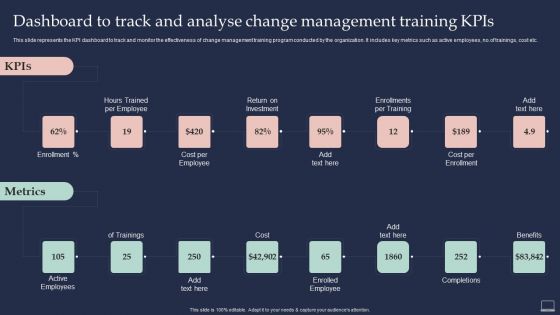
Training Program For Implementing Dashboard To Track And Analyse Change Management Brochure PDF
This slide represents the KPI dashboard to track and monitor the effectiveness of change management training program conducted by the organization. It includes key metrics such as active employees, no.of trainings, cost etc. This Training Program For Implementing Dashboard To Track And Analyse Change Management Brochure PDF is perfect for any presentation, be it in front of clients or colleagues. It is a versatile and stylish solution for organizing your meetings. The Training Program For Implementing Dashboard To Track And Analyse Change Management Brochure PDF features a modern design for your presentation meetings. The adjustable and customizable slides provide unlimited possibilities for acing up your presentation. Slidegeeks has done all the homework before launching the product for you. So, dont wait, grab the presentation templates today.
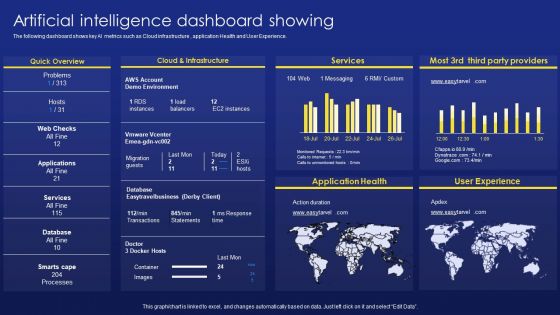
Deployment Procedure Of Hyper Automation Artificial Intelligence Dashboard Showing Pictures PDF
The following dashboard shows key AI metrics such as Cloud infrastructure , application Health and User Experience. Here you can discover an assortment of the finest PowerPoint and Google Slides templates. With these templates, you can create presentations for a variety of purposes while simultaneously providing your audience with an eye catching visual experience. Download Deployment Procedure Of Hyper Automation Artificial Intelligence Dashboard Showing Pictures PDF to deliver an impeccable presentation. These templates will make your job of preparing presentations much quicker, yet still, maintain a high level of quality. Slidegeeks has experienced researchers who prepare these templates and write high quality content for you. Later on, you can personalize the content by editing the Deployment Procedure Of Hyper Automation Artificial Intelligence Dashboard Showing Pictures PDF.
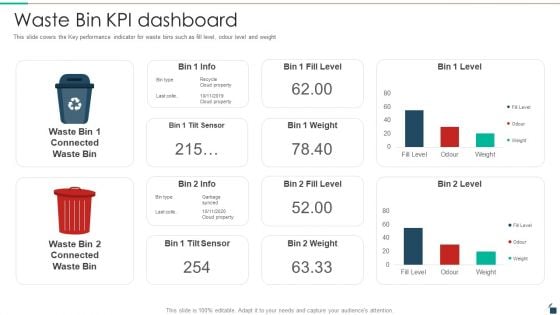
Waste Bin KPI Dashboard Resources Recycling And Waste Management Template PDF
This slide covers the Key performance indicator for waste bins such as fill level, odour level and weight. Deliver an awe inspiring pitch with this creative waste bin kpi dashboard resources recycling and waste management template pdf bundle. Topics like waste bin kpi dashboard can be discussed with this completely editable template. It is available for immediate download depending on the needs and requirements of the user.
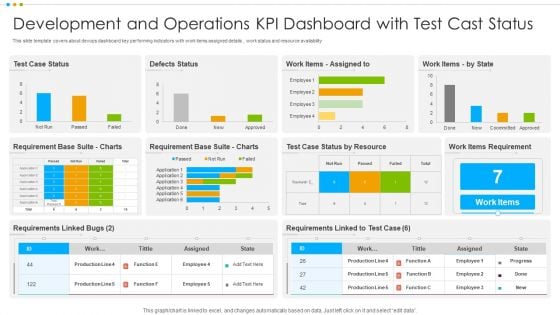
Development And Operations KPI Dashboard With Test Cast Status Graphics PDF
This slide template covers about devops dashboard key performing indicators with work items assigned details , work status and resource availability.Pitch your topic with ease and precision using this Development And Operations KPI Dashboard With Test Cast Status Graphics PDF This layout presents information on Items Requirement, Requirement Base, Assigned It is also available for immediate download and adjustment. So, changes can be made in the color, design, graphics or any other component to create a unique layout.
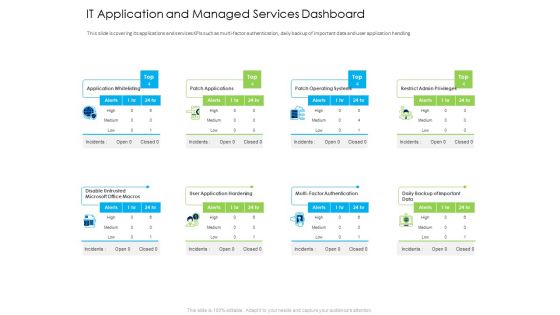
Managed IT Services Pricing Model IT Application And Managed Services Dashboard Clipart PDF
This slide is covering its applications and services KPIs such as multi-factor authentication, daily backup of important data and user application handling. Deliver and pitch your topic in the best possible manner with this managed it services pricing model it application and managed services dashboard clipart pdf. Use them to share invaluable insights on application whitelisting, patch applications, patch operating systems and impress your audience. This template can be altered and modified as per your expectations. So, grab it now.
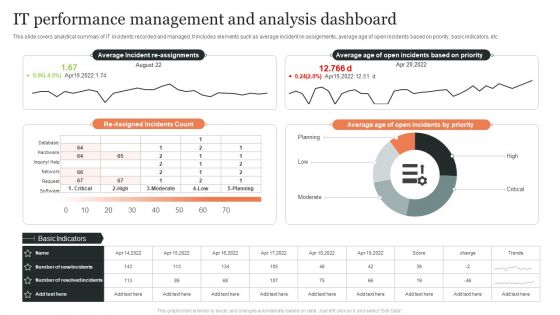
IT Performance Management And Analysis Dashboard Ppt Styles Portrait PDF
This slide covers analytical summary of IT incidents recorded and managed. It includes elements such as average incident re-assignments, average age of open incidents based on priority, basic indicators, etc. Showcasing this set of slides titled IT Performance Management And Analysis Dashboard Ppt Styles Portrait PDF. The topics addressed in these templates are Average Age, Open Incidents Priority, Re Assigned, Incidents Count. All the content presented in this PPT design is completely editable. Download it and make adjustments in color, background, font etc. as per your unique business setting.
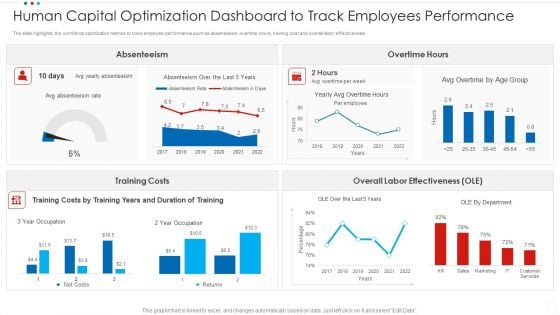
Human Capital Optimization Dashboard To Track Employees Performance Inspiration PDF
The slide highlights the workforce optimization metrics to track employee performance such as absenteeism, overtime hours, training cost and overall labor effectiveness. Pitch your topic with ease and precision using this human capital optimization dashboard to track employees performance inspiration pdf. This layout presents information on training costs, overtime hours, absenteeism. It is also available for immediate download and adjustment. So, changes can be made in the color, design, graphics or any other component to create a unique layout.
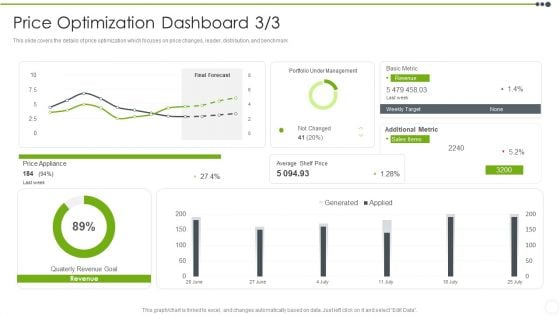
Estimating The Price Price Optimization Dashboard Average Rules PDF
This slide covers the details of price optimization which focuses on price changes, leader, distribution, and benchmark. Deliver an awe inspiring pitch with this creative Estimating The Price Price Optimization Dashboard Average Rules PDF bundle. Topics like Metric, Target, Sales, Average, Price can be discussed with this completely editable template. It is available for immediate download depending on the needs and requirements of the user.
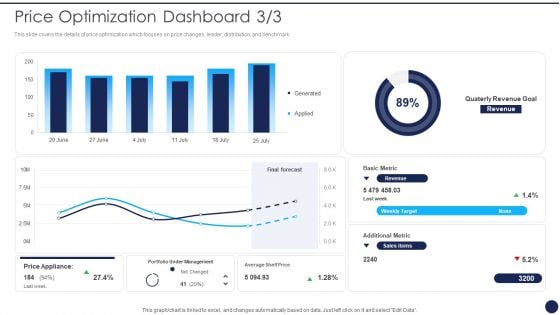
Price Optimization Dashboard Product Pricing Strategies Analysis Mockup PDF
This slide covers the details of price optimization which focuses on price changes, leader, distribution, and benchmark. Deliver an awe inspiring pitch with this creative Price Optimization Dashboard Product Pricing Strategies Analysis Mockup PDF bundle. Topics like Quaterly Revenue Goal, Basic Metric Revenue, Portfolio Under Management can be discussed with this completely editable template. It is available for immediate download depending on the needs and requirements of the user.
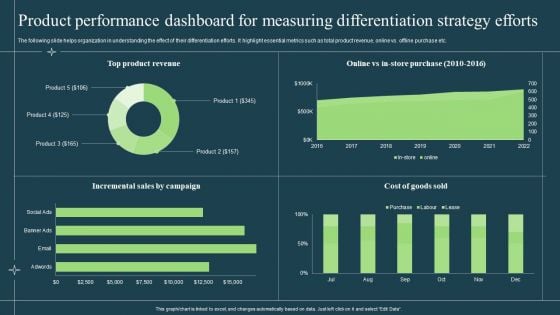
Product Performance Dashboard For Measuring Differentiation Strategy Efforts Diagrams PDF
The following slide helps organization in understanding the effect of their differentiation efforts. It highlight essential metrics such as total product revenue, online vs. offline purchase etc. Deliver an awe inspiring pitch with this creative Product Performance Dashboard For Measuring Differentiation Strategy Efforts Diagrams PDF bundle. Topics like Product, Incremental Sales, Cost Of Goods can be discussed with this completely editable template. It is available for immediate download depending on the needs and requirements of the user.
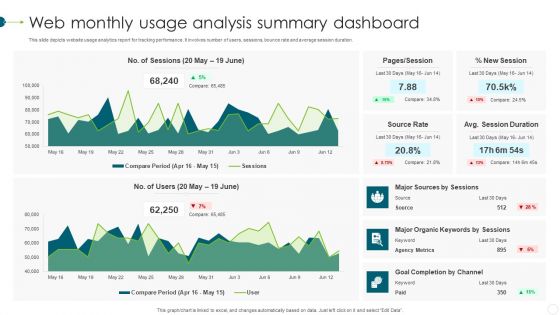
Web Monthly Usage Analysis Summary Dashboard Clipart PDF
This slide depicts website usage analytics report for tracking performance. It involves number of users, sessions, bounce rate and average session duration. Pitch your topic with ease and precision using this Web Monthly Usage Analysis Summary Dashboard Clipart PDF. This layout presents information on Agency Metrics, Source Rate, Goal. It is also available for immediate download and adjustment. So, changes can be made in the color, design, graphics or any other component to create a unique layout.
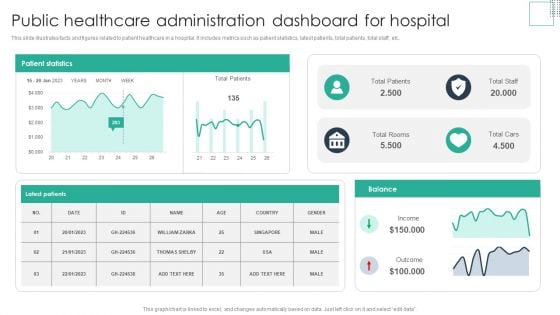
Public Healthcare Administration Dashboard For Hospital Guidelines PDF
This slide illustrates facts and figures related to patient healthcare in a hospital. It includes metrics such as patient statistics, latest patients, total patients, total staff, etc.Pitch your topic with ease and precision using this Public Healthcare Administration Dashboard For Hospital Guidelines PDF. This layout presents information on Total Patients, Total Rooms, Patient Statistics. It is also available for immediate download and adjustment. So, changes can be made in the color, design, graphics or any other component to create a unique layout.
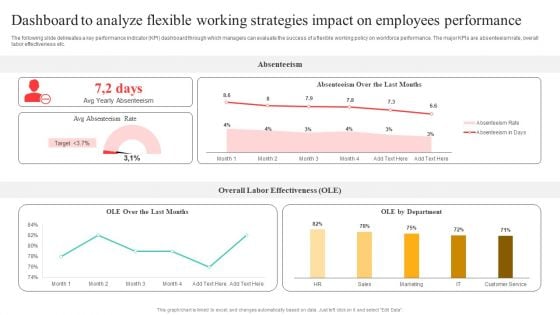
Flexible Working Policies And Guidelines Dashboard To Analyze Flexible Working Strategies Information PDF
The following slide delineates a key performance indicator KPI dashboard through which managers can evaluate the success of a flexible working policy on workforce performance. The major KPIs are absenteeism rate, overall labor effectiveness etc. Create an editable Flexible Working Policies And Guidelines Dashboard To Analyze Flexible Working Strategies Information PDF that communicates your idea and engages your audience. Whether youre presenting a business or an educational presentation, pre designed presentation templates help save time. Flexible Working Policies And Guidelines Dashboard To Analyze Flexible Working Strategies Information PDF is highly customizable and very easy to edit, covering many different styles from creative to business presentations. Slidegeeks has creative team members who have crafted amazing templates. So, go and get them without any delay.
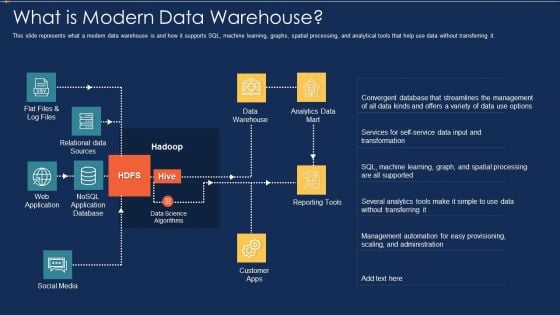
Data Warehousing IT What Is Modern Data Warehouse Ppt Portfolio Gallery PDF
This slide represents what a modern data warehouse is and how it supports SQL, machine learning, graphs, spatial processing, and analytical tools that help use data without transferring it. Deliver an awe inspiring pitch with this creative data warehousing it what is modern data warehouse ppt portfolio gallery pdf bundle. Topics like web application, social media, customer apps, reporting tools, analytics data mart, data warehouse can be discussed with this completely editable template. It is available for immediate download depending on the needs and requirements of the user.
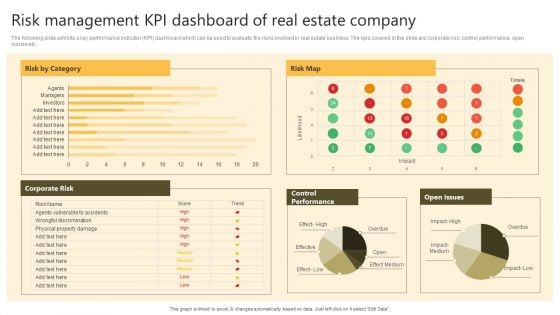
Successful Risk Administration Risk Management Kpi Dashboard Of Real Estate Company Template PDF
The following slide exhibits a key performance indicator KPI dashboard which can be used to evaluate the risks involved in real estate business. The kpis covered in the slide are corporate risk, control performance, open issues etc. This Successful Risk Administration Risk Management Kpi Dashboard Of Real Estate Company Template PDF is perfect for any presentation, be it in front of clients or colleagues. It is a versatile and stylish solution for organizing your meetings. The Successful Risk Administration Risk Management Kpi Dashboard Of Real Estate Company Template PDF features a modern design for your presentation meetings. The adjustable and customizable slides provide unlimited possibilities for acing up your presentation. Slidegeeks has done all the homework before launching the product for you. So, do not wait, grab the presentation templates today.
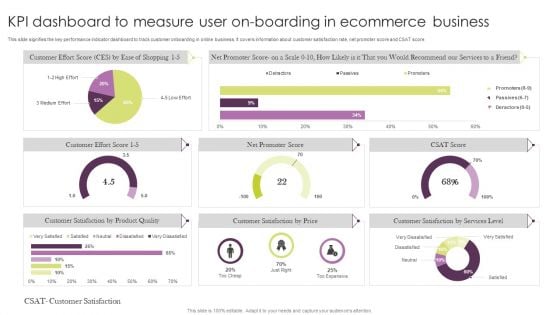
KPI Dashboard To Measure User On Boarding In Ecommerce Business Microsoft PDF
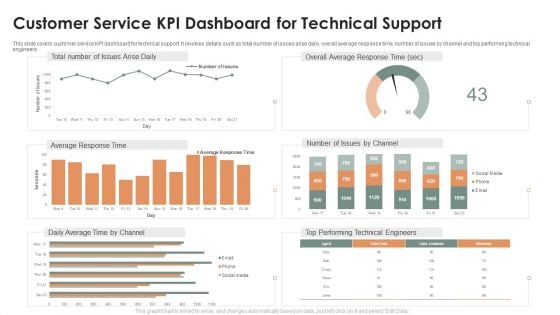
Customer Service KPI Dashboard For Technical Support Ppt Model Vector PDF
This slide covers customer service KPI dashboard for technical support. It involves details such as total number of issues arise daily, overall average response time, number of issues by channel and top performing technical engineers. Pitch your topic with ease and precision using this Customer Service KPI Dashboard For Technical Support Ppt Model Vector PDF. This layout presents information on Overall Average, Response Time, Total Number, Issues Arise Daily. It is also available for immediate download and adjustment. So, changes can be made in the color, design, graphics or any other component to create a unique layout.
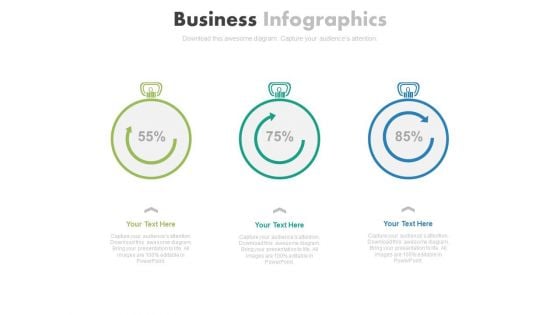
Three Stopwatches For Percentage Growth Powerpoint Slides
Three stopwatches have been displayed in this business slide. This business diagram helps to exhibit parameters of growth and development. Download this PowerPoint template to build an exclusive presentation.
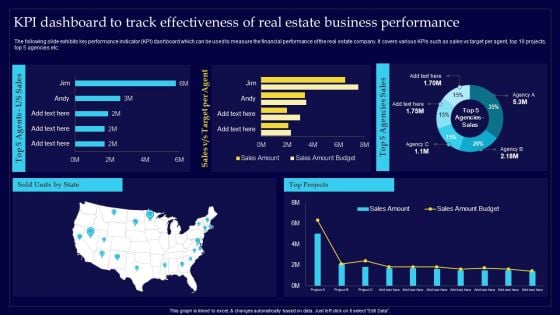
Executing Risk Mitigation KPI Dashboard To Track Effectiveness Of Real Estate Rules PDF
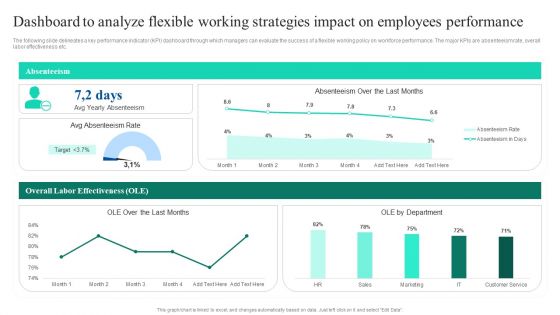
Adopting Flexible Work Policy Dashboard To Analyze Flexible Working Strategies Impact Template PDF
The following slide delineates a key performance indicator KPI dashboard through which managers can evaluate the success of a flexible working policy on workforce performance. The major KPIs are absenteeism rate, overall labor effectiveness etc. Do you have to make sure that everyone on your team knows about any specific topic I yes, then you should give Adopting Flexible Work Policy Dashboard To Analyze Flexible Working Strategies Impact Template PDF a try. Our experts have put a lot of knowledge and effort into creating this impeccable Adopting Flexible Work Policy Dashboard To Analyze Flexible Working Strategies Impact Template PDF. You can use this template for your upcoming presentations, as the slides are perfect to represent even the tiniest detail. You can download these templates from the Slidegeeks website and these are easy to edit. So grab these today.
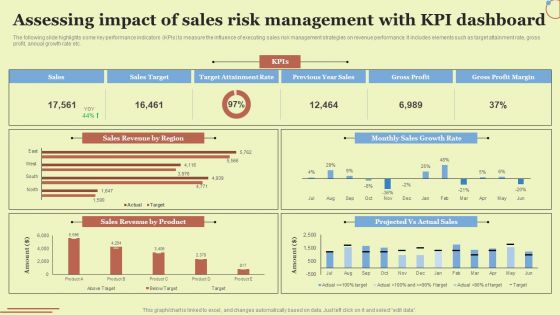
Assessing Impact Of Sales Risk Management With KPI Dashboard Ideas PDF
The following slide highlights some key performance indicators KPIs to measure the influence of executing sales risk management strategies on revenue performance. It includes elements such as target attainment rate, gross profit, annual growth rate etc. Presenting this PowerPoint presentation, titled Assessing Impact Of Sales Risk Management With KPI Dashboard Ideas PDF, with topics curated by our researchers after extensive research. This editable presentation is available for immediate download and provides attractive features when used. Download now and captivate your audience. Presenting this Assessing Impact Of Sales Risk Management With KPI Dashboard Ideas PDF. Our researchers have carefully researched and created these slides with all aspects taken into consideration. This is a completely customizable Assessing Impact Of Sales Risk Management With KPI Dashboard Ideas PDF that is available for immediate downloading. Download now and make an impact on your audience. Highlight the attractive features available with our PPTs.
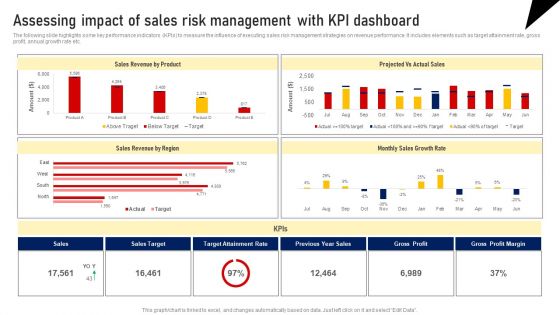
Assessing Impact Of Sales Risk Management With Kpi Dashboard Formats PDF
The following slide highlights some key performance indicators KPIs to measure the influence of executing sales risk management strategies on revenue performance. It includes elements such as target attainment rate, gross profit, annual growth rate etc. Presenting this PowerPoint presentation, titled Assessing Impact Of Sales Risk Management With Kpi Dashboard Formats PDF, with topics curated by our researchers after extensive research. This editable presentation is available for immediate download and provides attractive features when used. Download now and captivate your audience. Presenting this Assessing Impact Of Sales Risk Management With Kpi Dashboard Formats PDF. Our researchers have carefully researched and created these slides with all aspects taken into consideration. This is a completely customizable Assessing Impact Of Sales Risk Management With Kpi Dashboard Formats PDF that is available for immediate downloading. Download now and make an impact on your audience. Highlight the attractive features available with our PPTs.
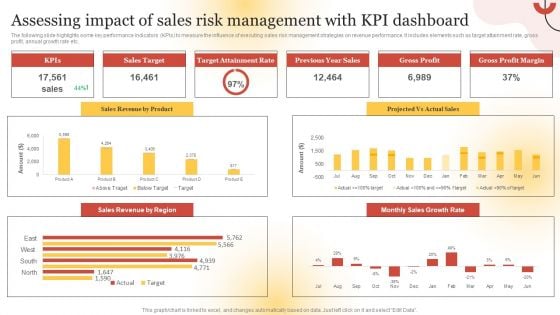
Assessing Impact Of Sales Risk Management With KPI Dashboard Guidelines PDF
The following slide highlights some key performance indicators KPIs to measure the influence of executing sales risk management strategies on revenue performance. It includes elements such as target attainment rate, gross profit, annual growth rate etc. Presenting this PowerPoint presentation, titled Assessing Impact Of Sales Risk Management With KPI Dashboard Guidelines PDF, with topics curated by our researchers after extensive research. This editable presentation is available for immediate download and provides attractive features when used. Download now and captivate your audience. Presenting this Assessing Impact Of Sales Risk Management With KPI Dashboard Guidelines PDF. Our researchers have carefully researched and created these slides with all aspects taken into consideration. This is a completely customizable Assessing Impact Of Sales Risk Management With KPI Dashboard Guidelines PDF that is available for immediate downloading. Download now and make an impact on your audience. Highlight the attractive features available with our PPTs.


 Continue with Email

 Home
Home


