Snapshot
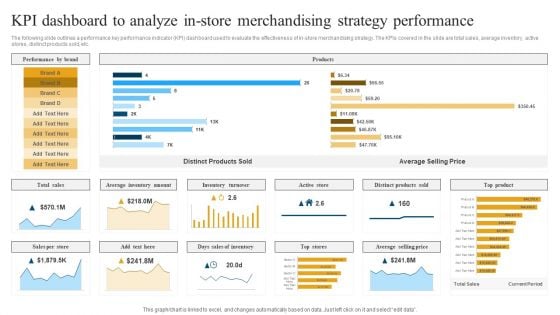
Retail Ecommerce Merchandising Tactics For Boosting Revenue KPI Dashboard To Analyze In Store Merchandising Rules PDF
The following slide outlines a performance key performance indicator KPI dashboard used to evaluate the effectiveness of in-store merchandising strategy. The KPIs covered in the slide are total sales, average inventory, active stores, distinct products sold, etc. Crafting an eye catching presentation has never been more straightforward. Let your presentation shine with this tasteful yet straightforward Retail Ecommerce Merchandising Tactics For Boosting Revenue KPI Dashboard To Analyze In Store Merchandising Rules PDF template. It offers a minimalistic and classy look that is great for making a statement. The colors have been employed intelligently to add a bit of playfulness while still remaining professional. Construct the ideal Retail Ecommerce Merchandising Tactics For Boosting Revenue KPI Dashboard To Analyze In Store Merchandising Rules PDF that effortlessly grabs the attention of your audience. Begin now and be certain to wow your customers.
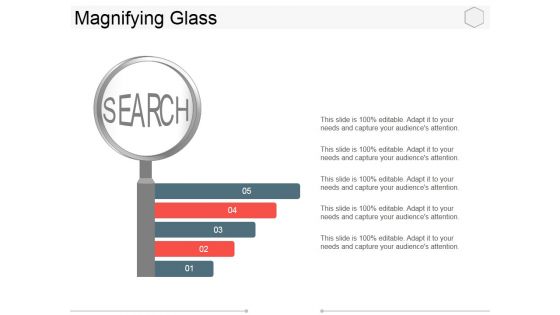
Magnifying Glass Ppt PowerPoint Presentation Pictures Deck
This is a magnifying glass ppt powerpoint presentation pictures deck. This is a five stage process. The stages in this process are search, magnifying glass, analysis, business, marketing.
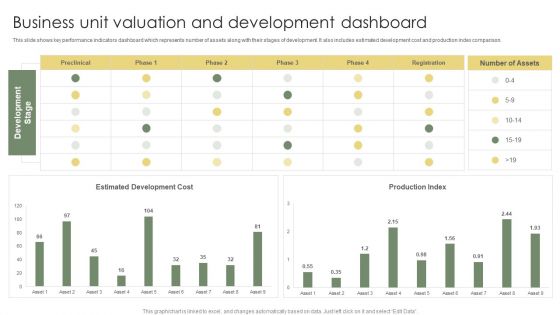
Business Unit Valuation And Development Dashboard Ppt Professional Graphic Tips PDF
This slide shows key performance indicators dashboard which represents number of assets along with their stages of development. It also includes estimated development cost and production index comparison. Pitch your topic with ease and precision using this Business Unit Valuation And Development Dashboard Ppt Professional Graphic Tips PDF. This layout presents information on Estimated Development Cost, Production Index, Development Stage. It is also available for immediate download and adjustment. So, changes can be made in the color, design, graphics or any other component to create a unique layout.
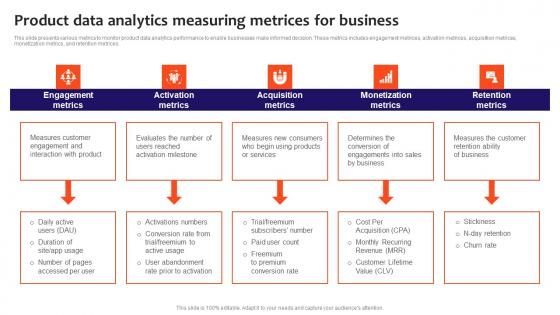
Product Data Analytics Measuring Metrices For Business Ideas Pdf
This slide presents various metrics to monitor product data analytics performance to enable businesses make informed decision. These metrics includes engagement metrices, activation metrices, acquisition metrices, monetization metrics, and retention metrices. Showcasing this set of slides titled Product Data Analytics Measuring Metrices For Business Ideas Pdf. The topics addressed in these templates are Engagement Metrics, Activation Metrics, Acquisition Metrics. All the content presented in this PPT design is completely editable. Download it and make adjustments in color, background, font etc. as per your unique business setting. This slide presents various metrics to monitor product data analytics performance to enable businesses make informed decision. These metrics includes engagement metrices, activation metrices, acquisition metrices, monetization metrics, and retention metrices.
Cost And Purchase Order Procurement Dashboard Icons PDF
This slide provides an overview of the cost and purchase order-related performance indicators to improve efficiency and optimize processes. The dashboard includes the cost of the purchase order, cost reduction, savings, procurement ROI and top 5 suppliers. If you are looking for a format to display your unique thoughts, then the professionally designed Cost And Purchase Order Procurement Dashboard Icons PDF is the one for you. You can use it as a Google Slides template or a PowerPoint template. Incorporate impressive visuals, symbols, images, and other charts. Modify or reorganize the text boxes as you desire. Experiment with shade schemes and font pairings. Alter, share or cooperate with other people on your work. Download Cost And Purchase Order Procurement Dashboard Icons PDF and find out how to give a successful presentation. Present a perfect display to your team and make your presentation unforgettable.
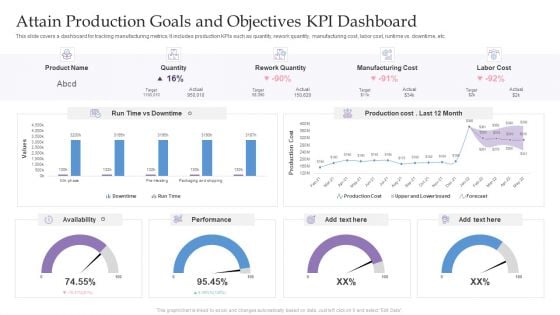
Attain Production Goals And Objectives KPI Dashboard Ppt Pictures Graphics PDF
This slide covers a dashboard for tracking manufacturing metrics. It includes production KPIs such as quantity, rework quantity, manufacturing cost, labor cost, runtime vs. downtime, etc. Showcasing this set of slides titled Attain Production Goals And Objectives KPI Dashboard Ppt Pictures Graphics PDF. The topics addressed in these templates are Product Name, Quantity, Rework Quantity, Manufacturing Cost. All the content presented in this PPT design is completely editable. Download it and make adjustments in color, background, font etc. as per your unique business setting.
Web Consulting Business Various Kpis For Tracking Business Performance
Mentioned slide provide insights into various key performance indicators to determine business performance. It includes KPIs such as business financials, website traffic, customer case, customer engagement, conversion rate, customer retention, customer bounce rate, employee turnover, etc. This modern and well-arranged Web Consulting Business Various Kpis For Tracking Business Performance provides lots of creative possibilities. It is very simple to customize and edit with the Powerpoint Software. Just drag and drop your pictures into the shapes. All facets of this template can be edited with Powerpoint, no extra software is necessary. Add your own material, put your images in the places assigned for them, adjust the colors, and then you can show your slides to the world, with an animated slide included. Mentioned slide provide insights into various key performance indicators to determine business performance. It includes KPIs such as business financials, website traffic, customer case, customer engagement, conversion rate, customer retention, customer bounce rate, employee turnover, etc.
Performance Evaluation KPI Dashboard For 360 Degree Review Icons PDF
This slide covers 360 degree employee feedback dashboard. It includes metrics such as highest rated area, lowest rated area, potential blind spots, peer ratings, self rating, gap analysis, etc. Showcasing this set of slides titled Performance Evaluation KPI Dashboard For 360 Degree Review Icons PDF. The topics addressed in these templates are Highest Rated, Lowest Areas, Potential Spots. All the content presented in this PPT design is completely editable. Download it and make adjustments in color, background, font etc. as per your unique business setting.
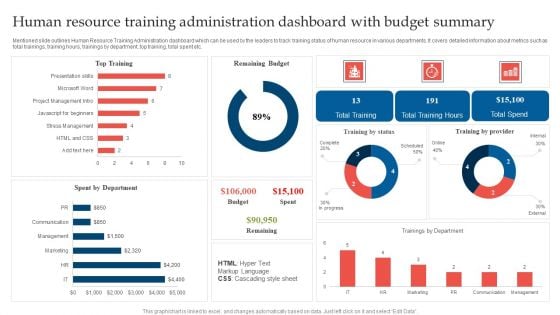
Human Resource Training Administration Dashboard With Budget Summary Microsoft PDF
Mentioned slide outlines Human Resource Training Administration dashboard which can be used by the leaders to track training status of human resource in various departments. It covers detailed information about metrics such as total trainings, training hours, trainings by department, top training, total spent etc. Showcasing this set of slides titled Human Resource Training Administration Dashboard With Budget Summary Microsoft PDF. The topics addressed in these templates are Remaining Budget, Top Training, Spent Department. All the content presented in this PPT design is completely editable. Download it and make adjustments in color, background, font etc. as per your unique business setting.
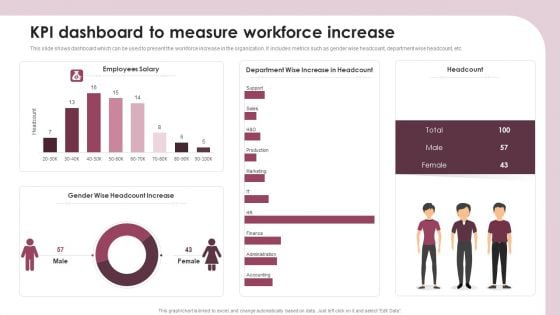
KPI Dashboard To Measure Workforce Increase Ppt Slides Elements PDF
This slide shows dashboard which can be used to present the workforce increase in the organization. It includes metrics such as gender wise headcount, department wise headcount, etc. Showcasing this set of slides titled KPI Dashboard To Measure Workforce Increase Ppt Slides Elements PDF. The topics addressed in these templates are Employees Salary, Headcount, Gender Wise, Headcount Increase. All the content presented in this PPT design is completely editable. Download it and make adjustments in color, background, font etc. as per your unique business setting.
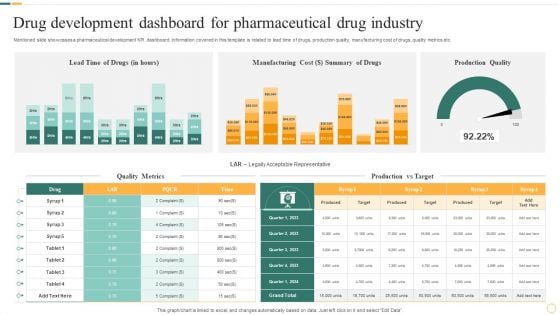
Drug Development Dashboard For Pharmaceutical Drug Industry Portrait PDF
Mentioned slide showcases a pharmaceutical development KPI dashboard. Information covered in this template is related to lead time of drugs, production quality, manufacturing cost of drugs, quality metrics etc. Showcasing this set of slides titled Drug Development Dashboard For Pharmaceutical Drug Industry Portrait PDF. The topics addressed in these templates are Manufacturing Cost, Summary Of Drugs, Production Quality. All the content presented in this PPT design is completely editable. Download it and make adjustments in color, background, font etc. as per your unique business setting.
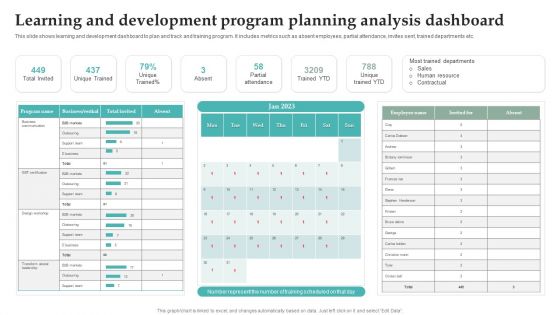
Learning And Development Program Planning Analysis Dashboard Information PDF
This slide shows learning and development dashboard to plan and track and training program. It includes metrics such as absent employees, partial attendance, invites sent, trained departments etc. Showcasing this set of slides titled Learning And Development Program Planning Analysis Dashboard Information PDF. The topics addressed in these templates are Partial Attendance, Trained YTD, Unique Trained YTD. All the content presented in this PPT design is completely editable. Download it and make adjustments in color, background, font etc. as per your unique business setting.

KPI Dashboard To Manage And Track Personnel Administration Summary PDF
This slide shows the dashboard which can be used to monitor performance of employees in an organization. It includes metrics such as headcount, average employee age, gender diversity ratio, absenteeism, etc. Showcasing this set of slides titled KPI Dashboard To Manage And Track Personnel Administration Summary PDF. The topics addressed in these templates are Employee Count Status, Employee Count Department, Employee Count Salary Range. All the content presented in this PPT design is completely editable. Download it and make adjustments in color, background, font etc. as per your unique business setting.
Google Adwords Strategic Campaign Performance Tracking Dashboard Icons PDF
This slide showcases KPI dashboard for real time tracking of performance metrics for google adwords campaign. It includes elements such as cost interactions, impressions, device, etc. Showcasing this set of slides titled Google Adwords Strategic Campaign Performance Tracking Dashboard Icons PDF. The topics addressed in these templates are Campaign Performance Device, Interaction Rate Cost Device, Daily Cost Device. All the content presented in this PPT design is completely editable. Download it and make adjustments in color, background, font etc. as per your unique business setting.
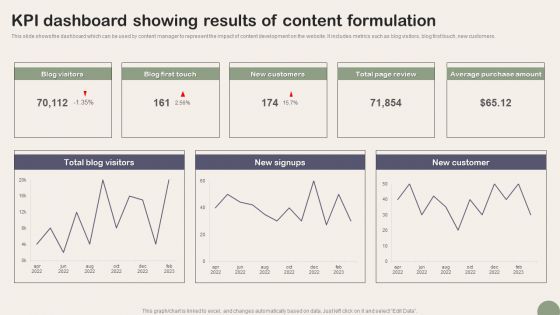
KPI Dashboard Showing Results Of Content Formulation Clipart PDF
This slide shows the dashboard which can be used by content manager to represent the impact of content development on the website. It includes metrics such as blog visitors, blog first touch, new customers. Showcasing this set of slides titled KPI Dashboard Showing Results Of Content Formulation Clipart PDF. The topics addressed in these templates are Blog Visitors, Blog First Touch, New Customers. All the content presented in this PPT design is completely editable. Download it and make adjustments in color, background, font etc. as per your unique business setting.
Facebook Analytics Pixel Marketing Plan Dashboard Professional PDF
This slide exhibits dashboard which offers free point of view for optimization and in-depth analysis of visitors. This template helps in tracking social media and campaigns performance. It involves information related to revenue, age factor, etc. Showcasing this set of slides titled Facebook Analytics Pixel Marketing Plan Dashboard Professional PDF Graphics. The topics addressed in these templates are People Metrics, Lifetime Value, Purchases Repeated. All the content presented in this PPT design is completely editable. Download it and make adjustments in color, background, font etc. as per your unique business setting.
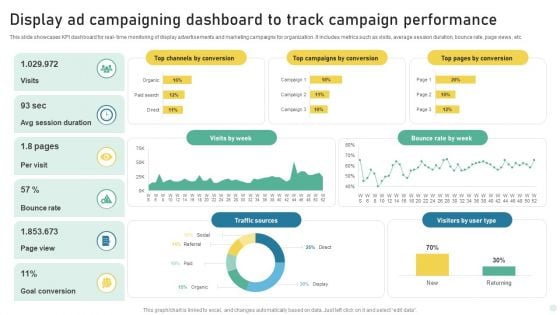
Display Ad Campaigning Dashboard To Track Campaign Performance Background PDF
This slide showcases KPI dashboard for real- time monitoring of display advertisements and marketing campaigns for organization. It includes metrics such as visits, average session duration, bounce rate, page views, etc. Showcasing this set of slides titled Display Ad Campaigning Dashboard To Track Campaign Performance Background PDF. The topics addressed in these templates are Traffic Sources, Bounce Rate, Goal Conversion. All the content presented in this PPT design is completely editable. Download it and make adjustments in color, background, font etc. as per your unique business setting.
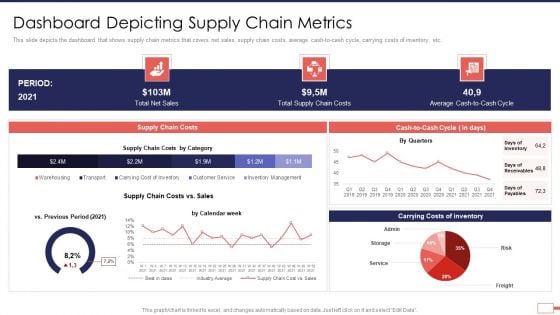
Iot Digital Twin Technology Post Covid Expenditure Management Dashboard Depicting Supply Chain Metrics Sample PDF
This slide depicts the dashboard that shows supply chain metrics that covers net sales, supply chain costs, average cash-to-cash cycle, carrying costs of inventory, etc. Deliver an awe inspiring pitch with this creative iot digital twin technology post covid expenditure management dashboard depicting supply chain metrics sample pdf bundle. Topics like dashboard depicting supply chain metrics can be discussed with this completely editable template. It is available for immediate download depending on the needs and requirements of the user.
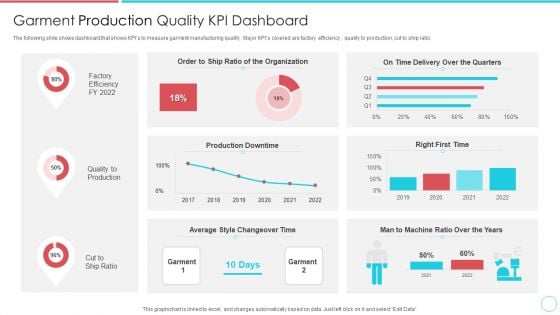
Garment Production Quality KPI Dashboard Portrait PDF
The following slide shows dashboard that shows KPIs to measure garment manufacturing quality . Major KPIs covered are factory efficiency , quality to production, cut to ship ratio.Pitch your topic with ease and precision using this Garment Production Quality KPI Dashboard Portrait PDF This layout presents information on Production Downtime, Time Delivery Over The Quarters, Average Style Changeover Time It is also available for immediate download and adjustment. So, changes can be made in the color, design, graphics or any other component to create a unique layout.
Data Management Platform Dashboard Ppt PowerPoint Presentation Icon Graphics Pictures Cpb Pdf
Presenting this set of slides with name data management platform dashboard ppt powerpoint presentation icon graphics pictures cpb pdf. This is an editable Powerpoint four stages graphic that deals with topics like data management platform dashboard to help convey your message better graphically. This product is a premium product available for immediate download and is 100 percent editable in Powerpoint. Download this now and use it in your presentations to impress your audience.
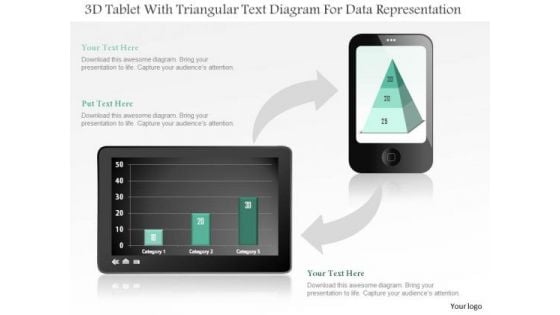
Business Diagram 3d Tablet With Triangular Text Diagram For Data Representation PowerPoint Slide
This business diagram displays bar graph on tablet and pyramid chart on mobile phone. Use this diagram, to make reports for interactive business presentations. Create professional presentations using this diagram.

Revenue Performance Reporting Speedometer Ppt PowerPoint Presentation Visuals
This is a revenue performance reporting speedometer ppt powerpoint presentation visuals. This is a four stage process. The stages in this process are speedometer, measurement, business, marketing, finance.
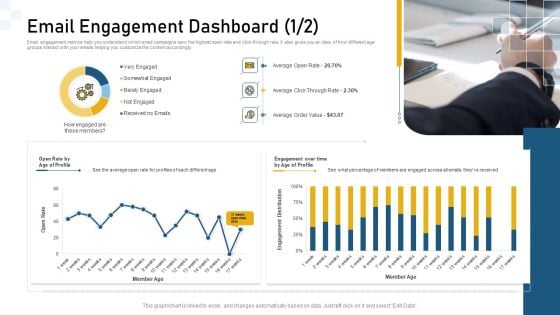
Guidelines Customer Conduct Assessment Email Engagement Dashboard Age Formats PDF
Email engagement metrics help you understand which email campaigns saw the highest open rate and click through rate. It also gives you an idea of how different age groups interact with your emails helping you customize the content accordingly. Deliver an awe-inspiring pitch with this creative guidelines customer conduct assessment email engagement dashboard age formats pdf bundle. Topics like email engagement dashboard can be discussed with this completely editable template. It is available for immediate download depending on the needs and requirements of the user.
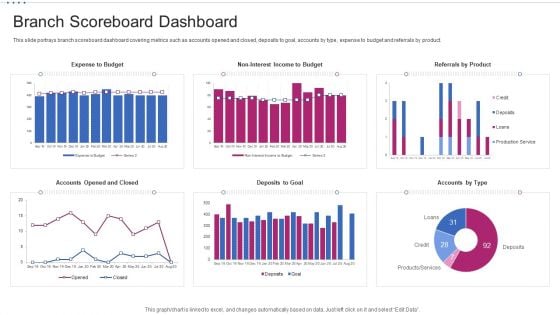
M Banking System Improving Consumer Branch Scoreboard Dashboard Demonstration PDF
This slide portrays branch scoreboard dashboard covering metrics such as accounts opened and closed, deposits to goal, accounts by type, expense to budget and referrals by product. Deliver an awe inspiring pitch with this creative m banking system improving consumer branch scoreboard dashboard demonstration pdf bundle. Topics like expense to budget, no interest income to budget, referrals by product, deposits to goal, accounts opened and closed can be discussed with this completely editable template. It is available for immediate download depending on the needs and requirements of the user.
Salesman Principles Playbook Sales Management Activities Tracking Dashboard Ideas PDF
This slide provides information regarding various metrics catered to track sales team performance in terms of average revenue per account, win rate, NPS, along with sales representative performance tracking through number of opportunities created, lead response time, etc. Deliver and pitch your topic in the best possible manner with this salesman principles playbook sales management activities tracking dashboard ideas pdf Use them to share invaluable insights on sales management activities tracking dashboard and impress your audience. This template can be altered and modified as per your expectations. So, grab it now.
Sales Management Playbook Sales Management Activities Tracking Dashboard Themes PDF
This slide provides information regarding various metrics catered to track sales team performance in terms of average revenue per account, win rate, NPS, along with sales representative performance tracking through number of opportunities created, lead response time, etc. Deliver an awe inspiring pitch with this creative Sales Management Playbook Sales Management Activities Tracking Dashboard Themes PDF bundle. Topics like Sales Management Activities Tracking Dashboard can be discussed with this completely editable template. It is available for immediate download depending on the needs and requirements of the user.
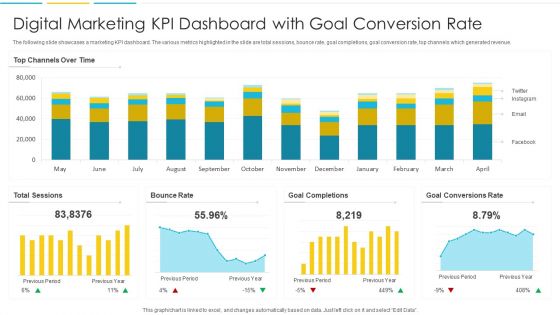
Digital Marketing KPI Dashboard With Goal Conversion Rate Ideas PDF
The following slide showcases a marketing KPI dashboard. The various metrics highlighted in the slide are total sessions, bounce rate, goal completions, goal conversion rate, top channels which generated revenue. Pitch your topic with ease and precision using this Digital Marketing KPI Dashboard With Goal Conversion Rate Ideas PDF. This layout presents information on Rate, Goal, Conversions. It is also available for immediate download and adjustment. So, changes can be made in the color, design, graphics or any other component to create a unique layout.
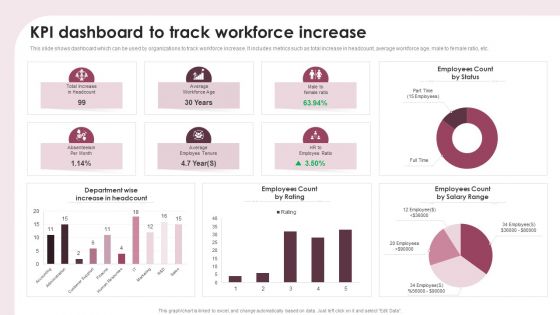
KPI Dashboard To Track Workforce Increase Ppt Show Portfolio PDF
This slide shows dashboard which can be used by organizations to track workforce increase. It includes metrics such as total increase in headcount, average workforce age, male to female ratio, etc. Pitch your topic with ease and precision using this KPI Dashboard To Track Workforce Increase Ppt Show Portfolio PDF. This layout presents information on Department Wise, Increase Headcount, Employees Count Rating. It is also available for immediate download and adjustment. So, changes can be made in the color, design, graphics or any other component to create a unique layout.
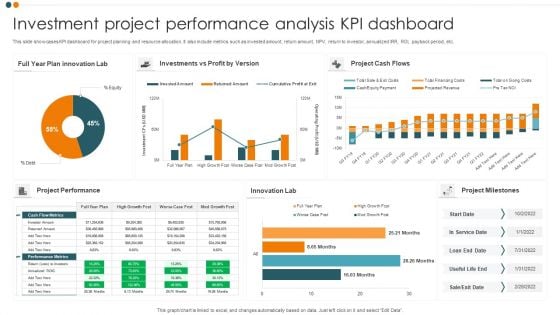
Investment Project Performance Analysis KPI Dashboard Professional PDF
This slide showcases KPI dashboard for project planning and resource allocation. It also include metrics such as invested amount, return amount, NPV, return to investor, annualized IRR, ROI, payback period, etc. Pitch your topic with ease and precision using this Investment Project Performance Analysis KPI Dashboard Professional PDF. This layout presents information on Project Cash Flows, Project Performance, Innovation Lab. It is also available for immediate download and adjustment. So, changes can be made in the color, design, graphics or any other component to create a unique layout.
Monthly Project Investment Expense Tracking KPI Dashboard Themes PDF
This slide showcases KPI dashboard for analysing the variance between billed and budgeted expenses. It also include metrics such as project budget, potential, billed, cost, margin billed vs. budget labour cost, hours details by resources, etc. Pitch your topic with ease and precision using this Monthly Project Investment Expense Tracking KPI Dashboard Themes PDF. This layout presents information on Project Summary, Sales Potential. It is also available for immediate download and adjustment. So, changes can be made in the color, design, graphics or any other component to create a unique layout.
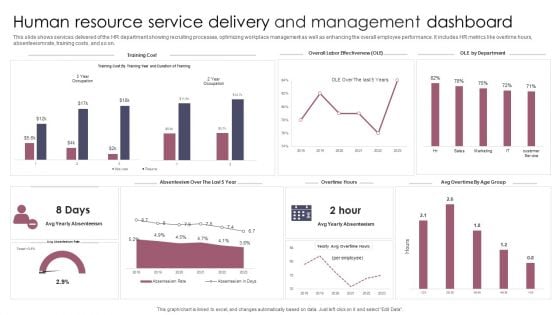
Human Resource Service Delivery And Management Dashboard Information PDF
This slide shows services delivered of the HR department showing recruiting processes, optimizing workplace management as well as enhancing the overall employee performance. It includes HR metrics like overtime hours, absenteeism rate, training costs, and so on. Pitch your topic with ease and precision using this Human Resource Service Delivery And Management Dashboard Information PDF. This layout presents information on Human Resource Service Delivery, Management Dashboard. It is also available for immediate download and adjustment. So, changes can be made in the color, design, graphics or any other component to create a unique layout.
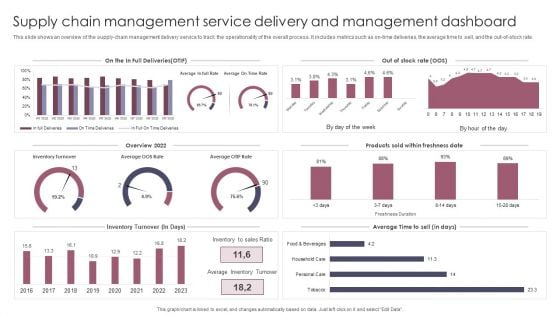
Supply Chain Management Service Delivery And Management Dashboard Guidelines PDF
This slide shows an overview of the supply chain management delivery service to track the operationality of the overall process. It includes metrics such as on time deliveries, the average time to sell, and the out of stock rate. Pitch your topic with ease and precision using this Supply Chain Management Service Delivery And Management Dashboard Guidelines PDF. This layout presents information on Supply Chain Management, Service Delivery, Management Dashboard. It is also available for immediate download and adjustment. So, changes can be made in the color, design, graphics or any other component to create a unique layout.
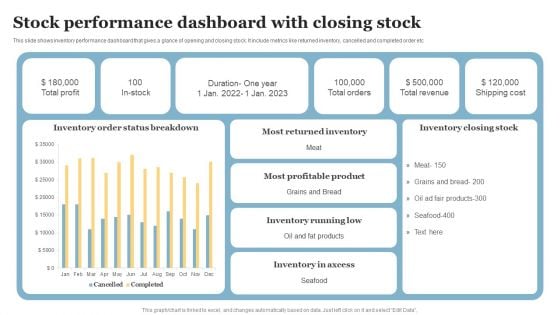
Stock Performance Dashboard With Closing Stock Diagrams PDF
This slide shows inventory performance dashboard that gives a glance of opening and closing stock. It include metrics like returned inventory, cancelled and completed order etc. Pitch your topic with ease and precision using this Stock Performance Dashboard With Closing Stock Diagrams PDF. This layout presents information on Most Returned Inventory, Most Profitable Product, Inventory Running Low. It is also available for immediate download and adjustment. So, changes can be made in the color, design, graphics or any other component to create a unique layout.
Increasing Customer Kpi Dashboard For Tracking Customer Retention Download PDF
This slide covers the dashboard for analyzing customer loyalty with metrics such as NPS, loyal customer rate, premium users, CLV, customer churn, revenue churn, net retention, MRR growth, etc. From laying roadmaps to briefing everything in detail, our templates are perfect for you. You can set the stage with your presentation slides. All you have to do is download these easy-to-edit and customizable templates. Increasing Customer Kpi Dashboard For Tracking Customer Retention Download PDF will help you deliver an outstanding performance that everyone would remember and praise you for. Do download this presentation today.
Project Performance Dashboard With Tracking And Control Phase Background PDF
Following slide exhibits project performance dashboard with monitoring and control phase which can be used by project managers to review the overall project. It includes metrics like project cost performance, project performance, time vs project phase and percentage of project phase completed. Pitch your topic with ease and precision using this Project Performance Dashboard With Tracking And Control Phase Background PDF This layout presents information on Earned Value, Project Cost Performance, Project Performance. It is also available for immediate download and adjustment. So, changes can be made in the color, design, graphics or any other component to create a unique layout.
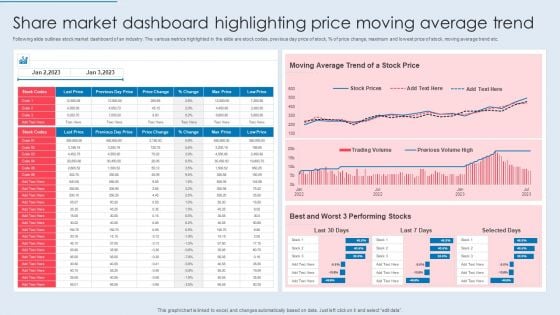
Share Market Dashboard Highlighting Price Moving Average Trend Themes PDF
Following slide outlines stock market dashboard of an industry. The various metrics highlighted in the slide are stock codes, previous day price of stock, percent of price change, maximum and lowest price of stock, moving average trend etc. Pitch your topic with ease and precision using this Share Market Dashboard Highlighting Price Moving Average Trend Themes PDF. This layout presents information on Moving Average, Stock Price, Performing Stocks. It is also available for immediate download and adjustment. So, changes can be made in the color, design, graphics or any other component to create a unique layout.
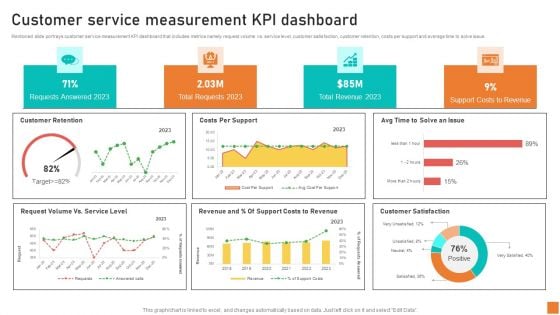
Customer Service Measurement KPI Dashboard Ppt Infographics Themes PDF
Mentioned slide portrays customer service measurement KPI dashboard that includes metrics namely request volume vs. service level, customer satisfaction, customer retention, costs per support and average time to solve issue. If your project calls for a presentation, then Slidegeeks is your go-to partner because we have professionally designed, easy-to-edit templates that are perfect for any presentation. After downloading, you can easily edit Customer Service Measurement KPI Dashboard Ppt Infographics Themes PDF and make the changes accordingly. You can rearrange slides or fill them with different images. Check out all the handy templates
KPI Dashboard For Tracking Customer Retention Infographics PDF
This slide covers the dashboard for analyzing customer loyalty with metrics such as NPS, loyal customer rate, premium users, CLV, customer churn, revenue churn, net retention, MRR growth, etc. Slidegeeks is one of the best resources for PowerPoint templates. You can download easily and regulate KPI Dashboard For Tracking Customer Retention Infographics PDF for your personal presentations from our wonderful collection. A few clicks is all it takes to discover and get the most relevant and appropriate templates. Use our Templates to add a unique zing and appeal to your presentation and meetings. All the slides are easy to edit and you can use them even for advertisement purposes.
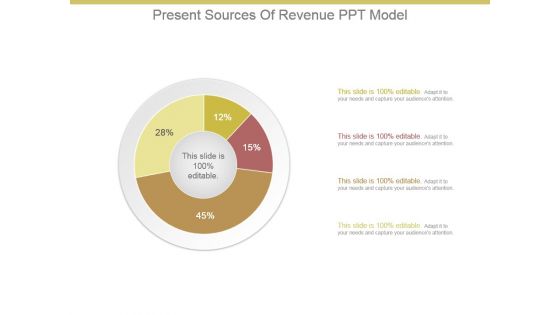
Present Sources Of Revenue Ppt Model
This is a present sources of revenue ppt model. This is a four stage process. The stages in this process are business, marketing, donut, percentage, management.

Sales Team Performance Meter Ppt PowerPoint Presentation Diagrams
This is a sales team performance meter ppt powerpoint presentation diagrams. This is a five stage process. The stages in this process are business, meter, speed, time, sales.
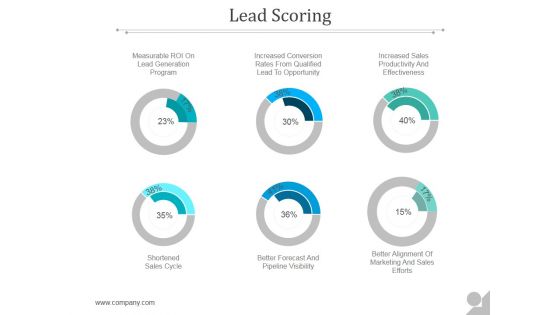
Lead Scoring Ppt PowerPoint Presentation Background Designs
This is a lead scoring ppt powerpoint presentation background designs. This is a six stage process. The stages in this process are business, marketing, success, presentation, management.
Contact Details Ppt Powerpoint Presentation File Outfit
This is a contact details ppt powerpoint presentation file outfit. This is a three stage process. The stages in this process are business, management, planning, strategy, marketing.
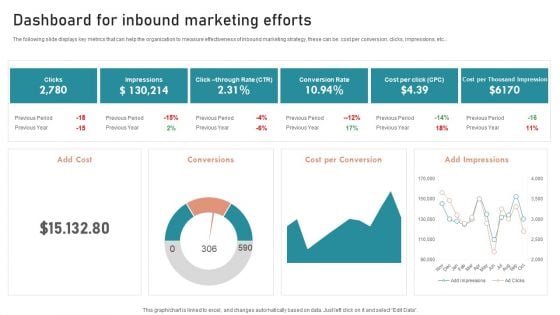
B2B And B2C Startups Marketing Mix Strategies Dashboard For Inbound Marketing Efforts Pictures PDF
The following slide displays key metrics that can help the organization to measure effectiveness of inbound marketing strategy, these can be cost per conversion, clicks, impressions, etc. Create an editable B2B And B2C Startups Marketing Mix Strategies Dashboard For Inbound Marketing Efforts Pictures PDF that communicates your idea and engages your audience. Whether you are presenting a business or an educational presentation, pre designed presentation templates help save time. B2B And B2C Startups Marketing Mix Strategies Dashboard For Inbound Marketing Efforts Pictures PDF is highly customizable and very easy to edit, covering many different styles from creative to business presentations. Slidegeeks has creative team members who have crafted amazing templates. So, go and get them without any delay.
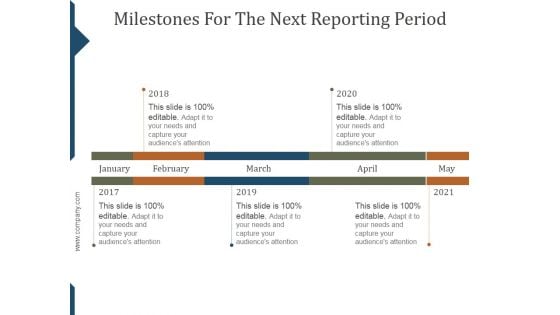
Milestones For The Next Reporting Period Template Ppt PowerPoint Presentation Background Images
This is a milestones for the next reporting period template ppt powerpoint presentation background images. This is a six stage process. The stages in this process are jan, feb, mar, apr, may, jun.
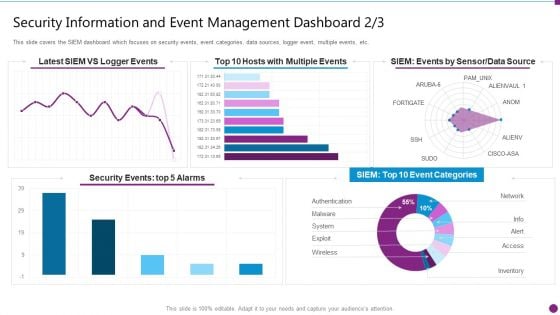
Security Information And Event Management Dashboard Events Ideas PDF
This slide covers the SIEM dashboard which focuses on security events, event categories, data sources, logger event, multiple events, etc. Deliver an awe inspiring pitch with this creative security information and event management dashboard events ideas pdf bundle. Topics like security events, data source, event categories can be discussed with this completely editable template. It is available for immediate download depending on the needs and requirements of the user.
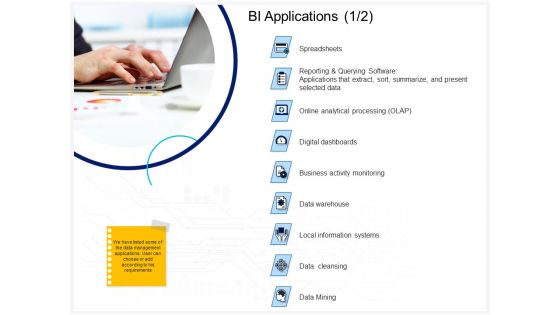
Enterprise Problem Solving And Intellect BI Applications Digital Dashboards Ppt PowerPoint Presentation Infographic Template Design Ideas PDF
Presenting this set of slides with name enterprise problem solving and intellect bi applications digital dashboards ppt powerpoint presentation infographic template design ideas pdf. This is a nine stage process. The stages in this process are data warehouse, data mining, data cleansing, business activity monitoring, digital dashboards, local information systems, online analytical processing, spreadsheets. This is a completely editable PowerPoint presentation and is available for immediate download. Download now and impress your audience.
Eco Friendly And Feasibility Management KPI Metrics And Dashboard Icons PDF
Deliver an awe-inspiring pitch with this creative eco friendly and feasibility management kpi metrics and dashboard icons pdf. bundle. Topics like kpi metrics, dashboard can be discussed with this completely editable template. It is available for immediate download depending on the needs and requirements of the user.
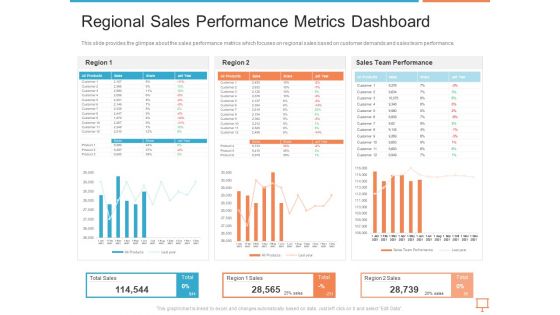
Summary Of Regional Marketing Strategy Regional Sales Performance Metrics Dashboard Diagrams PDF
Deliver and pitch your topic in the best possible manner with this summary of regional marketing strategy regional sales performance metrics dashboard diagrams pdf. Use them to share invaluable insights on regional sales performance metrics dashboard and impress your audience. This template can be altered and modified as per your expectations. So, grab it now.
Manager Checking Campaign Dashboard To Track Product Promotion Kpis Pictures PDF Slides PDF
Persuade your audience using this Manager Checking Campaign Dashboard To Track Product Promotion Kpis Pictures PDF Slides PDF This PPT design covers three stages, thus making it a great tool to use. It also caters to a variety of topics including Manager Checking Campaign Dashboard To Track Product Promotion Kpis Download this PPT design now to present a convincing pitch that not only emphasizes the topic but also showcases your presentation skills.
Linear Steps Timeline Chart And Icons Powerpoint Slides
This PowerPoint template graphics of linear timeline steps. Download this PPT chart for yearly business performance analysis. This PowerPoint slide is of great help in the business sector to make realistic presentations and provides effective way of presenting your newer thoughts.
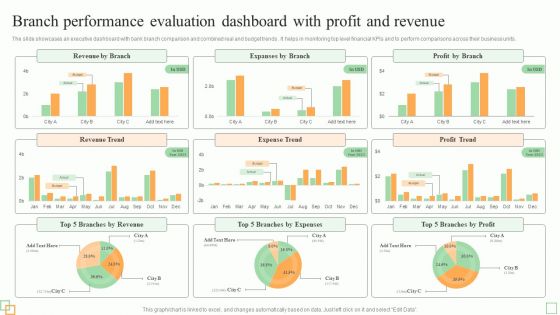
Branch Performance Evaluation Dashboard With Profit And Revenue Diagrams PDF
The slides showcases tips for enhancing branchs workforce performance and efficiency. It covers utilize transaction analysis data, schedule idle time, incent staff for efficiency, get bottom support and use part-time staff.Persuade your audience using this Best Practices To Improve Branch Workforce Performance Evaluation And Efficiency Introduction PDF. This PPT design covers five stages, thus making it a great tool to use. It also caters to a variety of topics including Market Opportunities, Customer Branch, Unnecessary Labor. Download this PPT design now to present a convincing pitch that not only emphasizes the topic but also showcases your presentation skills.

Saas Metrics Dashboard Depicting Content Origin And Session Frequency Formats PDF
Showcasing this set of slides titled Saas Metrics Dashboard Depicting Content Origin And Session Frequency Formats PDF The topics addressed in these templates are Saas Metrics Dashboard Depicting Content Origin And Session Frequency All the content presented in this PPT design is completely editable. Download it and make adjustments in color, background, font etc. as per your unique business setting.
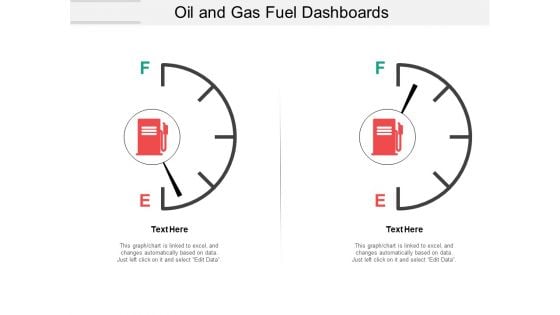
Oil And Gas Fuel Dashboards Ppt PowerPoint Presentation File Introduction
This is a oil and gas fuel dashboards ppt powerpoint presentation file introduction. This is a two stage process. The stages in this process are fuel gauge, gas gauge, fuel containers.
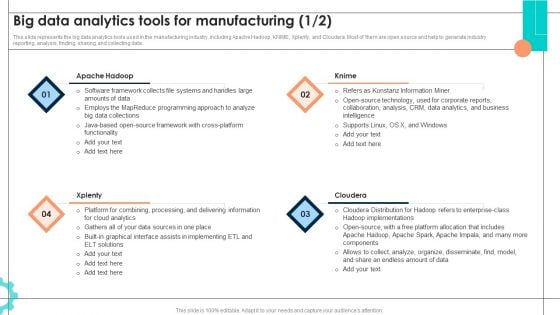
Intelligent Manufacturing Big Data Analytics Tools For Manufacturing Slides PDF
This slide represents the big data analytics tools used in the manufacturing industry, including Apache Hadoop, KNIME, Xplenty, and Cloudera. Most of them are open source and help to generate industry reporting, analysis, finding, sharing, and collecting data. Do you have to make sure that everyone on your team knows about any specific topic I yes, then you should give Intelligent Manufacturing Big Data Analytics Tools For Manufacturing Slides PDF a try. Our experts have put a lot of knowledge and effort into creating this impeccable Intelligent Manufacturing Big Data Analytics Tools For Manufacturing Slides PDF. You can use this template for your upcoming presentations, as the slides are perfect to represent even the tiniest detail. You can download these templates from the Slidegeeks website and these are easy to edit. So grab these today.
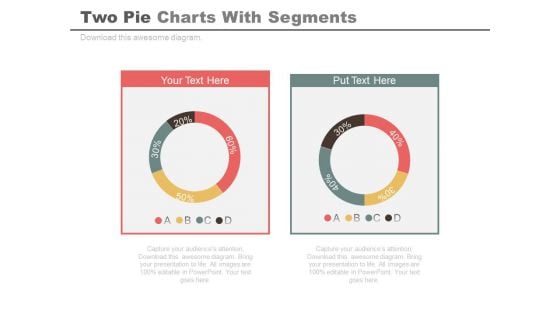
Two Pie Charts For Comparison And Analysis Powerpoint Slides
Develop competitive advantage with our above template of two pie charts. This PowerPoint diagram provides an effective way of displaying business information. You can edit text, color, shade and style as per you need.
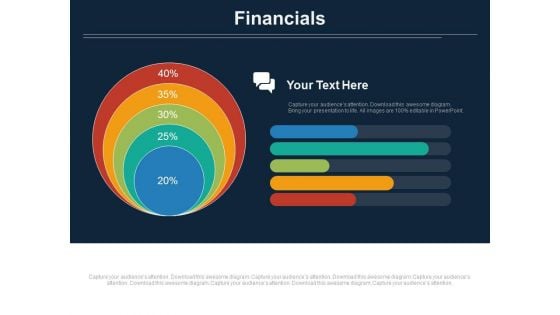
Concentric Chart With Five Financial Steps Powerpoint Slides
This PowerPoint slide contains diagram of concentric chart with five financial steps This professional slide helps to exhibit financial planning for business. Use this PowerPoint template to make impressive presentations.
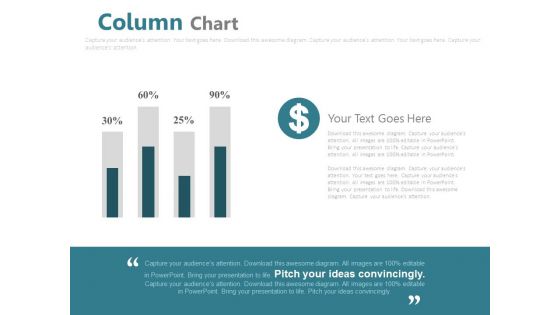
Column Chart For Financial Analysis Powerpoint Slides
This PowerPoint template has been designed with graphics of column chart with percentage values. You may use this business slide design for topics like financial analysis and planning. This PPT slide is powerful tool to describe your ideas.
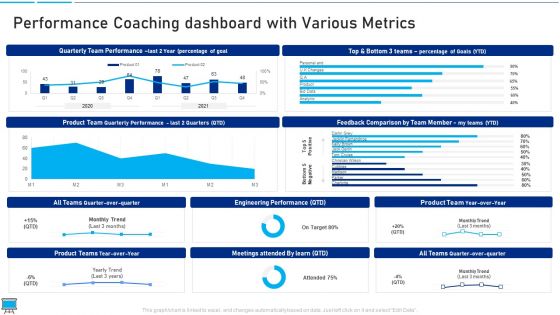
Performance Training Action Plan And Extensive Strategies Performance Coaching Dashboard With Various Metrics Infographics PDF
Deliver an awe inspiring pitch with this creative performance training action plan and extensive strategies performance coaching dashboard with various metrics infographics pdf bundle. Topics like performance coaching dashboard with various metrics can be discussed with this completely editable template. It is available for immediate download depending on the needs and requirements of the user.
Robotic Process Automation Metrics Performance Analysis KPI Dashboard Icon Graphics PDF
Pitch your topic with ease and precision using this Robotic Process Automation Metrics Performance Analysis KPI Dashboard Icon Graphics PDF. This layout presents information on Robotic Process Automation Metrics, Performance Analysis, Kpi Dashboard Icon. It is also available for immediate download and adjustment. So, changes can be made in the color, design, graphics or any other component to create a unique layout.
KPI Dashboard For Tracking Email Marketing Campaign Performance Microsoft PDF
This slide covers the dashboard for analysing email marketing metrics such as overall open rate, click-through rate, click to open ratio, unsubscribe rate, hard bounce rate, soft rate, monthly open rate, total monthly subscribers, etc. Presenting this PowerPoint presentation, titled KPI Dashboard For Tracking Email Marketing Campaign Performance Microsoft PDF, with topics curated by our researchers after extensive research. This editable presentation is available for immediate download and provides attractive features when used. Download now and captivate your audience. Presenting this KPI Dashboard For Tracking Email Marketing Campaign Performance Microsoft PDF. Our researchers have carefully researched and created these slides with all aspects taken into consideration. This is a completely customizable KPI Dashboard For Tracking Email Marketing Campaign Performance Microsoft PDF that is available for immediate downloading. Download now and make an impact on your audience. Highlight the attractive features available with our PPTs.


 Continue with Email

 Home
Home


