Snapshot
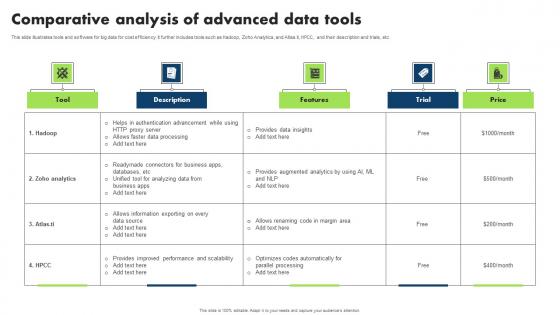
Comparative Analysis Of Advanced Data Tools Template Pdf
This slide illustrates tools and software for big data for cost efficiency. It further includes tools such as Hadoop, Zoho Analytics, and Atlas.ti, HPCC, and their description and trials, etc Showcasing this set of slides titled Comparative Analysis Of Advanced Data Tools Template Pdf. The topics addressed in these templates are Hadoop, Readymade Connectors Business, Unified Tool Analyzing Data. All the content presented in this PPT design is completely editable. Download it and make adjustments in color, background, font etc. as per your unique business setting. This slide illustrates tools and software for big data for cost efficiency. It further includes tools such as Hadoop, Zoho Analytics, and Atlas.ti, HPCC, and their description and trials, etc
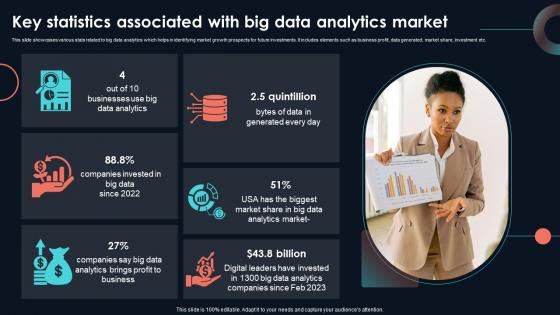
Key Statistics Associated With Big Data Developing Strategic Insights Using Big Data Analytics SS V
This slide showcases various stats related to big data analytics which helps in identifying market growth prospects for future investments. It includes elements such as business profit, data generated, market share, investment etc. If you are looking for a format to display your unique thoughts, then the professionally designed Key Statistics Associated With Big Data Developing Strategic Insights Using Big Data Analytics SS V is the one for you. You can use it as a Google Slides template or a PowerPoint template. Incorporate impressive visuals, symbols, images, and other charts. Modify or reorganize the text boxes as you desire. Experiment with shade schemes and font pairings. Alter, share or cooperate with other people on your work. Download Key Statistics Associated With Big Data Developing Strategic Insights Using Big Data Analytics SS V and find out how to give a successful presentation. Present a perfect display to your team and make your presentation unforgettable. This slide showcases various stats related to big data analytics which helps in identifying market growth prospects for future investments. It includes elements such as business profit, data generated, market share, investment etc.
Robotic Process Automation Metrics Dashboard For Tracking Business Return On Investment Information PDF
This slide illustrates KPI Dashboard for measuring time and money saved after RPA deployment. It also include metrics for analysis such as productivity in robot hours, hours saved per process, money saved per process, etc. Pitch your topic with ease and precision using this Robotic Process Automation Metrics Dashboard For Tracking Business Return On Investment Information PDF. This layout presents information on Management, Goal, Productivity. It is also available for immediate download and adjustment. So, changes can be made in the color, design, graphics or any other component to create a unique layout.
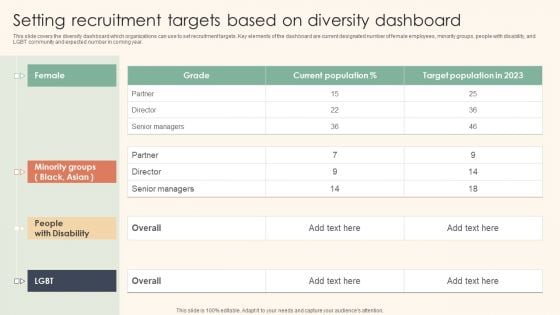
Setting Recruitment Targets Based On Diversity Dashboard Information PDF
This slide covers the diversity dashboard which organizations can use to set recruitment targets. Key elements of the dashboard are current designated number of female employees, minority groups, people with disability, and LGBT community and expected number in coming year. The Setting Recruitment Targets Based On Diversity Dashboard Information PDF is a compilation of the most recent design trends as a series of slides. It is suitable for any subject or industry presentation, containing attractive visuals and photo spots for businesses to clearly express their messages. This template contains a variety of slides for the user to input data, such as structures to contrast two elements, bullet points, and slides for written information. Slidegeeks is prepared to create an impression.
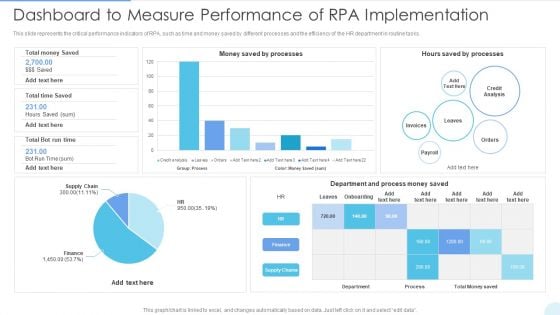
Dashboard To Measure Performance Of RPA Implementation Mockup PDF
This slide represents the critical performance indicators of RPA, such as time and money saved by different processes and the efficiency of the HR department in routine tasks. Deliver and pitch your topic in the best possible manner with this Dashboard To Measure Performance Of RPA Implementation Mockup PDF. Use them to share invaluable insights on Credit Analysis, Department And Process and impress your audience. This template can be altered and modified as per your expectations. So, grab it now.
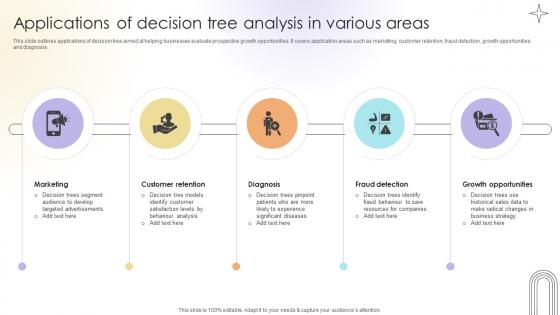
Applications Of Decision Tree Analysis In Various Areas Data Analytics SS V
This slide outlines applications of decision tree aimed at helping businesses evaluate prospective growth opportunities. It covers application areas such as marketing, customer retention, fraud detection, growth opportunities and diagnosis.Get a simple yet stunning designed Applications Of Decision Tree Analysis In Various Areas Data Analytics SS V. It is the best one to establish the tone in your meetings. It is an excellent way to make your presentations highly effective. So, download this PPT today from Slidegeeks and see the positive impacts. Our easy-to-edit Applications Of Decision Tree Analysis In Various Areas Data Analytics SS V can be your go-to option for all upcoming conferences and meetings. So, what are you waiting for Grab this template today. This slide outlines applications of decision tree aimed at helping businesses evaluate prospective growth opportunities. It covers application areas such as marketing, customer retention, fraud detection, growth opportunities and diagnosis.
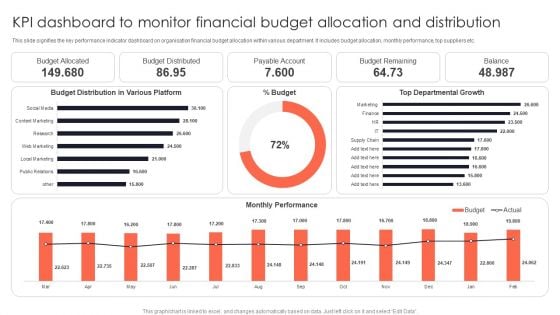
KPI Dashboard To Monitor Financial Budget Allocation And Distribution Portrait PDF
This slide signifies the key performance indicator dashboard on organisation financial budget allocation within various department. It includes budget allocation, monthly performance, top suppliers etc.Deliver an awe inspiring pitch with this creative KPI Dashboard To Monitor Financial Budget Allocation And Distribution Portrait PDF bundle. Topics like Budget Allocated, Budget Distributed, Payable Account can be discussed with this completely editable template. It is available for immediate download depending on the needs and requirements of the user.
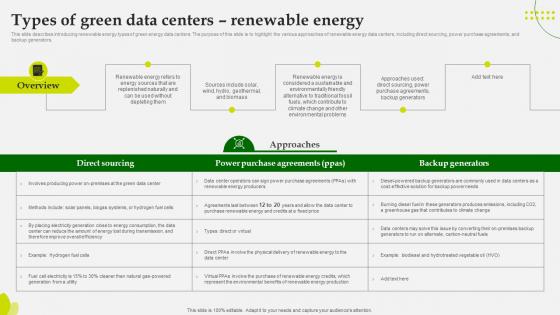
Green Computing Types Of Green Data Centers Renewable Energy
This slide describes introducing renewable energy types of green energy data centers. The purpose of this slide is to highlight the various approaches of renewable energy data centers, including direct sourcing, power purchase agreements, andbackup generators. If your project calls for a presentation, then Slidegeeks is your go-to partner because we have professionally designed, easy-to-edit templates that are perfect for any presentation. After downloading, you can easily edit Green Computing Types Of Green Data Centers Renewable Energy and make the changes accordingly. You can rearrange slides or fill them with different images. Check out all the handy templates This slide describes introducing renewable energy types of green energy data centers. The purpose of this slide is to highlight the various approaches of renewable energy data centers, including direct sourcing, power purchase agreements, andbackup generators.
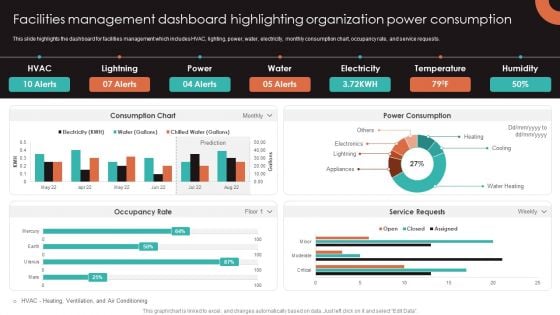
Facilities Management Dashboard Highlighting Organization Power Consumption Background PDF
This slide highlights the dashboard for facilities management which includes HVAC, lighting, power, water, electricity, monthly consumption chart, occupancy rate, and service requests. This Facilities Management Dashboard Highlighting Organization Power Consumption Background PDF from Slidegeeks makes it easy to present information on your topic with precision. It provides customization options, so you can make changes to the colors, design, graphics, or any other component to create a unique layout. It is also available for immediate download, so you can begin using it right away. Slidegeeks has done good research to ensure that you have everything you need to make your presentation stand out. Make a name out there for a brilliant performance.
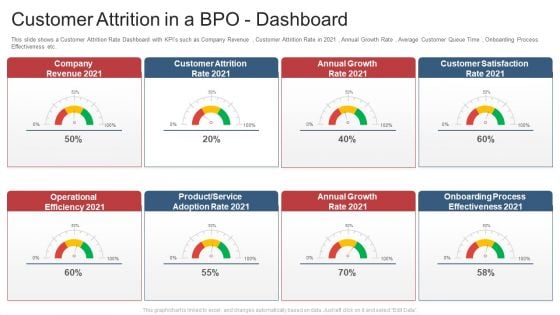
Customer Attrition In A Bpo Dashboard Ppt Model Ideas PDF
Deliver and pitch your topic in the best possible manner with this customer attrition in a bpo dashboard ppt model ideas pdf. Use them to share invaluable insights on telecom churn overview metrics, customer care call performance, monthly revenue lost and impress your audience. This template can be altered and modified as per your expectations. So, grab it now.
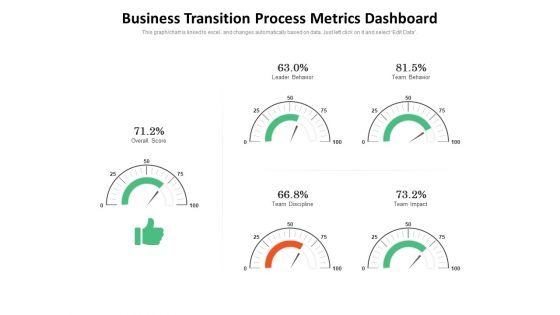
Business Transition Process Metrics Dashboard Ppt PowerPoint Presentation Slides Inspiration PDF
Presenting this set of slides with name business transition process metrics dashboard ppt powerpoint presentation slides inspiration pdf. The topics discussed in these slides are team behavior, leader behavior, team impact, team discipline, overall score. This is a completely editable PowerPoint presentation and is available for immediate download. Download now and impress your audience.
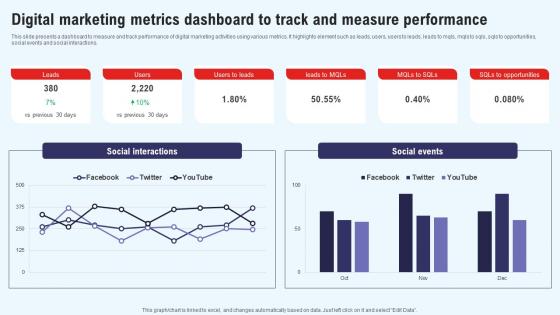
Efficient Marketing Process For Business Digital Marketing Metrics Dashboard To Track Professional Pdf
This slide presents a dashboard to measure and track performance of digital marketing activities using various metrics. It highlights element such as leads, users, users to leads, leads to mqls, mqls to sqls, sqls to opportunities, social events and social interactions. Whether you have daily or monthly meetings, a brilliant presentation is necessary. Efficient Marketing Process For Business Digital Marketing Metrics Dashboard To Track Professional Pdf can be your best option for delivering a presentation. Represent everything in detail using Efficient Marketing Process For Business Digital Marketing Metrics Dashboard To Track Professional Pdf and make yourself stand out in meetings. The template is versatile and follows a structure that will cater to your requirements. All the templates prepared by Slidegeeks are easy to download and edit. Our research experts have taken care of the corporate themes as well. So, give it a try and see the results. This slide presents a dashboard to measure and track performance of digital marketing activities using various metrics. It highlights element such as leads, users, users to leads, leads to mqls, mqls to sqls, sqls to opportunities, social events and social interactions.
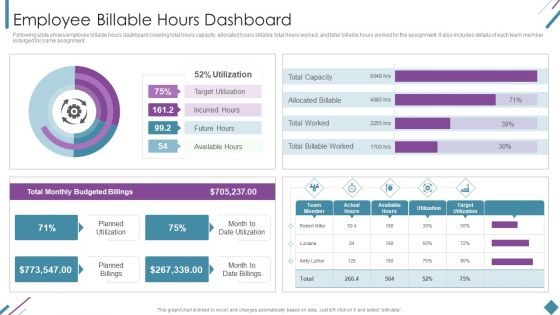
Metrics To Measure Business Performance Employee Billable Hours Dashboard Diagrams PDF
Following slide shows employee billable hours dashboard covering total hours capacity, allocated hours billable, total hours worked, and total billable hours worked for the assignment. It also includes details of each team member indulged for same assignment. Deliver an awe inspiring pitch with this creative Metrics To Measure Business Performance Employee Billable Hours Dashboard Diagrams PDF bundle. Topics like Total Monthly, Budgeted Billings, Planned Utilization can be discussed with this completely editable template. It is available for immediate download depending on the needs and requirements of the user.
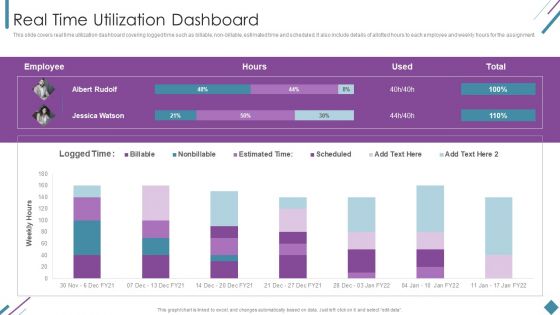
Metrics To Measure Business Performance Real Time Utilization Dashboard Topics PDF
This slide covers real time utilization dashboard covering logged time such as billable, non-billable, estimated time and scheduled. It also include details of allotted hours to each employee and weekly hours for the assignment. Deliver an awe inspiring pitch with this creative Metrics To Measure Business Performance Real Time Utilization Dashboard Topics PDF bundle. Topics like Weekly Hours, Employee, Estimated Time can be discussed with this completely editable template. It is available for immediate download depending on the needs and requirements of the user.
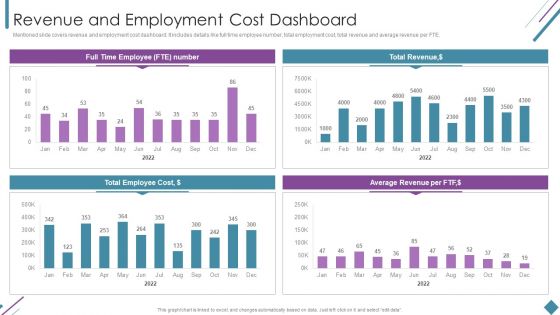
Metrics To Measure Business Performance Revenue And Employment Cost Dashboard Clipart PDF
Mentioned slide covers revenue and employment cost dashboard. It includes details like full time employee number, total employment cost, total revenue and average revenue per FTE. Deliver and pitch your topic in the best possible manner with this Metrics To Measure Business Performance Revenue And Employment Cost Dashboard Clipart PDF. Use them to share invaluable insights on Total Revenue, Average Revenue Per, Total Employee Cost and impress your audience. This template can be altered and modified as per your expectations. So, grab it now.
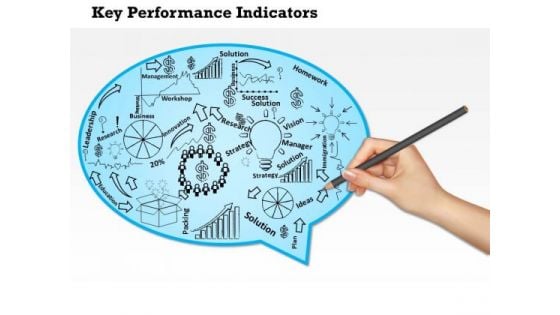
Business Diagram Key Performance Indicators Of A Company PowerPoint Ppt Presentation
Our above diagram provides framework of key performance indicators for a company. This slide contains human hand drawing some objects for terms like innovation strategy, research, solution, management and leadership. Download this diagram to make professional presentations.
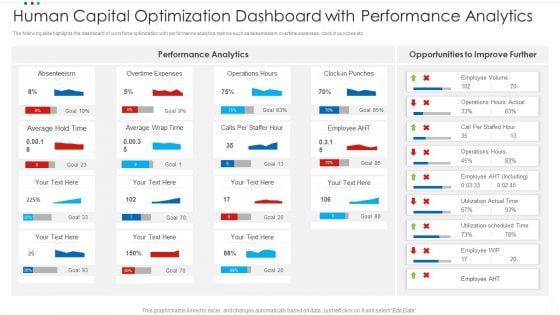
Human Capital Optimization Dashboard With Performance Analytics Infographics PDF
The following slide highlights the dashboard of workforce optimization with performance analytics metrics such as absenteeism, overtime expenses, clock in punches etc. Showcasing this set of slides titled human capital optimization dashboard with performance analytics infographics pdf. The topics addressed in these templates are average, overtime expenses, absenteeism. All the content presented in this PPT design is completely editable. Download it and make adjustments in color, background, font etc. as per your unique business setting.
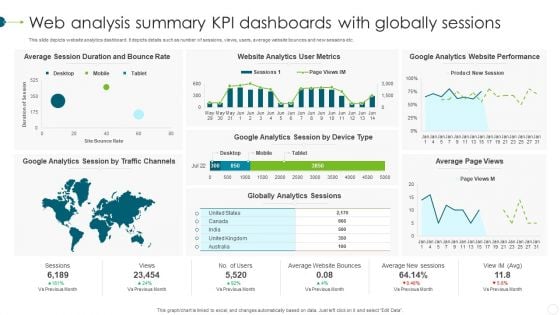
Web Analysis Summary KPI Dashboards With Globally Sessions Mockup PDF
This slide depicts website analytics dashboard. It depicts details such as number of sessions, views, users, average website bounces and new sessions etc. Showcasing this set of slides titled Web Analysis Summary KPI Dashboards With Globally Sessions Mockup PDF. The topics addressed in these templates are Website Analytics, Metrics, Website Performance. All the content presented in this PPT design is completely editable. Download it and make adjustments in color, background, font etc. as per your unique business setting.
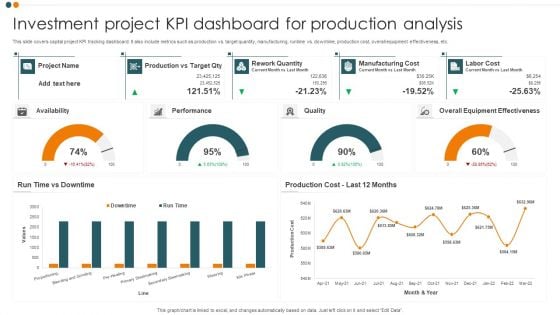
Investment Project KPI Dashboard For Production Analysis Ideas PDF
This slide covers capital project KPI tracking dashboard. It also include metrics such as production vs. target quantity, manufacturing, runtime vs. downtime, production cost, overall equipment effectiveness, etc. Showcasing this set of slides titled Investment Project KPI Dashboard For Production Analysis Ideas PDF. The topics addressed in these templates are Project, Performance, Quality, Overall Equipment Effectiveness. All the content presented in this PPT design is completely editable. Download it and make adjustments in color, background, font etc. as per your unique business setting.
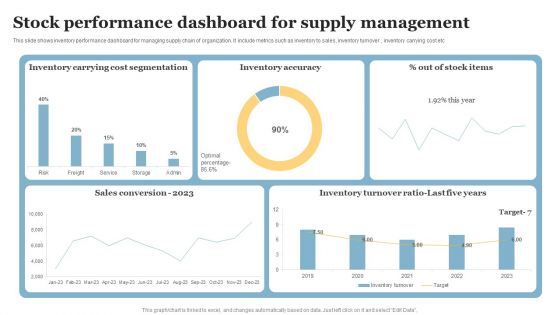
Stock Performance Dashboard For Supply Management Template PDF
This slide shows inventory performance dashboard for managing supply chain of organization. It include metrics such as inventory to sales, inventory turnover , inventory carrying cost etc. Showcasing this set of slides titled Stock Performance Dashboard For Supply Management Template PDF. The topics addressed in these templates are Inventory Carrying, Cost Segmentation, Inventory Accuracy. All the content presented in this PPT design is completely editable. Download it and make adjustments in color, background, font etc. as per your unique business setting.
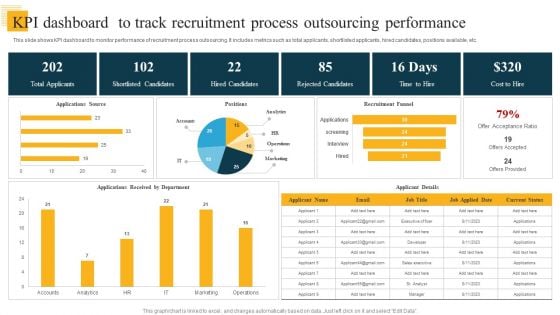
KPI Dashboard To Track Recruitment Process Outsourcing Performance Information PDF
This slide shows KPI dashboard to monitor performance of recruitment process outsourcing. It includes metrics such as total applicants, shortlisted applicants, hired candidates, positions available, etc. Showcasing this set of slides titled KPI Dashboard To Track Recruitment Process Outsourcing Performance Information PDF. The topics addressed in these templates are Shortlisted Candidates, Hired Candidates, Rejected Candidates. All the content presented in this PPT design is completely editable. Download it and make adjustments in color, background, font etc. as per your unique business setting.
E Commerce Transactions Performance Tracking Dashboard Topics PDF
This slide displays KPI dashboard to help company in tracking and monitoring total online purchases made. It includes metrics such as revenue, customers, average price, top articles sold, etc. Showcasing this set of slides titled E Commerce Transactions Performance Tracking Dashboard Topics PDF. The topics addressed in these templates are Total Customers, Division, Revenue. All the content presented in this PPT design is completely editable. Download it and make adjustments in color, background, font etc. as per your unique business setting.
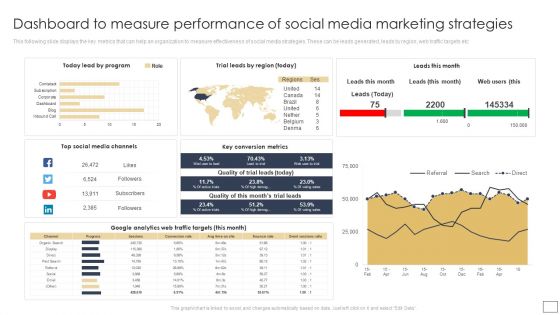
Dashboard To Measure Performance Of Social Media Marketing Strategies Pictures PDF
This following slide displays the key metrics that can help an organization to measure effectiveness of social media strategies. These can be leads generated, leads by region, web traffic targets etc.Slidegeeks is one of the best resources for PowerPoint templates. You can download easily and regulate Dashboard To Measure Performance Of Social Media Marketing Strategies Pictures PDF for your personal presentations from our wonderful collection. A few clicks is all it takes to discover and get the most relevant and appropriate templates. Use our Templates to add a unique zing and appeal to your presentation and meetings. All the slides are easy to edit and you can use them even for advertisement purposes.
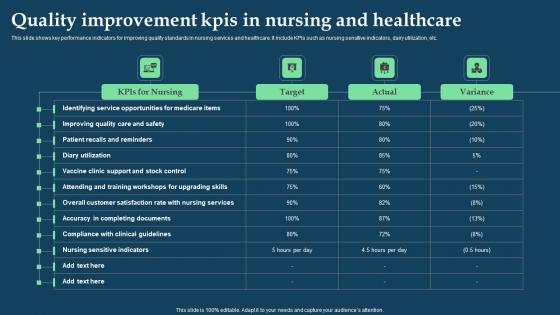
Quality Improvement KPIs In Nursing And Healthcare Portrait Pdf
This slide shows key performance indicators for improving quality standards in nursing services and healthcare. It include KPIs such as nursing sensitive indicators, dairy utilization, etc. Showcasing this set of slides titled Quality Improvement KPIs In Nursing And Healthcare Portrait Pdf. The topics addressed in these templates are Nursing, Target, Actual. All the content presented in this PPT design is completely editable. Download it and make adjustments in color, background, font etc. as per your unique business setting. This slide shows key performance indicators for improving quality standards in nursing services and healthcare. It include KPIs such as nursing sensitive indicators, dairy utilization, etc.
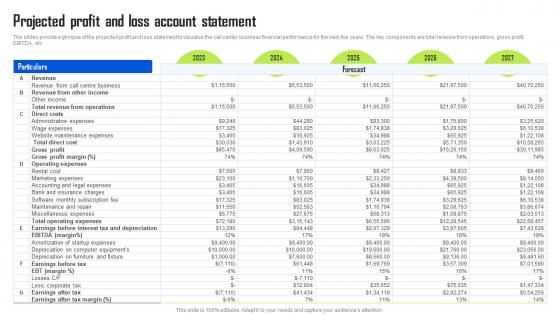
Projected Profit And Loss Account Statement BPO Center Business Plan Summary Pdf
The slides provide a glimpse of the projected profit and loss statement to visualize the call center business financial performance for the next five years. The key components are total revenue from operations, gross profit, EBITDA, etc. Presenting this PowerPoint presentation, titled Projected Profit And Loss Account Statement BPO Center Business Plan Summary Pdf with topics curated by our researchers after extensive research. This editable presentation is available for immediate download and provides attractive features when used. Download now and captivate your audience. Presenting this Projected Profit And Loss Account Statement BPO Center Business Plan Summary Pdf Our researchers have carefully researched and created these slides with all aspects taken into consideration. This is a completely customizable Projected Profit And Loss Account Statement BPO Center Business Plan Summary Pdf that is available for immediate downloading. Download now and make an impact on your audience. Highlight the attractive features available with our PPTs. The slides provide a glimpse of the projected profit and loss statement to visualize the call center business financial performance for the next five years. The key components are total revenue from operations, gross profit, EBITDA, etc.
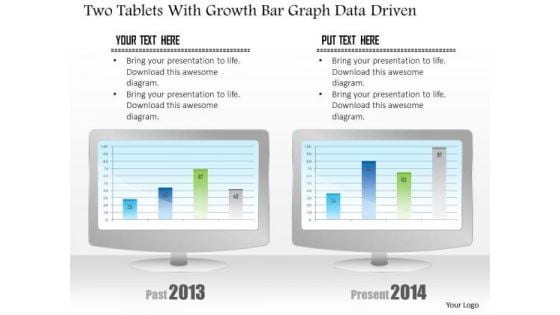
Business Diagram Two Tablets With Growth Bar Graph Data Driven PowerPoint Slide
This business diagram has been designed with comparative charts on tablets. This slide suitable for data representation. You can also use this slide to present business reports and information. Use this diagram to present your views in a wonderful manner.
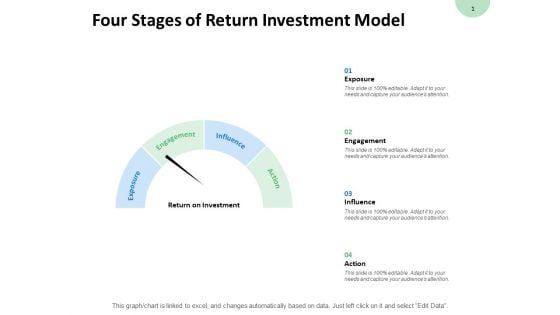
Four Stages Of Return Investment Model Engagement Ppt PowerPoint Presentation Inspiration Layout Ideas
Presenting this set of slides with name four stages of return investment model engagement ppt powerpoint presentation inspiration layout ideas. This is a four stage process. The stages in this process are dashboard, marketing, management, investment, analysis. This is a completely editable PowerPoint presentation and is available for immediate download. Download now and impress your audience.
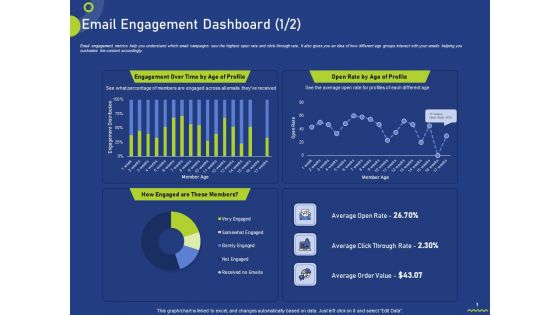
Email Engagement Dashboard Profile Ppt Infographics Images PDF
Email engagement metrics help you understand which email campaigns saw the highest open rate and click-through rate. It also gives you an idea of how different age groups interact with your emails helping you customize the content accordingly. Deliver an awe-inspiring pitch with this creative email engagement dashboard profile ppt infographics images pdf bundle. Topics like email engagement dashboard can be discussed with this completely editable template. It is available for immediate download depending on the needs and requirements of the user.
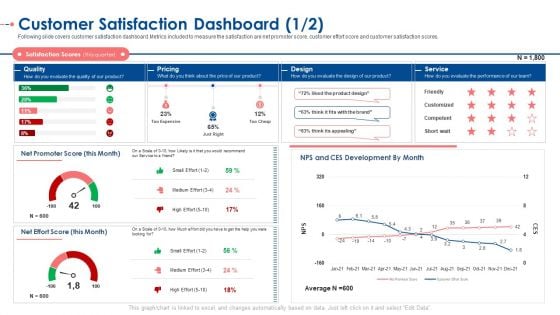
Customer Satisfaction Dashboard Score Ppt Model Infographic Template PDF
Following slide covers customer satisfaction dashboard. Metrics included to measure the satisfaction are net promoter score, customer effort score and customer satisfaction scores. Deliver an awe-inspiring pitch with this creative customer satisfaction dashboard score ppt model infographic template pdf. bundle. Topics like quality, pricing, design, service can be discussed with this completely editable template. It is available for immediate download depending on the needs and requirements of the user.
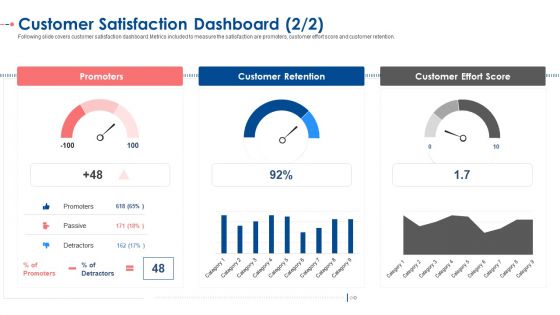
Customer Satisfaction Dashboard Passive Ppt Layouts Themes PDF
Following slide covers customer satisfaction dashboard. Metrics included to measure the satisfaction are promoters, customer effort score and customer retention. Deliver an awe-inspiring pitch with this creative customer satisfaction dashboard passive ppt layouts themes pdf. bundle. Topics like promoters, customer retention, customer effort score can be discussed with this completely editable template. It is available for immediate download depending on the needs and requirements of the user.
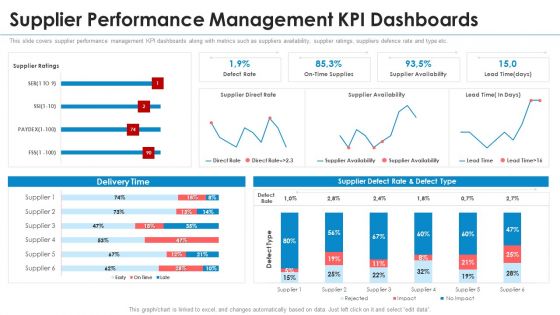
SRM Strategy Supplier Performance Management KPI Dashboards Elements PDF
This slide covers supplier performance management KPI dashboards along with metrics such as suppliers availability, supplier ratings, suppliers defence rate and type etc. Deliver and pitch your topic in the best possible manner with this srm strategy supplier performance management kpi dashboards elements pdf. Use them to share invaluable insights on rate, supplier and impress your audience. This template can be altered and modified as per your expectations. So, grab it now.
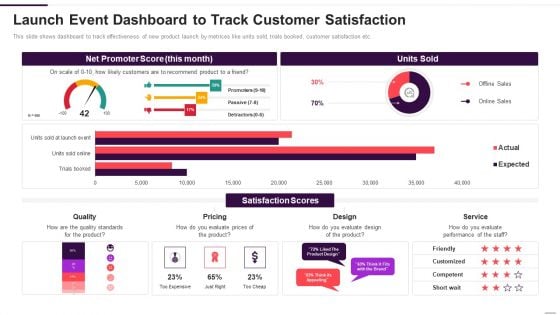
Launch Event Dashboard To Track Customer Satisfaction Brochure PDF
This slide shows dashboard to track effectiveness of new product launch by metrices like units sold, trials booked, customer satisfaction etc. Deliver and pitch your topic in the best possible manner with this launch event dashboard to track customer satisfaction brochure pdf. Use them to share invaluable insights on quality, pricing, design, service and impress your audience. This template can be altered and modified as per your expectations. So, grab it now.
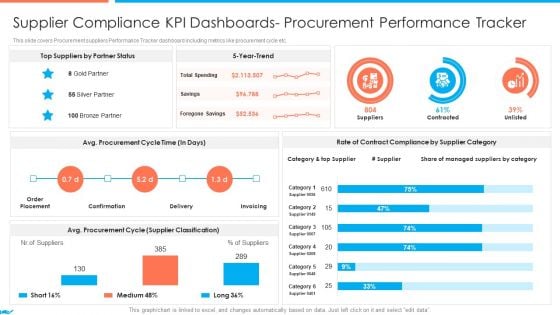
Supplier Association Management Techniques Supplier Compliance Kpi Dashboards Topics PDF
This slide covers procurement suppliers performance Tracker dashboard including metrics like procurement cycle etc. Deliver an awe inspiring pitch with this creative supplier association management techniques supplier compliance kpi dashboards topics pdf bundle. Topics like reduction in costs, increased efficiency, increase in profitability can be discussed with this completely editable template. It is available for immediate download depending on the needs and requirement of the user.
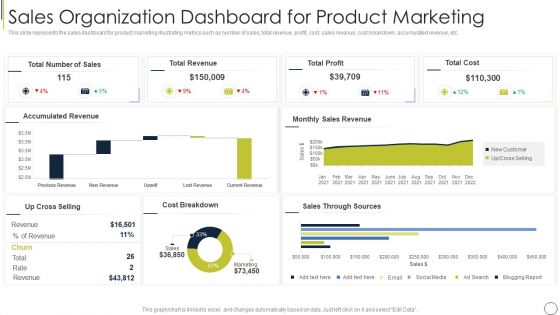
Sales Organization Dashboard For Product Marketing Themes PDF
This slide represents the sales dashboard for product marketing illustrating metrics such as number of sales, total revenue, profit, cost, sales revenue, cost breakdown, accumulated revenue, etc. Pitch your topic with ease and precision using this sales organization dashboard for product marketing themes pdf. This layout presents information on total cost, total profit, total revenue. It is also available for immediate download and adjustment. So, changes can be made in the color, design, graphics or any other component to create a unique layout.
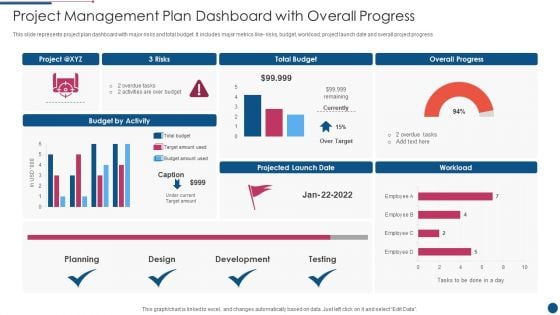
Project Management Plan Dashboard With Overall Progress Professional PDF
This slide represents project plan dashboard with major risks and total budget. It includes major metrics like risks, budget, workload, project launch date and overall project progress. Pitch your topic with ease and precision using this Project Management Plan Dashboard With Overall Progress Professional PDF. This layout presents information on Total Budget, Risks, Development. It is also available for immediate download and adjustment. So, changes can be made in the color, design, graphics or any other component to create a unique layout.
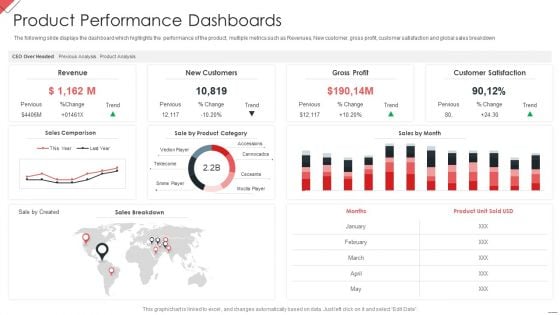
New Commodity Market Viability Review Product Performance Dashboards Guidelines PDF
The following slide displays the dashboard which highlights the performance of the product, multiple metrics such as Revenues, New customer, gross profit, customer satisfaction and global sales breakdown Deliver and pitch your topic in the best possible manner with this New Commodity Market Viability Review Product Performance Dashboards Guidelines PDF Use them to share invaluable insights on Gross Profit, Customer Satisfaction, Product Category and impress your audience. This template can be altered and modified as per your expectations. So, grab it now.
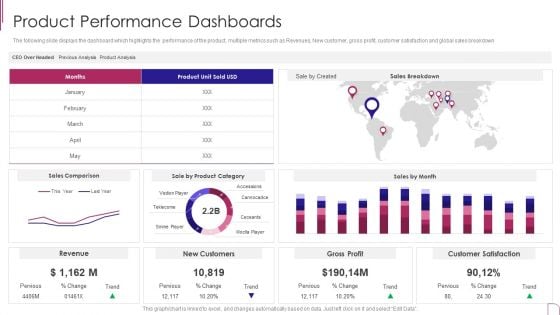
Yearly Product Performance Assessment Repor Product Performance Dashboards Designs PDF
The following slide displays the dashboard which highlights the performance of the product, multiple metrics such as Revenues, New customer, gross profit, customer satisfaction and global sales breakdown.Deliver and pitch your topic in the best possible manner with this Yearly Product Performance Assessment Repor Product Performance Dashboards Designs PDF Use them to share invaluable insights on Gross Profit, Customer Satisfaction, Sales Comparison and impress your audience. This template can be altered and modified as per your expectations. So, grab it now.
Online Customer Interaction Dashboard For Tracking Website Performance Diagrams PDF
This slide covers the KPI dashboard for analyzing the company website. It includes metrics such as conversions, conversion rate, sessions, stickiness, bounce rate, engagement, etc. Deliver an awe inspiring pitch with this creative Online Customer Interaction Dashboard For Tracking Website Performance Diagrams PDF bundle. Topics like Conversions Rate, Conversions, Engagement can be discussed with this completely editable template. It is available for immediate download depending on the needs and requirements of the user.
Online Customer Interaction Loyalty Program Performance Tracking Dashboard Rules PDF
This slide covers the KPI dashboard for analyzing customer loyalty campaign results. It includes metrics such as revenue, liability, NQP accrued, transaction count, members, redemption ratio, etc.Deliver an awe inspiring pitch with this creative Online Customer Interaction Loyalty Program Performance Tracking Dashboard Rules PDF bundle. Topics like Revenue Liability, Transaction Count, Redemption Ratio can be discussed with this completely editable template. It is available for immediate download depending on the needs and requirements of the user.
Online Customer Interaction Referral Program Performance Tracking Dashboard Sample PDF
This slide covers the KPI dashboard for analyzing referral campaign results. It includes metrics such as total revenue generated, monthly recurring revenue, new customers, clicks, cancelled customers, paying customers, etc. Deliver an awe inspiring pitch with this creative Online Customer Interaction Referral Program Performance Tracking Dashboard Sample PDF bundle. Topics like Revenue Generated, Recurring Revenue, Paying Customers can be discussed with this completely editable template. It is available for immediate download depending on the needs and requirements of the user.
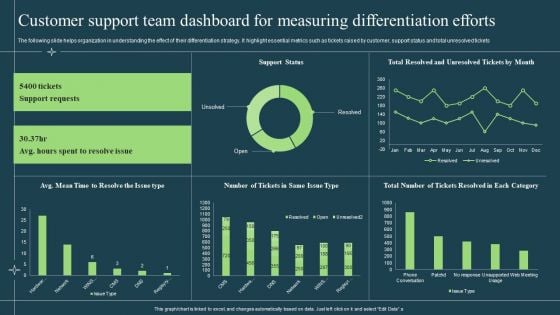
Customer Support Team Dashboard For Measuring Differentiation Efforts Formats PDF
The following slide helps organization in understanding the effect of their differentiation strategy. It highlight essential metrics such as tickets raised by customer, support status and total unresolved tickets. Deliver an awe inspiring pitch with this creative Customer Support Team Dashboard For Measuring Differentiation Efforts Formats PDF bundle. Topics like Customer Support Team Dashboard, Measuring Differentiation Efforts can be discussed with this completely editable template. It is available for immediate download depending on the needs and requirements of the user.
Dashboard For Tracking Digital Content Performance Background PDF
This slide covers the KPI dashboard for analyzing online content. It includes metrics such as blog visitors, pageviews, newsletter conversion rate, new signups, new customers, etc. Deliver and pitch your topic in the best possible manner with this Dashboard For Tracking Digital Content Performance Background PDF. Use them to share invaluable insights on Customers, Purchase, Rate and impress your audience. This template can be altered and modified as per your expectations. So, grab it now.
Online Ad Campaign Performance Tracking Dashboard Formats PDF
This slide covers the KPI dashboard for measuring digital campaign results. It includes metrics such as Ad cost, clicks, impressions, CTR, cost per click, conversions, conversion rate, cost per click, cost per thousand impressions, etc. Deliver an awe inspiring pitch with this creative Online Ad Campaign Performance Tracking Dashboard Formats PDF bundle. Topics like Conversation Rate, Cost Per Conversion can be discussed with this completely editable template. It is available for immediate download depending on the needs and requirements of the user.
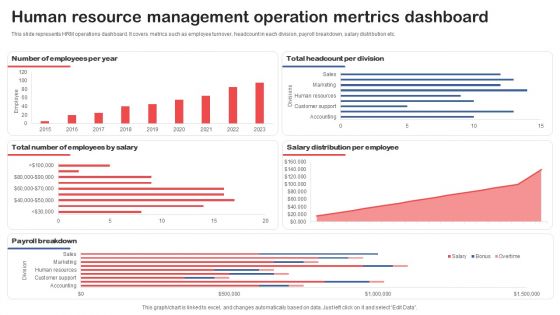
Human Resource Management Operation Mertrics Dashboard Background PDF
This slide represents HRM operations dashboard. It covers metrics such as employee turnover, headcount in each division, payroll breakdown, salary distribution etc. Pitch your topic with ease and precision using thisHuman Resource Management Operation Mertrics Dashboard Background PDF. This layout presents information on Number Of Employees, Headcount Per Division, Employees By Salary. It is also available for immediate download and adjustment. So, changes can be made in the color, design, graphics or any other component to create a unique layout.
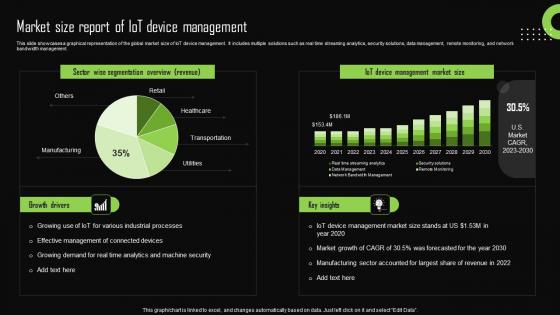
Market Size Report Of Iot Device Management Iot Device Management Demonstration Pdf
This slide showcases a graphical representation of the global market size of IoT device management. It includes multiple solutions such as real time streaming analytics, security solutions, data management, remote monitoring, and network bandwidth management. If you are looking for a format to display your unique thoughts, then the professionally designed Market Size Report Of Iot Device Management Iot Device Management Demonstration Pdf is the one for you. You can use it as a Google Slides template or a PowerPoint template. Incorporate impressive visuals, symbols, images, and other charts. Modify or reorganize the text boxes as you desire. Experiment with shade schemes and font pairings. Alter, share or cooperate with other people on your work. Download Market Size Report Of Iot Device Management Iot Device Management Demonstration Pdf and find out how to give a successful presentation. Present a perfect display to your team and make your presentation unforgettable. This slide showcases a graphical representation of the global market size of IoT device management. It includes multiple solutions such as real time streaming analytics, security solutions, data management, remote monitoring, and network bandwidth management.
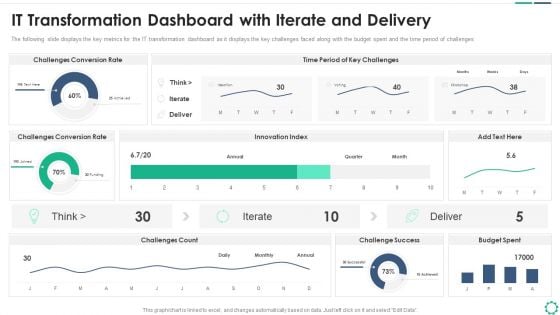
Digitalization Plan For Business Modernization IT Transformation Dashboard With Iterate And Delivery Infographics PDF
The following slide displays the key metrics for the IT transformation dashboard as it displays the key challenges faced along with the budget spent and the time period of challenges. Deliver an awe inspiring pitch with this creative digitalization plan for business modernization it transformation dashboard with iterate and delivery infographics pdf bundle. Topics like challenges conversion rate, innovation index, challenges count, challenge success, budget spent, time period of key challenges can be discussed with this completely editable template. It is available for immediate download depending on the needs and requirements of the user.
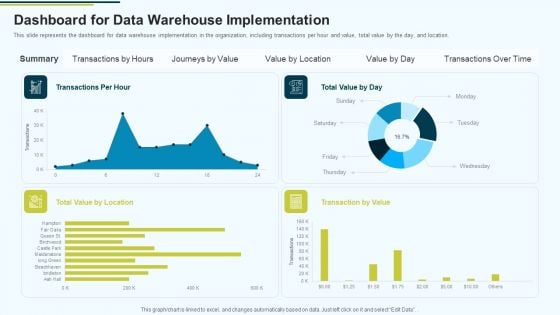
MIS Dashboard For Data Warehouse Implementation Ppt PowerPoint Presentation Pictures Designs PDF
This slide represents the dashboard for data warehouse implementation in the organization, including transactions per hour and value, total value by the day, and location.Deliver and pitch your topic in the best possible manner with this MIS Dashboard For Data Warehouse Implementation Ppt PowerPoint Presentation Pictures Designs PDF Use them to share invaluable insights on Dashboard For Data Warehouse Implementation and impress your audience. This template can be altered and modified as per your expectations. So, grab it now.
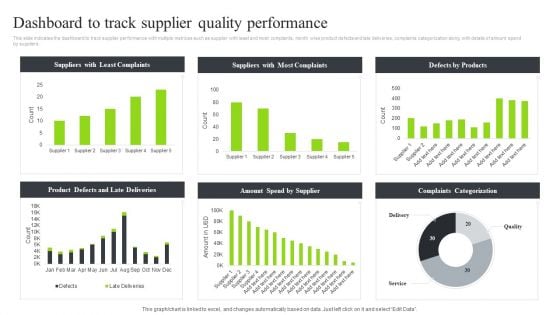
Strategic Sourcing And Supplier Quality Dashboard To Track Supplier Quality Performance Microsoft PDF
This slide indicates the dashboard to track supplier performance with multiple metrices such as supplier with least and most complaints, month wise product defects and late deliveries, complaints categorization along with details of amount spend by suppliers.Slidegeeks has constructed Strategic Sourcing And Supplier Quality Dashboard To Track Supplier Quality Performance Microsoft PDF after conducting extensive research and examination. These presentation templates are constantly being generated and modified based on user preferences and critiques from editors. Here, you will find the most attractive templates for a range of purposes while taking into account ratings and remarks from users regarding the content. This is an excellent jumping-off point to explore our content and will give new users an insight into our top-notch PowerPoint Templates.
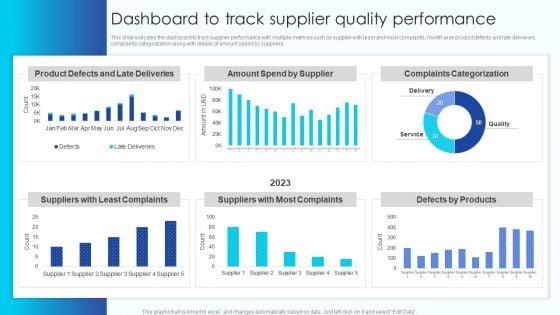
Dashboard To Track Supplier Quality Performance Vendor Management Program For Supplier Infographics PDF
This slide indicates the dashboard to track supplier performance with multiple metrices such as supplier with least and most complaints, month wise product defects and late deliveries, complaints categorization along with details of amount spend by suppliers.Boost your pitch with our creative Dashboard To Track Supplier Quality Performance Vendor Management Program For Supplier Infographics PDF. Deliver an awe-inspiring pitch that will mesmerize everyone. Using these presentation templates you will surely catch everyones attention. You can browse the ppts collection on our website. We have researchers who are experts at creating the right content for the templates. So you do not have to invest time in any additional work. Just grab the template now and use them.
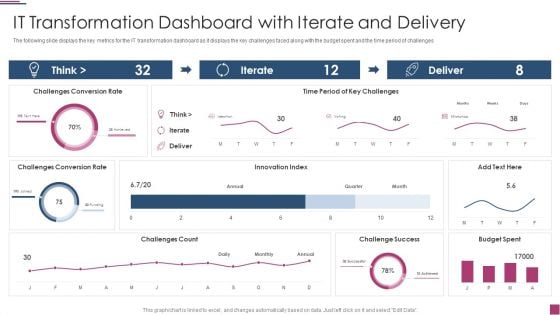
Innovation Procedure For Online Business IT Transformation Dashboard With Iterate And Delivery Infographics PDF
The following slide displays the key metrics for the IT transformation dashboard as it displays the key challenges faced along with the budget spent and the time period of challenges Deliver an awe inspiring pitch with this creative Innovation Procedure For Online Business IT Transformation Dashboard With Iterate And Delivery Infographics PDF bundle. Topics like IT Transformation Dashboard With Iterate And Delivery can be discussed with this completely editable template. It is available for immediate download depending on the needs and requirements of the user.
Devops Frequency And Deployment Performance Dashboard Icons PDF
This template covers DevOps deployment, change in value, lead time customer ticket software performance indicators. Presenting devops frequency and deployment performance dashboard icons pdf to provide visual cues and insights. Share and navigate important information on nine stages that need your due attention. This template can be used to pitch topics like customer, performance. In addtion, this PPT design contains high resolution images, graphics, etc, that are easily editable and available for immediate download.
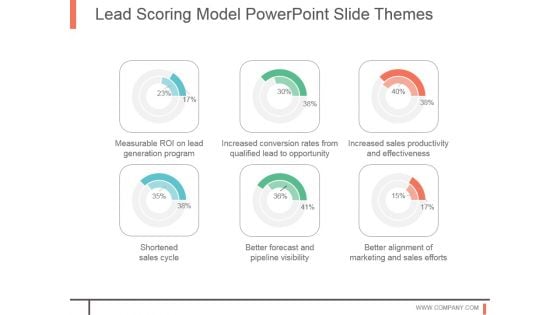
Lead Scoring Model Powerpoint Slide Themes
This is a lead scoring model powerpoint slide themes. This is a six stage process. The stages in this process are measurable roi on lead generation program, increased conversion rates from qualified lead to opportunity, increased sales productivity and effectiveness, shortened sales cycle, better forecast and pipeline visibility, better alignment of marketing and sales efforts.
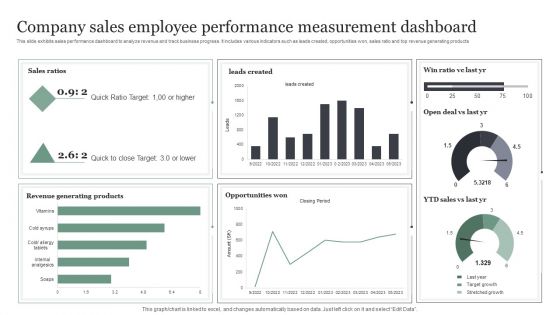
Company Sales Employee Performance Measurement Dashboard Information PDF
This slide exhibits sales performance dashboard to analyze revenue and track business progress. It includes various indicators such as leads created, opportunities won, sales ratio and top revenue generating products. Showcasing this set of slides titled Company Sales Employee Performance Measurement Dashboard Information PDF. The topics addressed in these templates are Quick Ratio Target, Opportunities Won, Revenue Generating Products. All the content presented in this PPT design is completely editable. Download it and make adjustments in color, background, font etc. as per your unique business setting.
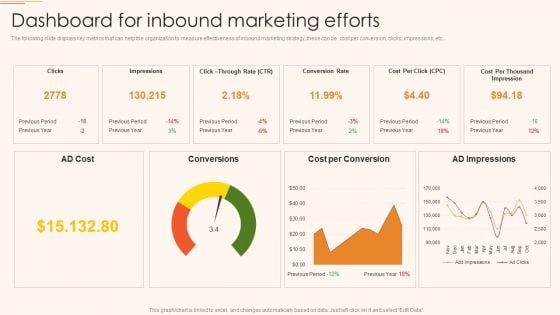
B2C And B2B Business Promotion Strategy Dashboard For Inbound Marketing Efforts Diagrams PDF
The following slide displays key metrics that can help the organization to measure effectiveness of inbound marketing strategy, these can be cost per conversion, clicks, impressions, etc. Deliver an awe inspiring pitch with this creative B2C And B2B Business Promotion Strategy Dashboard For Inbound Marketing Efforts Diagrams PDF bundle. Topics like Conversion Rate, Cost per Conversion, AD Impressions can be discussed with this completely editable template. It is available for immediate download depending on the needs and requirements of the user.
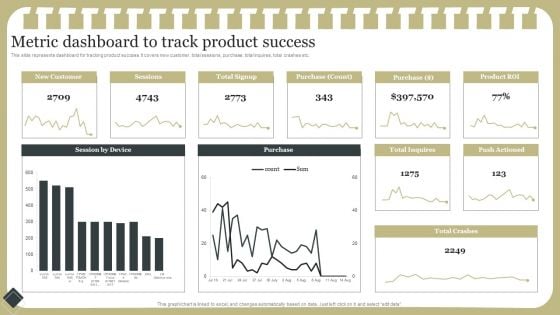
Effective Product Development Strategy Metric Dashboard To Track Product Success Microsoft PDF
This slide represents dashboard for tracking product success. It covers new customer, total sessions, purchase, total inquires, total crashes etc.This modern and well-arranged Effective Product Development Strategy Metric Dashboard To Track Product Success Microsoft PDF provides lots of creative possibilities. It is very simple to customize and edit with the Powerpoint Software. Just drag and drop your pictures into the shapes. All facets of this template can be edited with Powerpoint no extra software is necessary. Add your own material, put your images in the places assigned for them, adjust the colors, and then you can show your slides to the world, with an animated slide included.
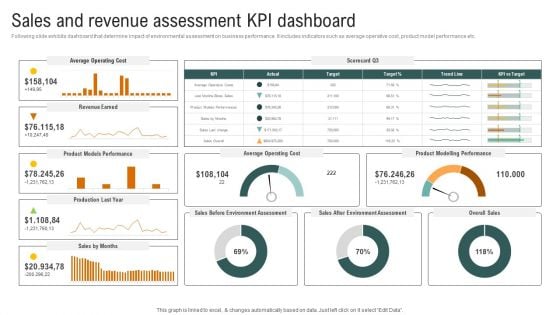
Sales And Revenue Assessment Kpi Dashboard Brochure PDF
Following slide exhibits dashboard that determine impact of environmental assessment on business performance. It includes indicators such as average operative cost, product model performance etc. If your project calls for a presentation, then Slidegeeks is your go-to partner because we have professionally designed, easy-to-edit templates that are perfect for any presentation. After downloading, you can easily edit Sales And Revenue Assessment Kpi Dashboard Brochure PDF and make the changes accordingly. You can rearrange slides or fill them with different images. Check out all the handy templates
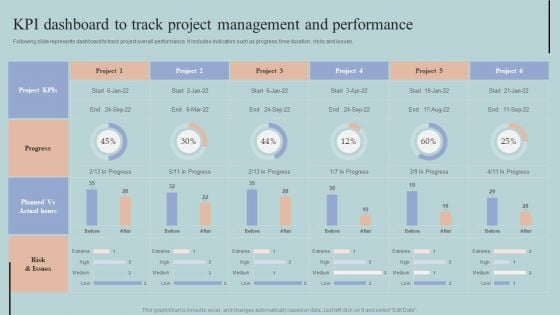
KPI Dashboard To Track Project Management And Performance Elements PDF
Following slide represents dashboard to track project overall performance. It includes indicators such as progress, time duration , risks and issues. Welcome to our selection of the KPI Dashboard To Track Project Management And Performance Elements PDF. These are designed to help you showcase your creativity and bring your sphere to life. Planning and Innovation are essential for any business that is just starting out. This collection contains the designs that you need for your everyday presentations. All of our PowerPoints are 100 percent editable, so you can customize them to suit your needs. This multi-purpose template can be used in various situations. Grab these presentation templates today
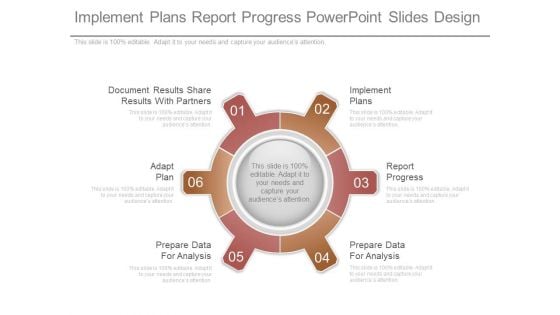
Implement Plans Report Progress Powerpoint Slides Design
This is a implement plans report progress powerpoint slides design. This is a six stage process. The stages in this process are document results share results with partners, implement plans, report progress, prepare data for analysis, prepare data for analysis, adapt plan.
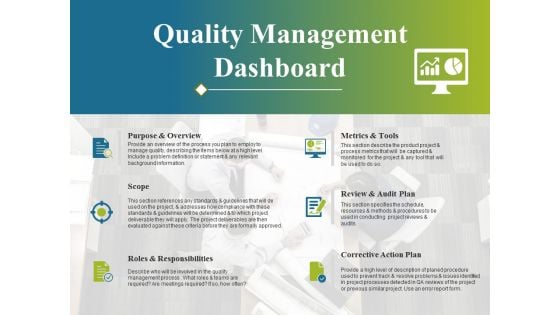
Quality Management Dashboard Ppt PowerPoint Presentation Summary Graphic Tips
This is a quality management dashboard ppt powerpoint presentation summary graphic tips. This is a six stage process. The stages in this process are purpose and overview, scope, roles and responsibilities, metrics and tools, review and audit plan, corrective action plan.
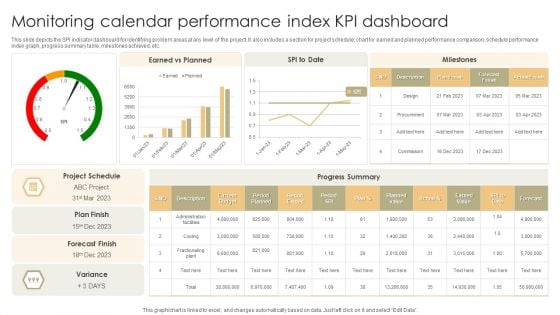
Monitoring Calendar Performance Index KPI Dashboard Slides PDF
This slide depicts the SPI indicator dashboard for identifying problem areas at any level of the project. It also includes a section for project schedule, chart for earned and planned performance comparison, schedule performance index graph, progress summary table, milestones achieved, etc. Pitch your topic with ease and precision using this Monitoring Calendar Performance Index KPI Dashboard Slides PDF. This layout presents information on Current Budget, Planned Value, Earned Value. It is also available for immediate download and adjustment. So, changes can be made in the color, design, graphics or any other component to create a unique layout.


 Continue with Email

 Home
Home


