Snapshot
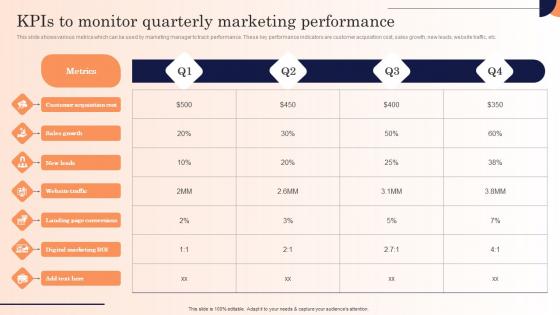
Kpis To Monitor Quarterly Marketing Performance Strategic Marketing Campaign Themes Pdf
This slide shows various metrics which can be used by marketing manager to track performance. These key performance indicators are customer acquisition cost, sales growth, new leads, website traffic, etc.Explore a selection of the finest Kpis To Monitor Quarterly Marketing Performance Strategic Marketing Campaign Themes Pdf here. With a plethora of professionally designed and pre-made slide templates, you can quickly and easily find the right one for your upcoming presentation. You can use our Kpis To Monitor Quarterly Marketing Performance Strategic Marketing Campaign Themes Pdf to effectively convey your message to a wider audience. Slidegeeks has done a lot of research before preparing these presentation templates. The content can be personalized and the slides are highly editable. Grab templates today from Slidegeeks. This slide shows various metrics which can be used by marketing manager to track performance. These key performance indicators are customer acquisition cost, sales growth, new leads, website traffic, etc.
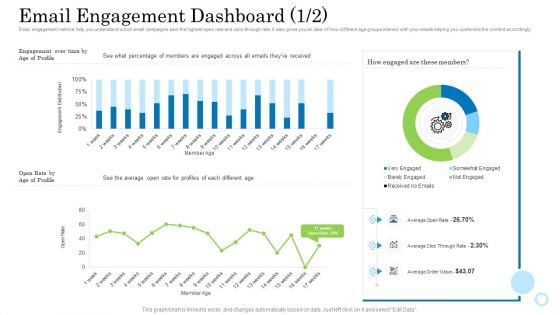
Customer Behavioral Data And Analytics Email Engagement Dashboard Rate Designs PDF
Email engagement metrics help you understand which email campaigns saw the highest open rate and click-through rate. It also gives you an idea of how different age groups interact with your emails helping you customize the content accordingly. Deliver an awe inspiring pitch with this creative customer behavioral data and analytics email engagement dashboard rate designs pdf bundle. Topics like email engagement dashboard can be discussed with this completely editable template. It is available for immediate download depending on the needs and requirements of the user.
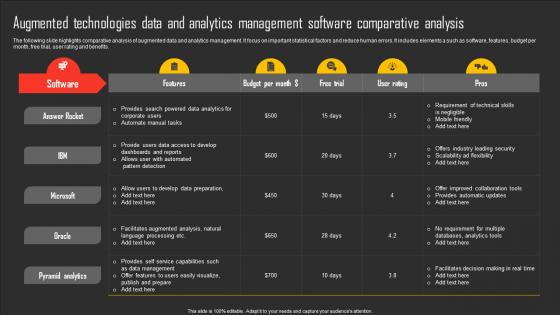
Augmented Technologies Data And Analytics Management Software Comparative Analysis Formats Pdf
The following slide highlights comparative analysis of augmented data and analytics management. It focus on important statistical factors and reduce human errors. It includes elements a such as software, features, budget per month, free trial, user rating and benefits. Showcasing this set of slides titled Augmented Technologies Data And Analytics Management Software Comparative Analysis Formats Pdf. The topics addressed in these templates are Answer Rocket, Microsoft, Pyramid Analytics . All the content presented in this PPT design is completely editable. Download it and make adjustments in color, background, font etc. as per your unique business setting. The following slide highlights comparative analysis of augmented data and analytics management. It focus on important statistical factors and reduce human errors. It includes elements a such as software, features, budget per month, free trial, user rating and benefits.
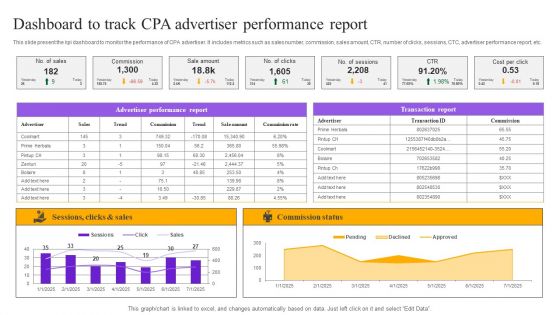
Strategies For Implementing CPA Marketing Dashboard To Track CPA Advertiser Performance Report Inspiration PDF
This slide present the kpi dashboard to monitor the performance of CPA advertiser. It includes metrics such as sales number, commission, sales amount, CTR, number of clicks, sessions, CTC, advertiser performance report, etc. The Strategies For Implementing CPA Marketing Dashboard To Track CPA Advertiser Performance Report Inspiration PDF is a compilation of the most recent design trends as a series of slides. It is suitable for any subject or industry presentation, containing attractive visuals and photo spots for businesses to clearly express their messages. This template contains a variety of slides for the user to input data, such as structures to contrast two elements, bullet points, and slides for written information. Slidegeeks is prepared to create an impression.
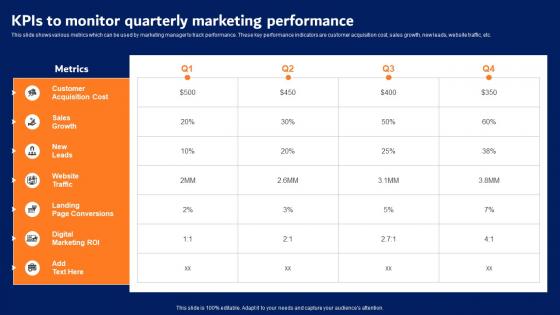
KPIs To Monitor Quarterly Marketing Performance Digital Advertising Strategies Mockup Pdf
This slide shows various metrics which can be used by marketing manager to track performance. These key performance indicators are customer acquisition cost, sales growth, new leads, website traffic, etc. Find a pre designed and impeccable KPIs To Monitor Quarterly Marketing Performance Digital Advertising Strategies Mockup Pdf. The templates can ace your presentation without additional effort. You can download these easy to edit presentation templates to make your presentation stand out from others. So, what are you waiting for Download the template from Slidegeeks today and give a unique touch to your presentation. This slide shows various metrics which can be used by marketing manager to track performance. These key performance indicators are customer acquisition cost, sales growth, new leads, website traffic, etc.
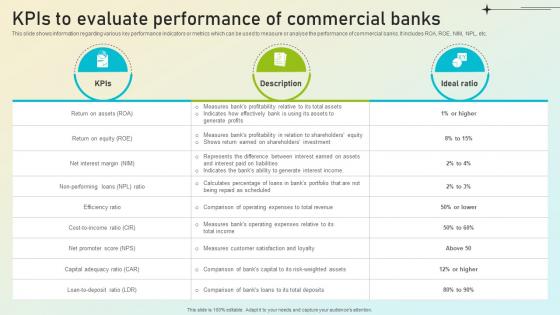
Beginners Guide To Commercial Kpis To Evaluate Performance Of Commercial Banks Fin SS V
This slide shows information regarding various key performance indicators or metrics which can be used to measure or analyse the performance of commercial banks. It includes ROA, ROE, NIM, NPL, etc. Want to ace your presentation in front of a live audience Our Beginners Guide To Commercial Kpis To Evaluate Performance Of Commercial Banks Fin SS V can help you do that by engaging all the users towards you. Slidegeeks experts have put their efforts and expertise into creating these impeccable powerpoint presentations so that you can communicate your ideas clearly. Moreover, all the templates are customizable, and easy-to-edit and downloadable. Use these for both personal and commercial use. This slide shows information regarding various key performance indicators or metrics which can be used to measure or analyse the performance of commercial banks. It includes ROA, ROE, NIM, NPL, etc.

Kpis To Evaluate Performance Of Commercial Banks Complete Guide On Managing Banking Fin SS V
This slide shows information regarding various key performance indicators or metrics which can be used to measure or analyse the performance of commercial banks. It includes ROA, ROE, NIM, NPL, etc. Take your projects to the next level with our ultimate collection of Kpis To Evaluate Performance Of Commercial Banks Complete Guide On Managing Banking Fin SS V. Slidegeeks has designed a range of layouts that are perfect for representing task or activity duration, keeping track of all your deadlines at a glance. Tailor these designs to your exact needs and give them a truly corporate look with your own brand colors they will make your projects stand out from the rest This slide shows information regarding various key performance indicators or metrics which can be used to measure or analyse the performance of commercial banks. It includes ROA, ROE, NIM, NPL, etc.
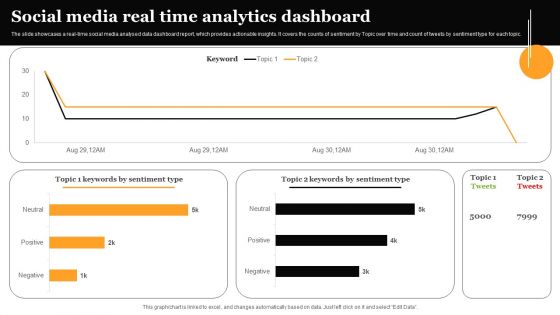
Social Media Real Time Analytics Dashboard Formats PDF
The slide showcases a real-time social media analysed data dashboard report, which provides actionable insights. It covers the counts of sentiment by Topic over time and count of tweets by sentiment type for each topic. Showcasing this set of slides titled Social Media Real Time Analytics Dashboard Formats PDF. The topics addressed in these templates are Social Media Real, Time Analytics, Dashboard. All the content presented in this PPT design is completely editable. Download it and make adjustments in color, background, font etc. as per your unique business setting.
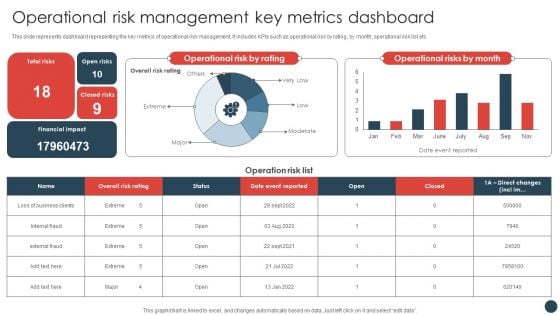
Strategic Risk Management Plan Operational Risk Management Key Metrics Dashboard Structure PDF
This slide represents dashboard representing the key metrics of operational risk management. It includes KPIs such as operational risk by rating, by month, operational risk list etc.Create an editable Strategic Risk Management Plan Operational Risk Management Key Metrics Dashboard Structure PDF that communicates your idea and engages your audience. Whether you are presenting a business or an educational presentation, pre-designed presentation templates help save time. Strategic Risk Management Plan Operational Risk Management Key Metrics Dashboard Structure PDF is highly customizable and very easy to edit, covering many different styles from creative to business presentations. Slidegeeks has creative team members who have crafted amazing templates. So, go and get them without any delay.
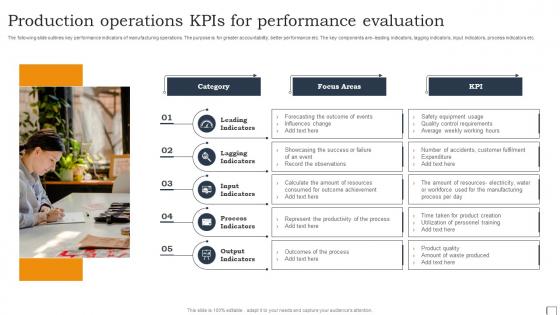
Production Operations KPIs For Performance Evaluation Structure Pdf
The following slide outlines key performance indicators of manufacturing operations. The purpose is for greater accountability, better performance etc. The key components are- leading indicators, lagging indicators, input indicators, process indicators etc. Pitch your topic with ease and precision using this Production Operations KPIs For Performance Evaluation Structure Pdf. This layout presents information on Leading Indicators, Lagging Indicators, Input Indicators. It is also available for immediate download and adjustment. So, changes can be made in the color, design, graphics or any other component to create a unique layout. The following slide outlines key performance indicators of manufacturing operations. The purpose is for greater accountability, better performance etc. The key components are- leading indicators, lagging indicators, input indicators, process indicators etc.
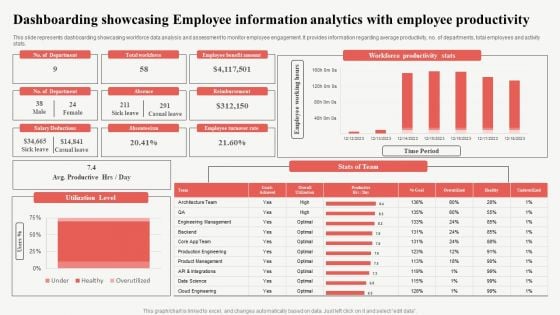
Dashboarding Showcasing Employee Information Analytics With Employee Productivity Slides PDF
This slide represents dashboarding showcasing workforce data analysis and assessment to monitor employee engagement. It provides information regarding average productivity, no. of departments, total employees and activity stats. Pitch your topic with ease and precision using this Dashboarding Showcasing Employee Information Analytics With Employee Productivity Slides PDF. This layout presents information on Reimbursement, Productive, Workforce Productivity Stats. It is also available for immediate download and adjustment. So, changes can be made in the color, design, graphics or any other component to create a unique layout.
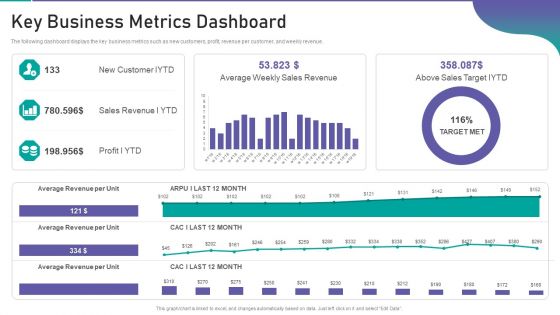
Corporate Organization Playbook Key Business Metrics Dashboard Ppt Show Rules PDF
The following dashboard displays the key business metrics such as new customers, profit, revenue per customer, and weekly revenue. Deliver an awe inspiring pitch with this creative corporate organization playbook key business metrics dashboard ppt show rules pdf bundle. Topics like new customer iytd, sales revenue i ytd, profit i ytd can be discussed with this completely editable template. It is available for immediate download depending on the needs and requirements of the user.
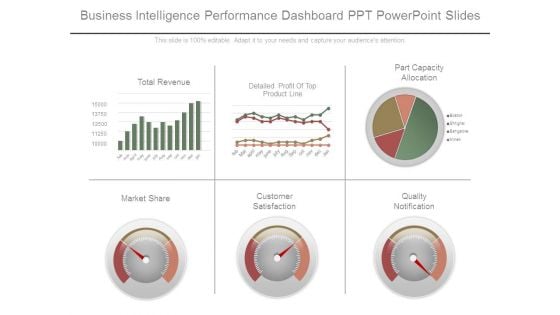
Business Intelligence Performance Dashboard Ppt Powerpoint Slides
This is a business intelligence performance dashboard ppt powerpoint slides. This is a six stage process. The stages in this process are total revenue, detailed profit of top product line, part capacity allocation, market share, customer satisfaction, quality notification.
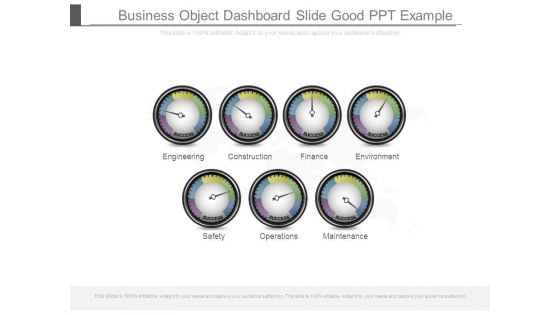
Business Object Dashboard Slide Good Ppt Example
This is a business object dashboard slide good ppt example. This is a seven stage process. The stages in this process are engineering, construction, finance, environment, safety, operations, maintenance.
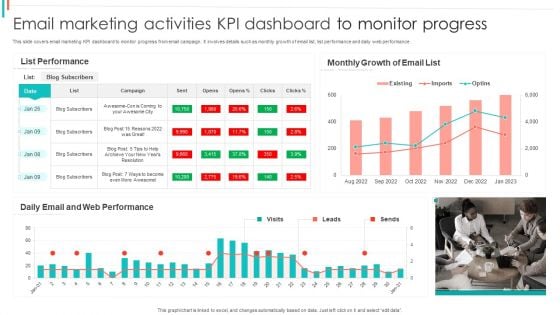
Email Marketing Activities KPI Dashboard To Monitor Progress Pictures PDF
This slide covers email marketing KPI dashboard to monitor progress from email campaign. It involves details such as monthly growth of email list, list performance and daily web performance.Showcasing this set of slides titled Email Marketing Activities KPI Dashboard To Monitor Progress Pictures PDF. The topics addressed in these templates are List Performance, Monthly Growth, Web Performance. All the content presented in this PPT design is completely editable. Download it and make adjustments in color, background, font etc. as per your unique business setting.
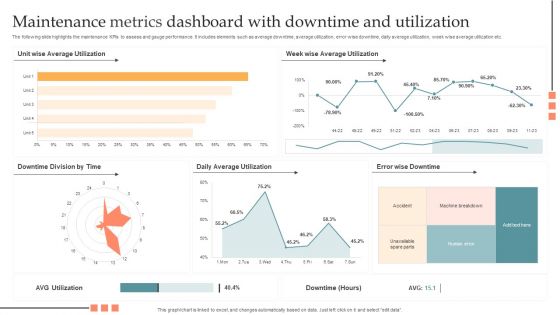
Maintenance Metrics Dashboard With Downtime And Utilization Pictures PDF
The following slide highlights the maintenance KPIs to assess and gauge performance. It includes elements such as average downtime, average utilization, error wise downtime, daily average utilization, week wise average utilization etc. Showcasing this set of slides titled Maintenance Metrics Dashboard With Downtime And Utilization Pictures PDF. The topics addressed in these templates are Maintenance Metrics Dashboard, Downtime And Utilization. All the content presented in this PPT design is completely editable. Download it and make adjustments in color, background, font etc. as per your unique business setting.
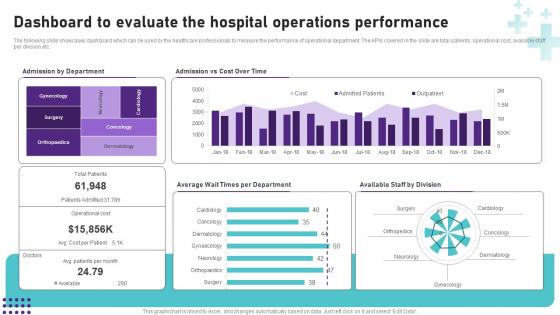
Dashboard To Evaluate The Hospital Operational Areas Healthcare Professional PDF
Present like a pro with Dashboard To Evaluate The Hospital Operational Areas Healthcare Professional PDF Create beautiful presentations together with your team, using our easy-to-use presentation slides. Share your ideas in real-time and make changes on the fly by downloading our templates. So whether you are in the office, on the go, or in a remote location, you can stay in sync with your team and present your ideas with confidence. With Slidegeeks presentation got a whole lot easier. Grab these presentations today. The following slide showcases dashboard which can be used by the healthcare professionals to measure the performance of operational department. The KPIs covered in the slide are total patients, operational cost, available staff per division etc.

Salon Marketing Plan To Optimize Dashboard Monitoring Sales And Revenue Strategy SS V
This slide presents a dashboard tracking revenue and sales by products and services. It includes KPIs such as revenue by service and products, units sold, monthly revenue. Formulating a presentation can take up a lot of effort and time, so the content and message should always be the primary focus. The visuals of the PowerPoint can enhance the presenters message, so our Salon Marketing Plan To Optimize Dashboard Monitoring Sales And Revenue Strategy SS V was created to help save time. Instead of worrying about the design, the presenter can concentrate on the message while our designers work on creating the ideal templates for whatever situation is needed. Slidegeeks has experts for everything from amazing designs to valuable content, we have put everything into Salon Marketing Plan To Optimize Dashboard Monitoring Sales And Revenue Strategy SS V. This slide presents a dashboard tracking revenue and sales by products and services. It includes KPIs such as revenue by service and products, units sold, monthly revenue.

Salon Marketing Plan To Optimize Website Analytics Dashboard To Monitor Strategy SS V
This slide represent a website analytics dashboard tracking online traffic and appointments. It includes KPIs such as visitors count, purchasers count, booked appointments, forecasted booking count by month, visitor-to-customer conversion trend, customer acquisition through channels and visitors count by categories. Here you can discover an assortment of the finest PowerPoint and Google Slides templates. With these templates, you can create presentations for a variety of purposes while simultaneously providing your audience with an eye-catching visual experience. Download Salon Marketing Plan To Optimize Website Analytics Dashboard To Monitor Strategy SS V to deliver an impeccable presentation. These templates will make your job of preparing presentations much quicker, yet still, maintain a high level of quality. Slidegeeks has experienced researchers who prepare these templates and write high-quality content for you. Later on, you can personalize the content by editing the Salon Marketing Plan To Optimize Website Analytics Dashboard To Monitor Strategy SS V. This slide represent a website analytics dashboard tracking online traffic and appointments. It includes KPIs such as visitors count, purchasers count, booked appointments, forecasted booking count by month, visitor-to-customer conversion trend, customer acquisition through channels and visitors count by categories.
Dashboard For Tracking Social Media Comprehensive Guide To Wholesale Ppt Sample
This slide showcases social media marketing campaign performance tracking dashboard which helps identify most profitable advertising channel. It provides information regarding KPIs such as impressions, likes, comments, shares, clicks, followers, cost er sessions etc. Formulating a presentation can take up a lot of effort and time, so the content and message should always be the primary focus. The visuals of the PowerPoint can enhance the presenters message, so our Dashboard For Tracking Social Media Comprehensive Guide To Wholesale Ppt Sample was created to help save time. Instead of worrying about the design, the presenter can concentrate on the message while our designers work on creating the ideal templates for whatever situation is needed. Slidegeeks has experts for everything from amazing designs to valuable content, we have put everything into Dashboard For Tracking Social Media Comprehensive Guide To Wholesale Ppt Sample This slide showcases social media marketing campaign performance tracking dashboard which helps identify most profitable advertising channel. It provides information regarding KPIs such as impressions, likes, comments, shares, clicks, followers, cost er sessions etc.
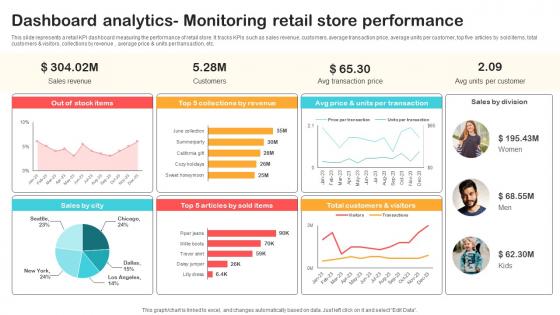
Dashboard Analytics Monitoring Retail Store Performance Optimizing Retail Operations With Digital DT SS V
This slide represents a retail KPI dashboard measuring the performance of retail store. It tracks KPIs such as sales revenue, customers, average transaction price, average units per customer, top five articles by sold items, total customers and visitors, collections by revenue , average price and units per transaction, etc.Are you in need of a template that can accommodate all of your creative concepts This one is crafted professionally and can be altered to fit any style. Use it with Google Slides or PowerPoint. Include striking photographs, symbols, depictions, and other visuals. Fill, move around, or remove text boxes as desired. Test out color palettes and font mixtures. Edit and save your work, or work with colleagues. Download Dashboard Analytics Monitoring Retail Store Performance Optimizing Retail Operations With Digital DT SS V and observe how to make your presentation outstanding. Give an impeccable presentation to your group and make your presentation unforgettable. This slide represents a retail KPI dashboard measuring the performance of retail store. It tracks KPIs such as sales revenue, customers, average transaction price, average units per customer, top five articles by sold items, total customers and visitors, collections by revenue , average price and units per transaction, etc.
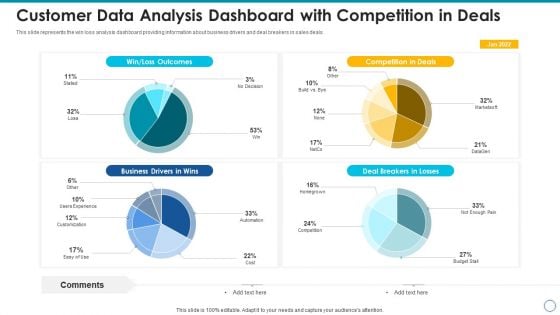
Customer Data Analysis Dashboard With Competition In Deals Infographics PDF
This slide represents the win loss analysis dashboard providing information about business drivers and deal breakers in sales deals. Pitch your topic with ease and precision using this customer data analysis dashboard with competition in deals infographics pdf. This layout presents information on customer data analysis dashboard with competition in deals. It is also available for immediate download and adjustment. So, changes can be made in the color, design, graphics or any other component to create a unique layout.
Vendor Performance KPI Analytical Dashboard Icon For Data Management Background PDF
Persuade your audience using this Vendor Performance KPI Analytical Dashboard Icon For Data Management Background PDF. This PPT design covers three stages, thus making it a great tool to use. It also caters to a variety of topics including Vendor Performance, KPI Analytical Dashboard, Icon Data Management. Download this PPT design now to present a convincing pitch that not only emphasizes the topic but also showcases your presentation skills.
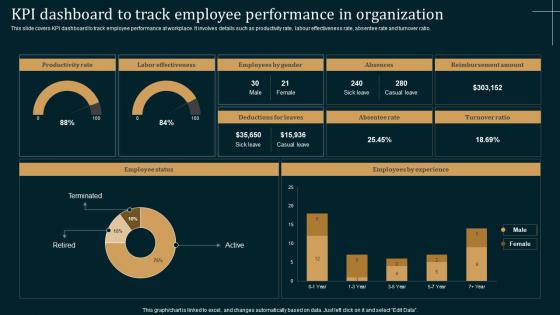
Employee Performance Improvement Strategies KPI Dashboard Track Employee Guidelines Pdf
This slide covers KPI dashboard to track employee performance at workplace. It involves details such as productivity rate, labour effectiveness rate, absentee rate and turnover ratio. Slidegeeks is here to make your presentations a breeze with Employee Performance Improvement Strategies KPI Dashboard Track Employee Guidelines Pdf With our easy to use and customizable templates, you can focus on delivering your ideas rather than worrying about formatting. With a variety of designs to choose from, you are sure to find one that suits your needs. And with animations and unique photos, illustrations, and fonts, you can make your presentation pop. So whether you are giving a sales pitch or presenting to the board, make sure to check out Slidegeeks first This slide covers KPI dashboard to track employee performance at workplace. It involves details such as productivity rate, labour effectiveness rate, absentee rate and turnover ratio.
Effective Product Adaptation Dashboard Tracking Influencer Marketing Campaign Performance Diagrams PDF
If you are looking for a format to display your unique thoughts, then the professionally designed Effective Product Adaptation Dashboard Tracking Influencer Marketing Campaign Performance Diagrams PDF is the one for you. You can use it as a Google Slides template or a PowerPoint template. Incorporate impressive visuals, symbols, images, and other charts. Modify or reorganize the text boxes as you desire. Experiment with shade schemes and font pairings. Alter, share or cooperate with other people on your work. Download Effective Product Adaptation Dashboard Tracking Influencer Marketing Campaign Performance Diagrams PDF and find out how to give a successful presentation. Present a perfect display to your team and make your presentation unforgettable. This slide represents a dashboard monitoring the performance of local influencer marketing campaigns to promote the product in the target market. It tracks KPIs such as, post, Instagram impressions, likes, comments, visitor calculation, campaign insights, and top performers.
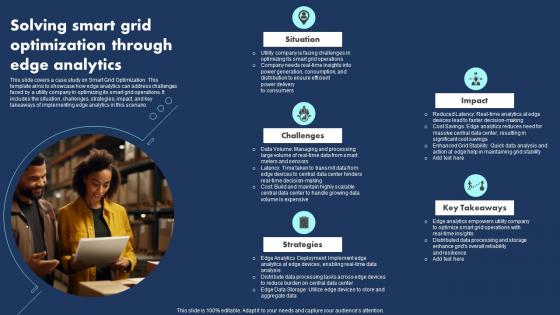
Solving Smart Grid Optimization Through Edge Analytics Pictures Pdf
This slide covers a case study on Smart Grid Optimization. This template aims to showcase how edge analytics can address challenges faced by a utility company in optimizing its smart grid operations. It includes the situation, challenges, strategies, impact, and key takeaways of implementing edge analytics in this scenario.Showcasing this set of slides titled Solving Smart Grid Optimization Through Edge Analytics Pictures Pdf The topics addressed in these templates are Deployment Implement, Distribute Data Processing, Key Takeaways All the content presented in this PPT design is completely editable. Download it and make adjustments in color, background, font etc. as per your unique business setting. This slide covers a case study on Smart Grid Optimization. This template aims to showcase how edge analytics can address challenges faced by a utility company in optimizing its smart grid operations. It includes the situation, challenges, strategies, impact, and key takeaways of implementing edge analytics in this scenario.
Magnifying Glass With Tax Report Ppt PowerPoint Presentation Gallery Design Templates PDF
Presenting magnifying glass with tax report ppt powerpoint presentation gallery design templates pdf to dispense important information. This template comprises three stages. It also presents valuable insights into the topics including magnifying glass with tax report. This is a completely customizable PowerPoint theme that can be put to use immediately. So, download it and address the topic impactfully.
Environmental Social And Governance Reporting Evaluation For IT Industry Icon Portrait PDF
Persuade your audience using this Environmental Social And Governance Reporting Evaluation For IT Industry Icon Portrait PDF. This PPT design covers four stages, thus making it a great tool to use. It also caters to a variety of topics including Environmental, Social, Governance Reporting Evaluation, IT Industry Icon. Download this PPT design now to present a convincing pitch that not only emphasizes the topic but also showcases your presentation skills.
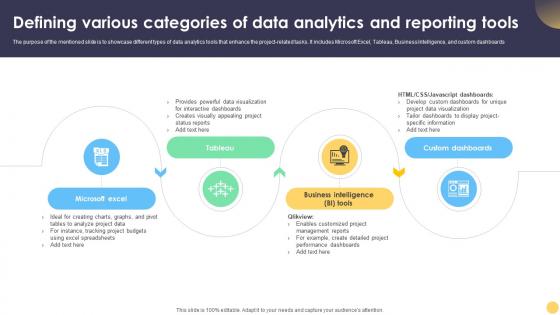
Digital Project Management Strategies Defining Various Categories Of Data Analytics And Reporting
The purpose of the mentioned slide is to showcase different types of data analytics tools that enhance the project-related tasks. It includes Microsoft Excel, Tableau, Business Intelligence, and custom dashboards. Slidegeeks is here to make your presentations a breeze with Digital Project Management Strategies Defining Various Categories Of Data Analytics And Reporting With our easy-to-use and customizable templates, you can focus on delivering your ideas rather than worrying about formatting. With a variety of designs to choose from, you are sure to find one that suits your needs. And with animations and unique photos, illustrations, and fonts, you can make your presentation pop. So whether you are giving a sales pitch or presenting to the board, make sure to check out Slidegeeks first The purpose of the mentioned slide is to showcase different types of data analytics tools that enhance the project-related tasks. It includes Microsoft Excel, Tableau, Business Intelligence, and custom dashboards.
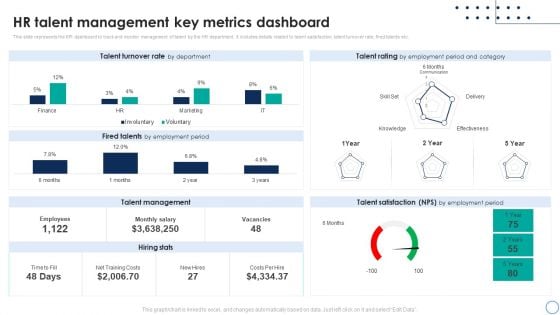
Business Analytics Application HR Talent Management Key Metrics Dashboard Rules PDF
This slide represents the KPI dashboard to track and monitor management of talent by the HR department. It includes details related to talent satisfaction, talent turnover rate, fired talents etc. This Business Analytics Application HR Talent Management Key Metrics Dashboard Rules PDF is perfect for any presentation, be it in front of clients or colleagues. It is a versatile and stylish solution for organizing your meetings. The Business Analytics Application HR Talent Management Key Metrics Dashboard Rules PDF features a modern design for your presentation meetings. The adjustable and customizable slides provide unlimited possibilities for acing up your presentation. Slidegeeks has done all the homework before launching the product for you. So, dont wait, grab the presentation templates today.
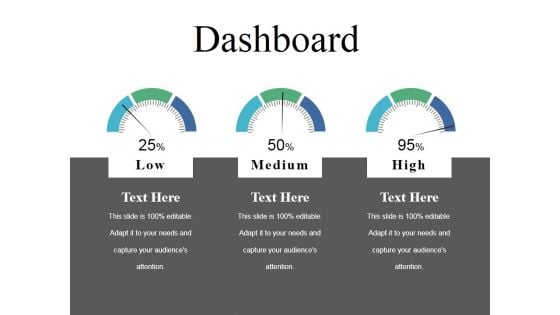
Dashboard Ppt PowerPoint Presentation Layouts Format
This is a dashboard ppt powerpoint presentation layouts format. This is a three stage process. The stages in this process are low, medium, high, dashboard, measurement.
Dashboard Ppt PowerPoint Presentation Icon Infographic Template
This is a dashboard ppt powerpoint presentation icon infographic template. This is a two stage process. The stages in this process are low, medium, high, dashboard, measurement.

Dashboard Ppt PowerPoint Presentation Model Slide
This is a dashboard ppt powerpoint presentation model slide. This is a three stage process. The stages in this process are low, medium, high, dashboard, measurement.
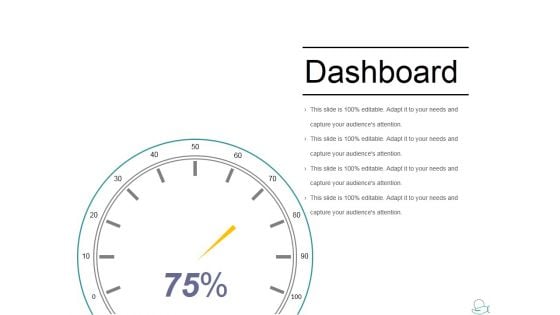
Dashboard Ppt PowerPoint Presentation Summary Inspiration
This is a dashboard ppt powerpoint presentation summary inspiration. This is a one stage process. The stages in this process are low, medium, high, dashboard, measurement.
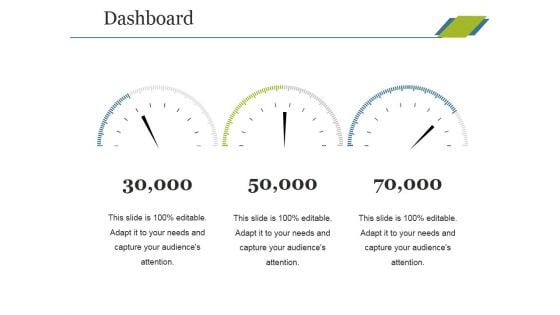
Dashboard Ppt PowerPoint Presentation Inspiration Sample
This is a dashboard ppt powerpoint presentation inspiration sample. This is a three stage process. The stages in this process are low, medium, high, dashboard, measurement.
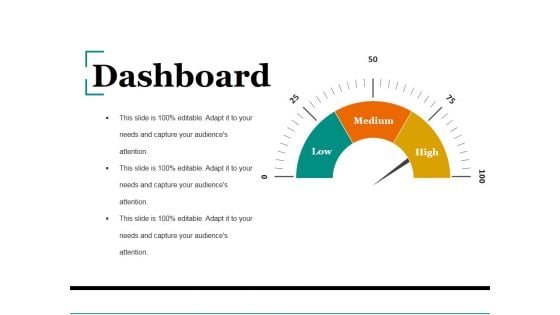
Dashboard Ppt PowerPoint Presentation Design Templates
This is a dashboard ppt powerpoint presentation design templates. This is a three stage process. The stages in this process are low, medium, high, dashboard measurement.
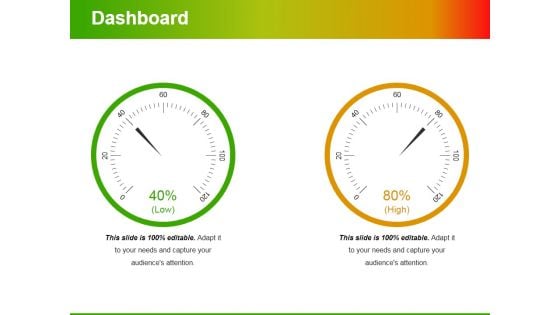
Dashboard Ppt PowerPoint Presentation Outline Images
This is a dashboard ppt powerpoint presentation outline images. This is a two stage process. The stages in this process are low, medium, high, dashboard, measurement.
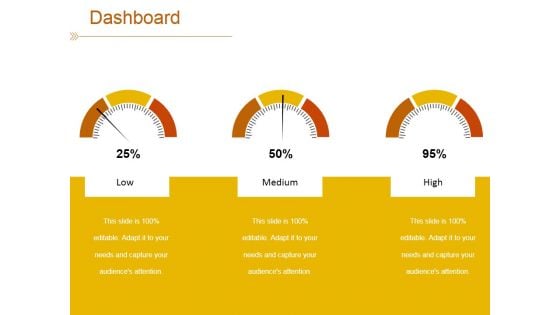
Dashboard Ppt PowerPoint Presentation Summary Deck
This is a dashboard ppt powerpoint presentation summary deck. This is a three stage process. The stages in this process are low, medium, high, dashboard, measurement.
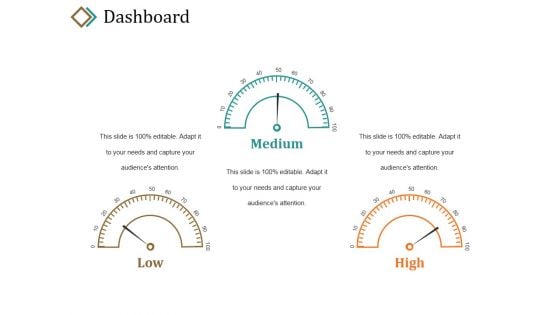
Dashboard Ppt PowerPoint Presentation Visual Aids Infographics
This is a dashboard ppt powerpoint presentation visual aids infographics. This is a three stage process. The stages in this process are low, medium, high, dashboard, measurement.
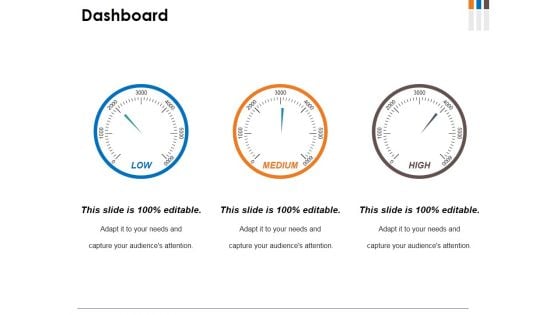
Dashboard Ppt PowerPoint Presentation Show Outfit
This is a dashboard ppt powerpoint presentation show outfit. This is a three stage process. The stages in this process are low, medium, high, dashboard, measurement.
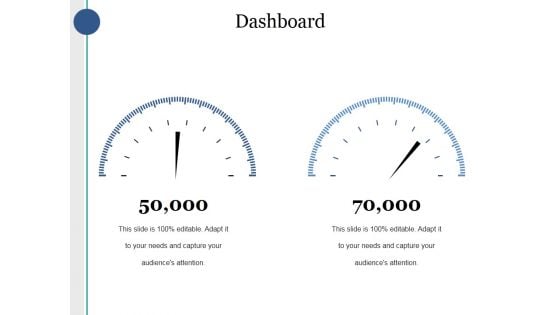
Dashboard Ppt PowerPoint Presentation Visual Aids Ideas
This is a dashboard ppt powerpoint presentation visual aids ideas. This is a two stage process. The stages in this process are low, medium, high, dashboard, measurement.
Dashboard Ppt PowerPoint Presentation Gallery Design Templates
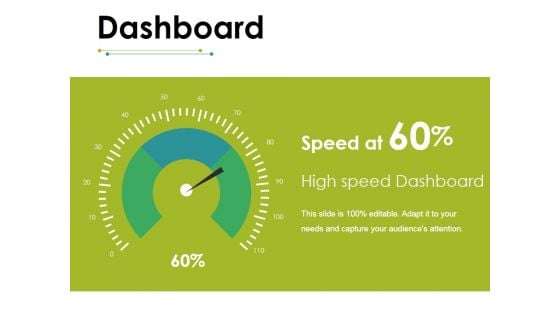
This is a dashboard ppt powerpoint presentation gallery design templates. This is a one stage process. The stages in this process are low, medium, high, dashboard, measurement.
Dashboard Ppt PowerPoint Presentation File Guidelines
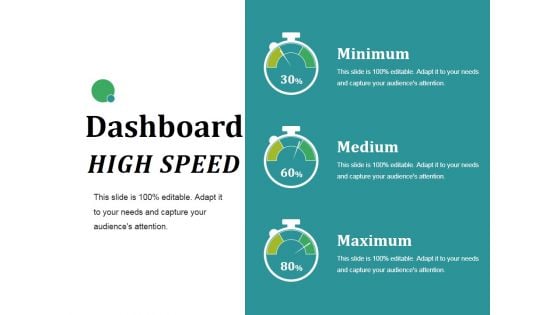
This is a dashboard ppt powerpoint presentation file guidelines. This is a three stage process. The stages in this process are minimum, medium, maximum, dashboard, measurement.
Dashboard For Twitter Competition Analysis Twitter Promotional Techniques Themes Pdf
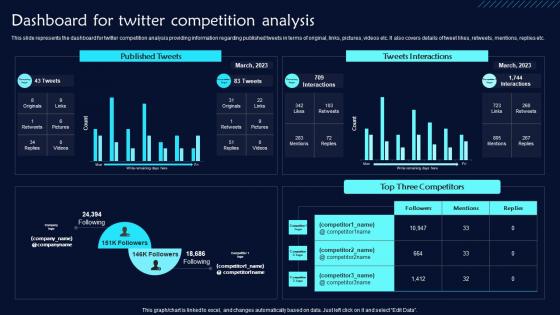
This slide represents the dashboard for twitter competition analysis providing information regarding published tweets in terms of original, links, pictures, videos etc. It also covers details of tweet likes, retweets, mentions, replies etc. Get a simple yet stunning designed Dashboard For Twitter Competition Analysis Twitter Promotional Techniques Themes Pdf. It is the best one to establish the tone in your meetings. It is an excellent way to make your presentations highly effective. So, download this PPT today from Slidegeeks and see the positive impacts. Our easy-to-edit Dashboard For Twitter Competition Analysis Twitter Promotional Techniques Themes Pdf can be your go-to option for all upcoming conferences and meetings. So, what are you waiting for Grab this template today. This slide represents the dashboard for twitter competition analysis providing information regarding published tweets in terms of original, links, pictures, videos etc. It also covers details of tweet likes, retweets, mentions, replies etc.
Monetary Planning And Evaluation Guide KPI Metrics Dashboard Highlighting Organization Revenue Profitability And Liquidity Ppt Diagram Images PDF
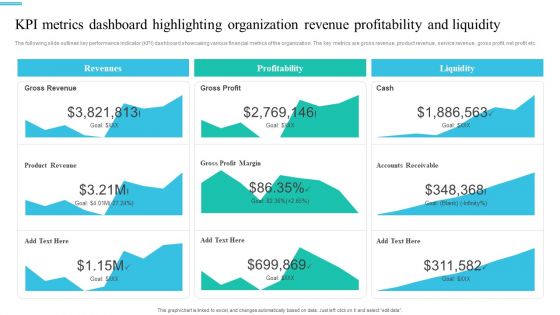
The following slide outlines key performance indicator KPI dashboard showcasing various financial metrics of the organization. The key metrics are gross revenue, product revenue, service revenue, gross profit, net profit etc. Coming up with a presentation necessitates that the majority of the effort goes into the content and the message you intend to convey. The visuals of a PowerPoint presentation can only be effective if it supplements and supports the story that is being told. Keeping this in mind our experts created Monetary Planning And Evaluation Guide KPI Metrics Dashboard Highlighting Organization Revenue Profitability And Liquidity Ppt Diagram Images PDF to reduce the time that goes into designing the presentation. This way, you can concentrate on the message while our designers take care of providing you with the right template for the situation.
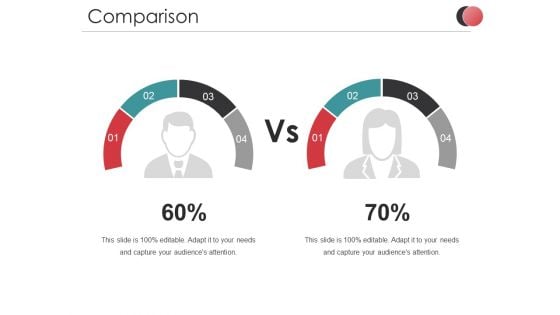
Comparison Ppt PowerPoint Presentation Professional Slide Download
This is a comparison ppt powerpoint presentation professional slide download. This is a two stage process. The stages in this process are business, marketing, planning, comparison, percentage.
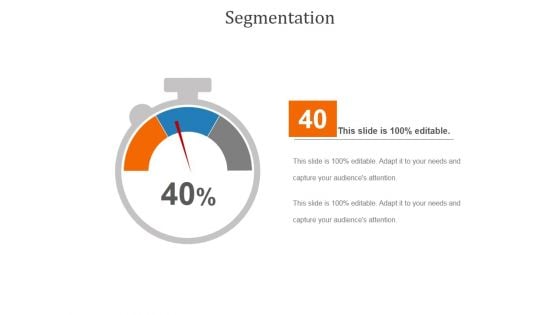
Segmentation Ppt PowerPoint Presentation Layouts
This is a segmentation ppt powerpoint presentation layouts. This is a one stage process. The stages in this process are segmentation, strategy, management, marketing, business.
Current Status Of Product Ppt PowerPoint Presentation Deck
This is a current status of product ppt powerpoint presentation deck. This is a one stage process. The stages in this process are product, business, management, marketing, strategy.
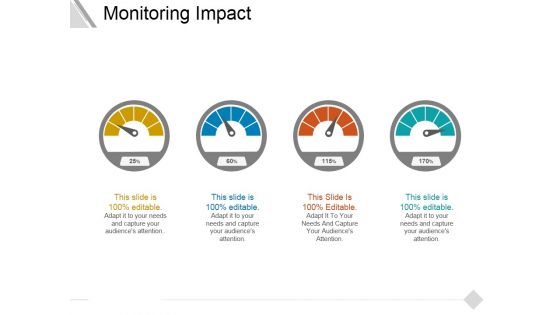
Monitoring Impact Ppt PowerPoint Presentation Ideas Guide
This is a monitoring impact ppt powerpoint presentation ideas guide. This is a four stage process. The stages in this process are speed, meter, business, marketing, equipment.
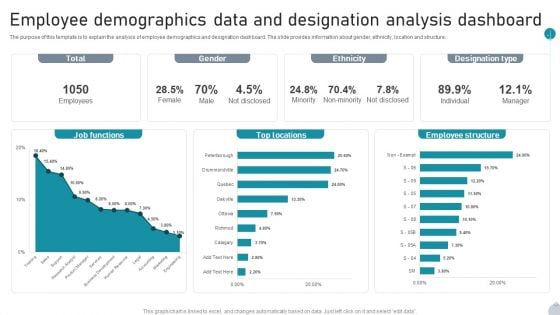
Employee Demographics Data And Designation Analysis Dashboard Introduction PDF
The purpose of this template is to explain the analysis of employee demographics and designation dashboard. The slide provides information about gender, ethnicity, location and structure. Pitch your topic with ease and precision using this Employee Demographics Data And Designation Analysis Dashboard Introduction PDF. This layout presents information on Job Functions, Top Locations, Employee Structure It is also available for immediate download and adjustment. So, changes can be made in the color, design, graphics or any other component to create a unique layout.
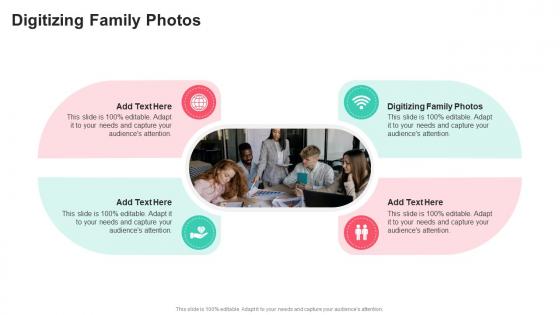
Digitizing Family Photos In Powerpoint And Google Slides Cpb
Presenting our innovatively-designed set of slides titled Digitizing Family Photos In Powerpoint And Google Slides Cpb. This completely editable PowerPoint graphic exhibits Digitizing Family Photos that will help you convey the message impactfully. It can be accessed with Google Slides and is available in both standard screen and widescreen aspect ratios. Apart from this, you can download this well-structured PowerPoint template design in different formats like PDF, JPG, and PNG. So, click the download button now to gain full access to this PPT design. Our Digitizing Family Photos In Powerpoint And Google Slides Cpb are topically designed to provide an attractive backdrop to any subject. Use them to look like a presentation pro.

Photo Digitization In Powerpoint And Google Slides Cpb
Presenting our innovatively designed set of slides titled Photo Digitization In Powerpoint And Google Slides Cpb. This completely editable PowerPoint graphic exhibits Photo Digitization that will help you convey the message impactfully. It can be accessed with Google Slides and is available in both standard screen and widescreen aspect ratios. Apart from this, you can download this well structured PowerPoint template design in different formats like PDF, JPG, and PNG. So, click the download button now to gain full access to this PPT design. Our Photo Digitization In Powerpoint And Google Slides Cpb are topically designed to provide an attractive backdrop to any subject. Use them to look like a presentation pro.
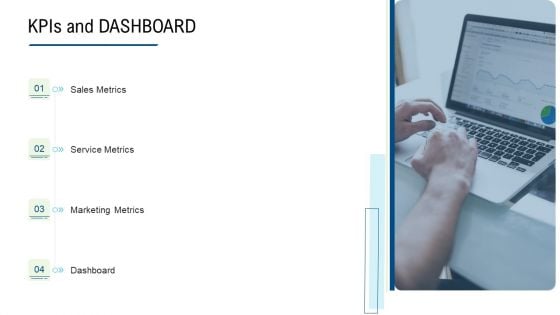
Product Commercialization Action Plan Kpis And DASHBOARD Clipart PDF
Presenting product commercialization action plan KPIs and DASHBOARD clipart pdf to provide visual cues and insights. Share and navigate important information on four stages that need your due attention. This template can be used to pitch topics like sales metrics, service metrics, marketing metrics, dashboard. In addtion, this PPT design contains high resolution images, graphics, etc, that are easily editable and available for immediate download.
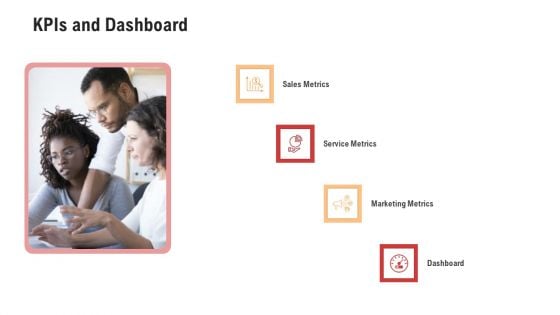
Competitor Assessment In Product Development Kpis And Dashboard Download PDF
This is a competitor assessment in product development kpis and dashboard download pdf. template with various stages. Focus and dispense information on four stages using this creative set, that comes with editable features. It contains large content boxes to add your information on topics like sales metrics, service metrics, marketing metrics, dashboard. You can also showcase facts, figures, and other relevant content using this PPT layout. Grab it now.
Commodity Category Analysis Kpis And Dashboard Ppt Styles Ideas PDF
Presenting commodity category analysis kpis and dashboard ppt styles ideas pdf to provide visual cues and insights. Share and navigate important information on four stages that need your due attention. This template can be used to pitch topics like sales metrics, service metrics, marketing metrics, dashboard. In addtion, this PPT design contains high resolution images, graphics, etc, that are easily editable and available for immediate download.
Commodity Channel Segmentation Kpis And Dashboard Ppt Styles Information PDF
Presenting commodity channel segmentation kpis and dashboard ppt styles information pdf to provide visual cues and insights. Share and navigate important information on four stages that need your due attention. This template can be used to pitch topics like sales metrics, service metrics, marketing metrics, dashboard. In addtion, this PPT design contains high resolution images, graphics, etc, that are easily editable and available for immediate download.
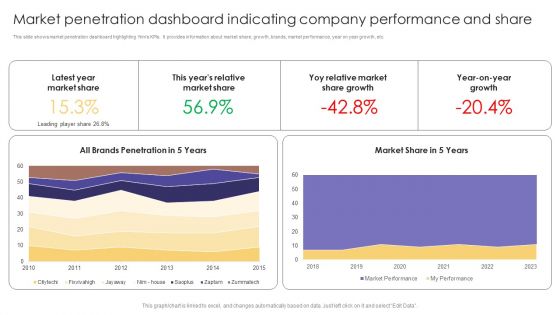
Market Penetration Dashboard Indicating Company Performance And Share Formats PDF
This slide shows market penetration dashboard highlighting firms KPIs. It provides information about market share, growth, brands, market performance, year on year growth, etc. Showcasing this set of slides titled Market Penetration Dashboard Indicating Company Performance And Share Formats PDF. The topics addressed in these templates are Latest Year, Market Share, Market Share Growth. All the content presented in this PPT design is completely editable. Download it and make adjustments in color, background, font etc. as per your unique business setting.
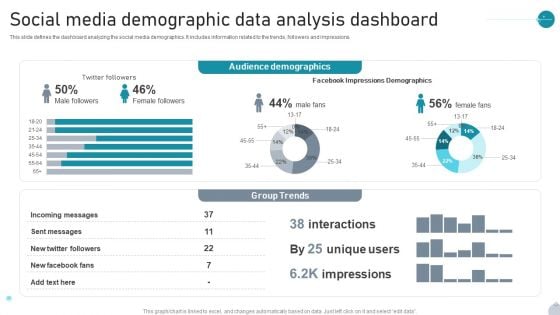
Social Media Demographic Data Analysis Dashboard Infographics PDF
This slide defines the dashboard analyzing the social media demographics. It includes information related to the trends, followers and impressions. Pitch your topic with ease and precision using this Social Media Demographic Data Analysis Dashboard Infographics PDF. This layout presents information on Audience Demographics, Group Trends, Impressions Demographics It is also available for immediate download and adjustment. So, changes can be made in the color, design, graphics or any other component to create a unique layout.
Professional Photo Printing In Powerpoint And Google Slides Cpb
Introducing our well designed Professional Photo Printing In Powerpoint And Google Slides Cpb. This PowerPoint design presents information on topics like Professional Photo Printing. As it is predesigned it helps boost your confidence level. It also makes you a better presenter because of its high quality content and graphics. This PPT layout can be downloaded and used in different formats like PDF, PNG, and JPG. Not only this, it is available in both Standard Screen and Widescreen aspect ratios for your convenience. Therefore, click on the download button now to persuade and impress your audience. Our Professional Photo Printing In Powerpoint And Google Slides Cpb are topically designed to provide an attractive backdrop to any subject. Use them to look like a presentation pro.
Professional Photo Developing Services In Powerpoint And Google Slides Cpb
Presenting our innovatively designed set of slides titled Professional Photo Developing Services In Powerpoint And Google Slides Cpb This completely editable PowerPoint graphic exhibits Professional Photo Developing Services that will help you convey the message impactfully. It can be accessed with Google Slides and is available in both standard screen and widescreen aspect ratios. Apart from this, you can download this well structured PowerPoint template design in different formats like PDF, JPG, and PNG. So, click the download button now to gain full access to this PPT design. Our Professional Photo Developing Services In Powerpoint And Google Slides Cpb are topically designed to provide an attractive backdrop to any subject. Use them to look like a presentation pro.


 Continue with Email

 Home
Home


