Snapshot
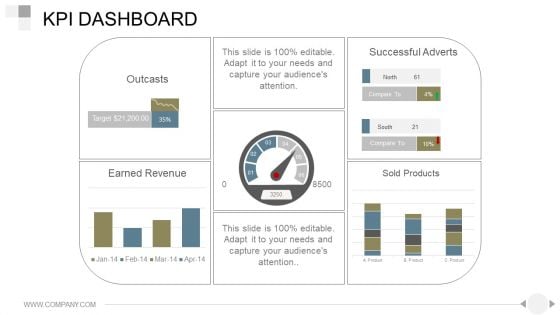
Kpi Dashboard Ppt PowerPoint Presentation Good
This is a kpi dashboard ppt powerpoint presentation good. This is a one stage process. The stages in this process are outcasts, earned revenue, successful adverts, sold products.
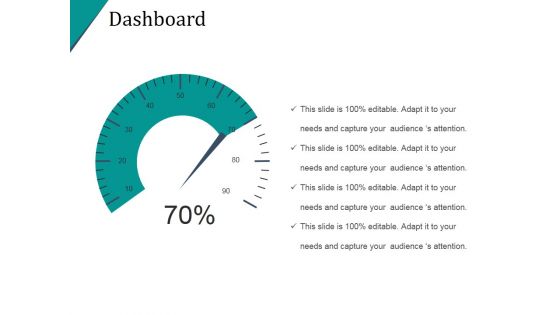
Dashboard Template Ppt PowerPoint Presentation Background Designs
This is a dashboard template ppt powerpoint presentation background designs. This is a three stage process. The stages in this process are low, medium, high.
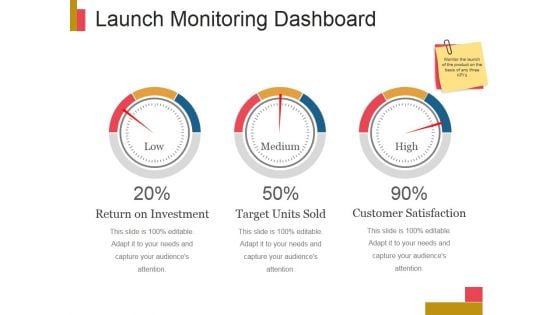
Launch Monitoring Dashboard Ppt PowerPoint Presentation Layout
This is a launch monitoring dashboard ppt powerpoint presentation layout. This is a three stage process. The stages in this process are low, medium, high.
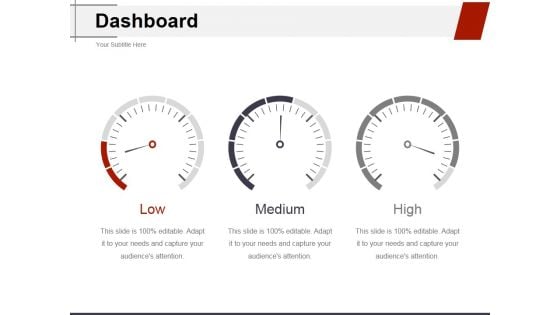
Dashboard Ppt PowerPoint Presentation Outline Model
This is a dashboard ppt powerpoint presentation outline model. This is a three stage process. The stages in this process are medium, high, low.
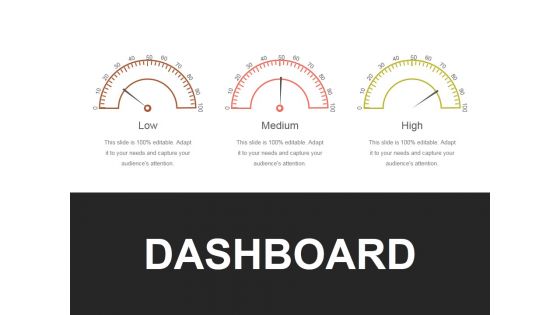
Dashboard Ppt PowerPoint Presentation Show Inspiration
This is a dashboard ppt powerpoint presentation show inspiration. This is a three stage process. The stages in this process are low, medium, high.
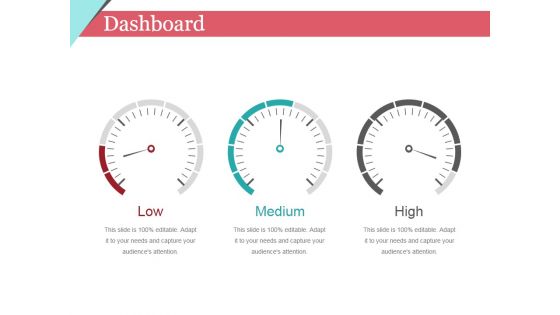
Dashboard Ppt PowerPoint Presentation Summary Template
This is a dashboard ppt powerpoint presentation summary template. This is a three stage process. The stages in this process are low, medium, high.
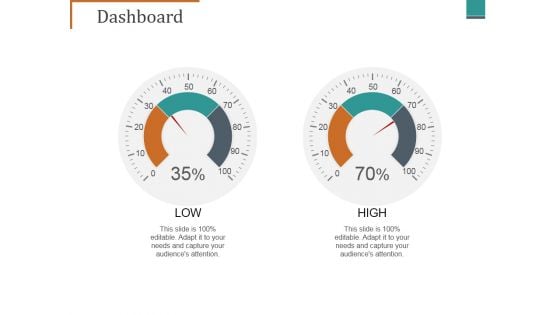
Dashboard Ppt PowerPoint Presentation Ideas Graphics Tutorials
This is a dashboard ppt powerpoint presentation ideas graphics tutorials. This is a two stage process. The stages in this process are low, high.
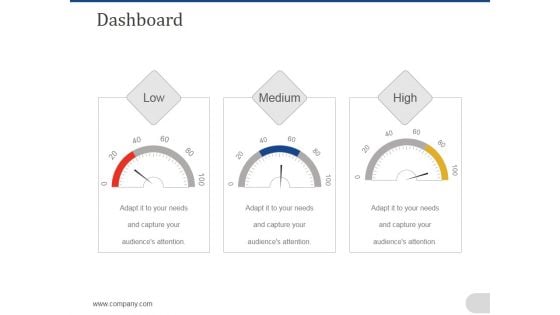
Dashboard Ppt PowerPoint Presentation Show Background Designs
This is a dashboard ppt powerpoint presentation show background designs. This is a three stage process. The stages in this process are low, medium, high.
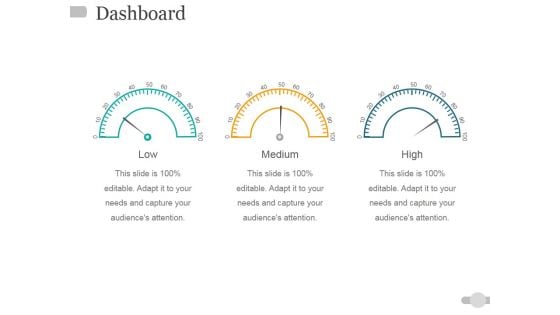
Dashboard Ppt PowerPoint Presentation Show Design Templates
This is a dashboard ppt powerpoint presentation show design templates. This is a three stage process. The stages in this process are low, medium, high.

Dashboard Ppt PowerPoint Presentation Infographics Graphics
This is a dashboard ppt powerpoint presentation infographics graphics. This is a three stage process. The stages in this process are low, medium, high.

Dashboard Ppt PowerPoint Presentation Infographics Graphics Template
This is a dashboard ppt powerpoint presentation infographics graphics template. This is a three stage process. The stages in this process are low, middle, high.
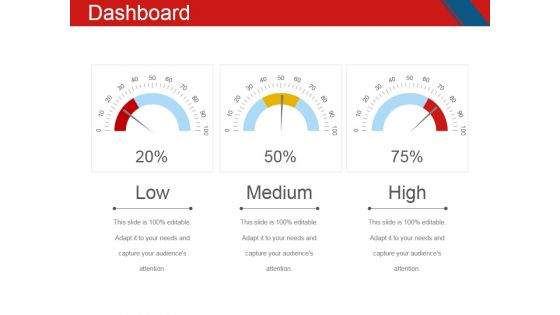
Dashboard Ppt PowerPoint Presentation Outline Topics
This is a dashboard ppt powerpoint presentation outline topics. This is a three stage process. The stages in this process are low, medium, high.

Dashboard Ppt PowerPoint Presentation Gallery Guidelines
This is a dashboard ppt powerpoint presentation gallery guidelines. This is a three stage process. The stages in this process are low, medium, high.
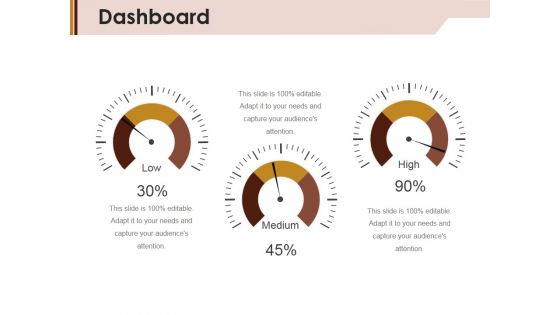
Dashboard Ppt Powerpoint Presentation Portfolio Templates
This is a dashboard ppt powerpoint presentation portfolio templates. This is a three stage process. The stages in this process are low, high, medium.
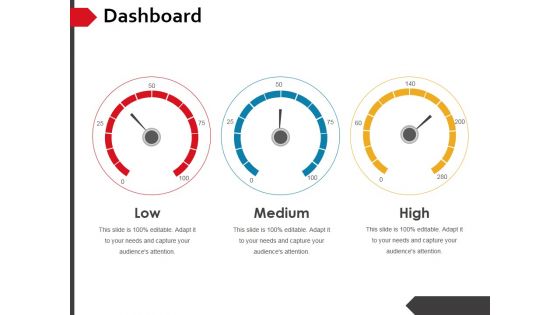
Dashboard Ppt PowerPoint Presentation File Outline
This is a dashboard ppt powerpoint presentation file outline. This is a three stage process. The stages in this process are low, medium, high.
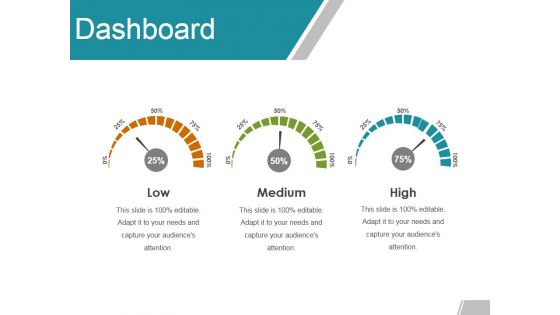
Dashboard Ppt Powerpoint Presentation File Templates
This is a dashboard ppt powerpoint presentation file templates. This is a three stage process. The stages in this process are low, medium, high.

Dashboard Ppt Powerpoint Presentation Infographics Deck
This is a dashboard ppt powerpoint presentation infographics deck. This is a two stage process. The stages in this process are low, high, poor, good, excellent.
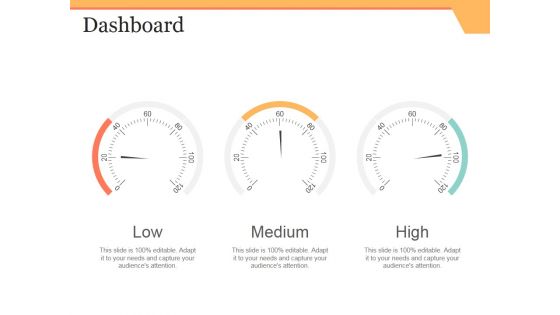
Dashboard Ppt PowerPoint Presentation Summary Slide
This is a dashboard ppt powerpoint presentation summary slide. This is a three stage process. The stages in this process are low, medium, high.
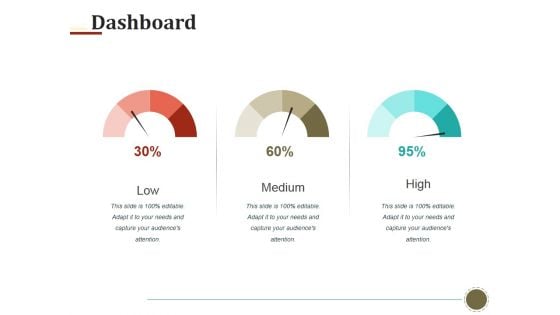
Dashboard Ppt PowerPoint Presentation Outline Examples
This is a dashboard ppt powerpoint presentation outline examples. This is a three stage process. The stages in this process are low, medium, high.

Dashboard Ppt PowerPoint Presentation Summary Portfolio
This is a dashboard ppt powerpoint presentation summary portfolio. This is a three stage process. The stages in this process are low, medium, high.
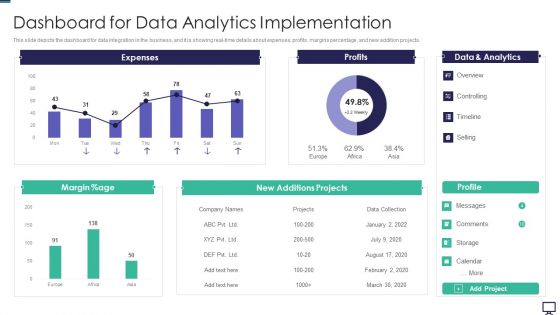
Dashboard For Data Analytics Implementation Ppt Model Files PDF
This slide depicts the dashboard for data integration in the business, and it is showing real time details about expenses, profits, margins percentage, and new addition projects. Deliver and pitch your topic in the best possible manner with this dashboard for data analytics implementation ppt model files pdf. Use them to share invaluable insights on expenses, profits, analytics, data and impress your audience. This template can be altered and modified as per your expectations. So, grab it now.
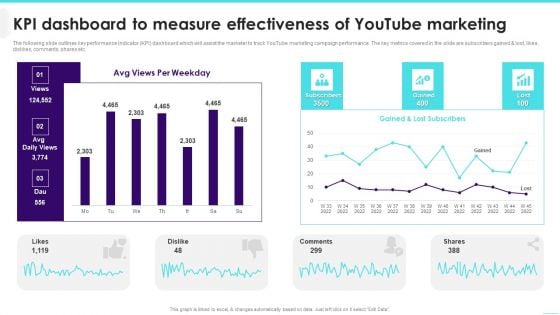
KPI Dashboard To Measure Effectiveness Of Youtube Marketing Inspiration PDF
The following slide outlines key performance indicator KPI dashboard which will assist the marketer to track YouTube marketing campaign performance. The key metrics covered in the slide are subscribers gained lost, likes, dislikes, comments, shares etc.Deliver an awe inspiring pitch with this creative KPI Dashboard To Measure Effectiveness Of Youtube Marketing Inspiration PDF bundle. Topics like Lost Subscribers, Comments, Per Weekday can be discussed with this completely editable template. It is available for immediate download depending on the needs and requirements of the user.
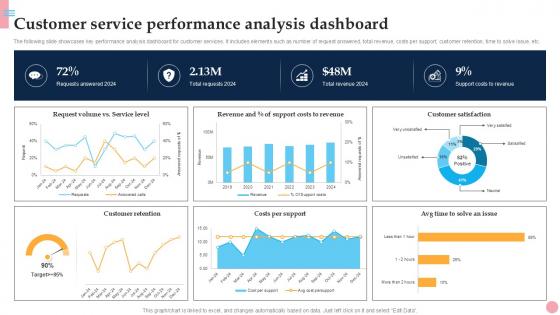
Customer Service Performance How To Improve Company PPT Sample Strategy SS V
The following slide showcases key performance analysis dashboard for customer services. It includes elements such as number of request answered, total revenue, costs per support, customer retention, time to solve issue, etc. Slidegeeks is here to make your presentations a breeze with Customer Service Performance How To Improve Company PPT Sample Strategy SS V With our easy-to-use and customizable templates, you can focus on delivering your ideas rather than worrying about formatting. With a variety of designs to choose from, you are sure to find one that suits your needs. And with animations and unique photos, illustrations, and fonts, you can make your presentation pop. So whether you are giving a sales pitch or presenting to the board, make sure to check out Slidegeeks first The following slide showcases key performance analysis dashboard for customer services. It includes elements such as number of request answered, total revenue, costs per support, customer retention, time to solve issue, etc.
Dashboard For Finance Team Performance Measurement Ppt Icon
This is a dashboard for finance team performance measurement ppt icon. This is a one stage process. The stages in this process are business, strategy, dashboard, marketing, management, process.
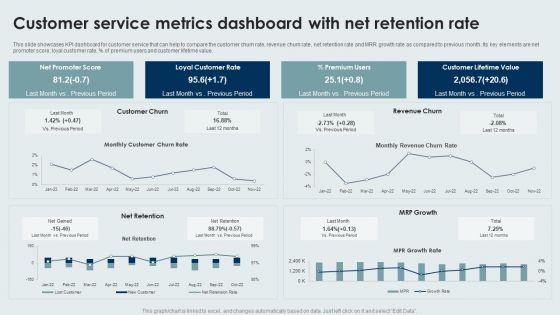
Customer Service Metrics Dashboard With Net Retention Rate Sample PDF
This slide showcases KPI dashboard for customer service that can help to compare the customer churn rate, revenue churn rate, net retention rate and MRR growth rate as compared to previous month. Its key elements are net promoter score, loyal customer rate, percentage of premium users and customer lifetime value. Pitch your topic with ease and precision using this Customer Service Metrics Dashboard With Net Retention Rate Sample PDF. This layout presents information on Loyal Customer Rate, Premium Users, Customer Lifetime Value. It is also available for immediate download and adjustment. So, changes can be made in the color, design, graphics or any other component to create a unique layout.
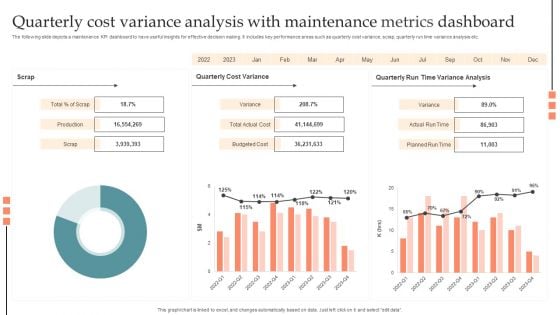
Quarterly Cost Variance Analysis With Maintenance Metrics Dashboard Information PDF
The following slide depicts a maintenance KPI dashboard to have useful insights for effective decision making. It includes key performance areas such as quarterly cost variance, scrap, quarterly run time variance analysis etc. Pitch your topic with ease and precision using this Quarterly Cost Variance Analysis With Maintenance Metrics Dashboard Information PDF. This layout presents information on Production, Budgeted Cost, Planned Run Time, Actual Run Time. It is also available for immediate download and adjustment. So, changes can be made in the color, design, graphics or any other component to create a unique layout.
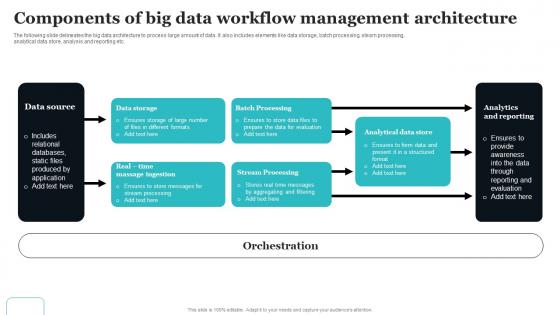
Components Of Big Data Workflow Management Architecture Elements Pdf
The following slide delineates the big data architecture to process large amount of data. It also includes elements like data storage, batch processing, steam processing, analytical data store, analysis and reporting etc. Pitch your topic with ease and precision using this Components Of Big Data Workflow Management Architecture Elements Pdf This layout presents information on Data Source, Batch Processing, Stream Processing It is also available for immediate download and adjustment. So, changes can be made in the color, design, graphics or any other component to create a unique layout. The following slide delineates the big data architecture to process large amount of data. It also includes elements like data storage, batch processing, steam processing, analytical data store, analysis and reporting etc.
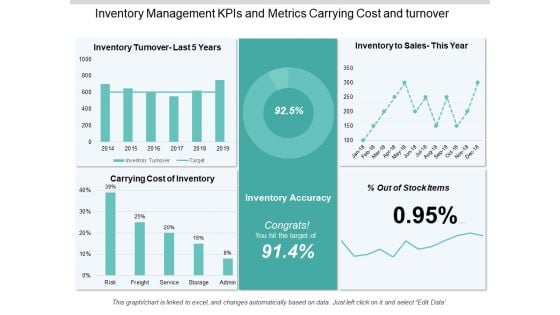
Inventory Management Kpis And Metrics Carrying Cost And Turnover Ppt PowerPoint Presentation Information
This is a inventory management kpis and metrics carrying cost and turnover ppt powerpoint presentation information. This is a five stage process. The stages in this process are logistics performance, logistics dashboard, logistics kpis.
Logistics Kpis And Metrics Percentage Of Orders Delivered Ppt PowerPoint Presentation Icon
This is a logistics kpis and metrics percentage of orders delivered ppt powerpoint presentation icon. This is a five stage process. The stages in this process are logistics performance, logistics dashboard, logistics kpis.
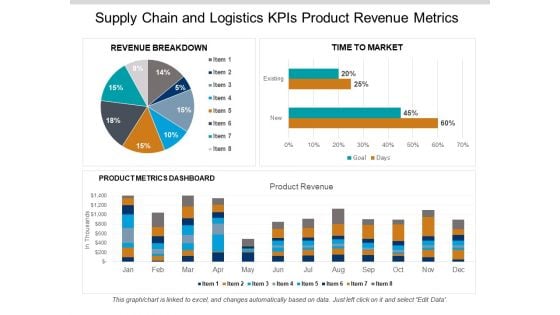
Supply Chain And Logistics Kpis Product Revenue Metrics Ppt PowerPoint Presentation Gallery Aids
This is a supply chain and logistics kpis product revenue metrics ppt powerpoint presentation gallery aids. This is a three stage process. The stages in this process are logistics performance, logistics dashboard, logistics kpis.
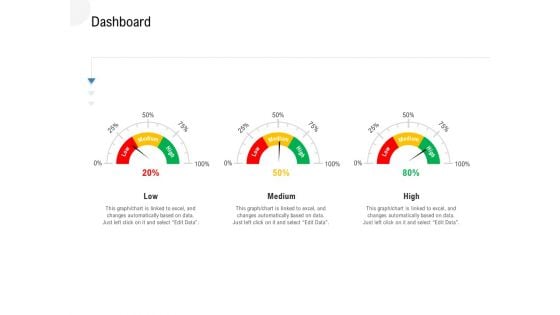
API Outline Dashboard Ppt Show Guidelines PDF
This is a api outline dashboard ppt show guidelines pdf template with various stages. Focus and dispense information on three stages using this creative set, that comes with editable features. It contains large content boxes to add your information on topic like dashboard. You can also showcase facts, figures, and other relevant content using this PPT layout. Grab it now.
Marketing Dashboard Template Ppt Icon Files PDF
Presenting marketing dashboard template ppt icon files pdf to provide visual cues and insights. Share and navigate important information on three stages that need your due attention. This template can be used to pitch topics like marketing dashboard. In addition, this PPT design contains high-resolution images, graphics, etc, that are easily editable and available for immediate download.

Amalgamation Acquisitions Dashboard Ppt Styles Guidelines PDF
This is a amalgamation acquisitions dashboard ppt styles guidelines pdf template with various stages. Focus and dispense information on three stages using this creative set, that comes with editable features. It contains large content boxes to add your information on topic like dashboard. You can also showcase facts, figures, and other relevant content using this PPT layout. Grab it now.
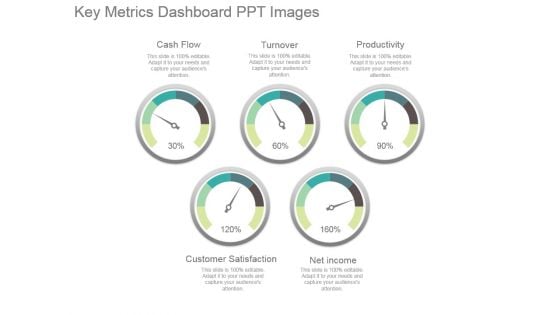
Key Metrics Dashboard Ppt Images
This is a key metrics dashboard ppt images. This is a five stage process. The stages in this process are cash flow, turnover, productivity, net income, customer satisfaction.
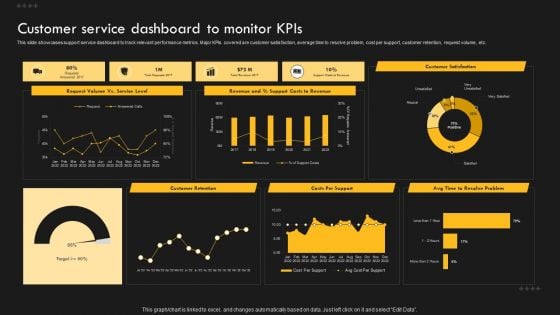
Service Improvement Techniques For Client Retention Customer Service Dashboard To Monitor Kpis Clipart PDF
This slide showcases support service dashboard to track relevant performance metrics. Major KPIs covered are customer satisfaction, average time to resolve problem, cost per support, customer retention, request volume, etc. Do you have an important presentation coming up. Are you looking for something that will make your presentation stand out from the rest. Look no further than Service Improvement Techniques For Client Retention Customer Service Dashboard To Monitor Kpis Clipart PDF. With our professional designs, you can trust that your presentation will pop and make delivering it a smooth process. And with Slidegeeks, you can trust that your presentation will be unique and memorable. So why wait. Grab Service Improvement Techniques For Client Retention Customer Service Dashboard To Monitor Kpis Clipart PDF today and make your presentation stand out from the rest.
Cloud Performance Tracking Dashboard Professional PDF
This slide covers the Key performance indicators for tracking performance of the cloud such as violations break down, sources, rules and severity. Deliver an awe inspiring pitch with this creative Cloud Performance Tracking Dashboard Professional PDF bundle. Topics like Cloud Performance, Tracking Dashboard can be discussed with this completely editable template. It is available for immediate download depending on the needs and requirements of the user.
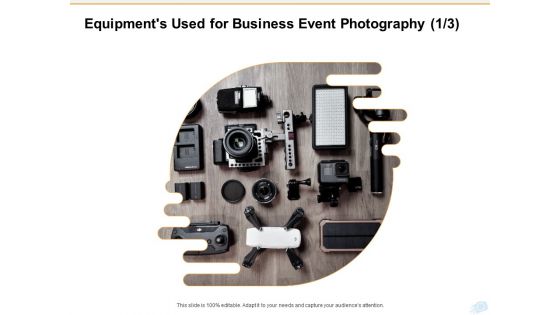
Corporate Occasion Videography Proposal Equipments Used For Business Event Photography Adapt Sample PDF
Deliver an awe inspiring pitch with this creative corporate occasion videography proposal equipments used for business event photography adapt sample pdf bundle. Topics like equipments used for business event photography can be discussed with this completely editable template. It is available for immediate download depending on the needs and requirements of the user.
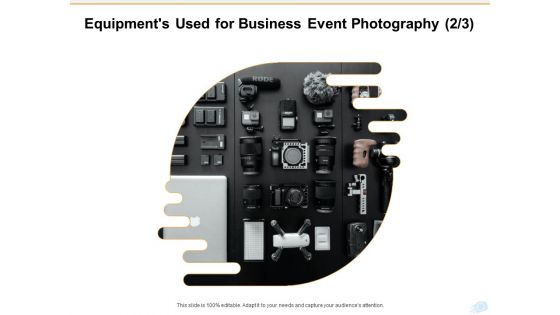
Corporate Occasion Videography Proposal Equipments Used For Business Event Photography Capture Inspiration PDF
Deliver an awe inspiring pitch with this creative corporate occasion videography proposal equipments used for business event photography capture inspiration pdf bundle. Topics like equipments used for business event photography can be discussed with this completely editable template. It is available for immediate download depending on the needs and requirements of the user.
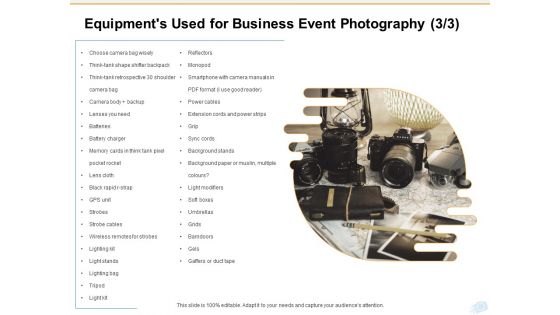
Corporate Occasion Videography Proposal Equipments Used For Business Event Photography Grids Professional PDF
Deliver an awe inspiring pitch with this creative corporate occasion videography proposal equipments used for business event photography grids professional pdf bundle. Topics like equipments used for business event photography can be discussed with this completely editable template. It is available for immediate download depending on the needs and requirements of the user.

Corporate Occasion Videography Proposal Getting Started With Business Event Photography Themes PDF
Deliver and pitch your topic in the best possible manner with this corporate occasion videography proposal getting started with business event photography themes pdf. Use them to share invaluable insights on getting started with business event photography and impress your audience. This template can be altered and modified as per your expectations. So, grab it now.
Dashboard For Tracking Customer Service Team Performance Consumer Contact Point Guide Diagrams PDF
This slide covers the KPI dashboard for analyzing the performance of client support department. It includes metrics such as first call resolution, unresolved calls, average response rate, the best day to call, average time to solve issues, etc. The Dashboard For Tracking Customer Service Team Performance Consumer Contact Point Guide Diagrams PDF is a compilation of the most recent design trends as a series of slides. It is suitable for any subject or industry presentation, containing attractive visuals and photo spots for businesses to clearly express their messages. This template contains a variety of slides for the user to input data, such as structures to contrast two elements, bullet points, and slides for written information. Slidegeeks is prepared to create an impression.
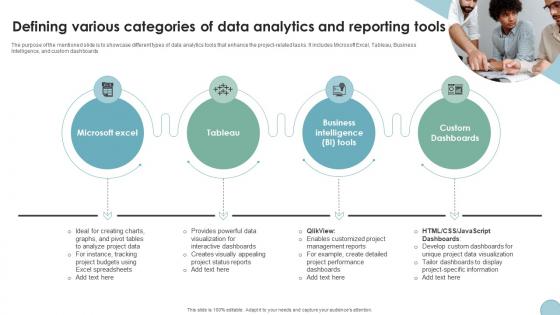
Defining Various Categories Of Data Analytics Digital Transformation In Project Management
The purpose of the mentioned slide is to showcase different types of data analytics tools that enhance the project-related tasks. It includes Microsoft Excel, Tableau, Business Intelligence, and custom dashboards. Slidegeeks is here to make your presentations a breeze with Defining Various Categories Of Data Analytics Digital Transformation In Project Management With our easy-to-use and customizable templates, you can focus on delivering your ideas rather than worrying about formatting. With a variety of designs to choose from, you are sure to find one that suits your needs. And with animations and unique photos, illustrations, and fonts, you can make your presentation pop. So whether you are giving a sales pitch or presenting to the board, make sure to check out Slidegeeks first The purpose of the mentioned slide is to showcase different types of data analytics tools that enhance the project-related tasks. It includes Microsoft Excel, Tableau, Business Intelligence, and custom dashboards.
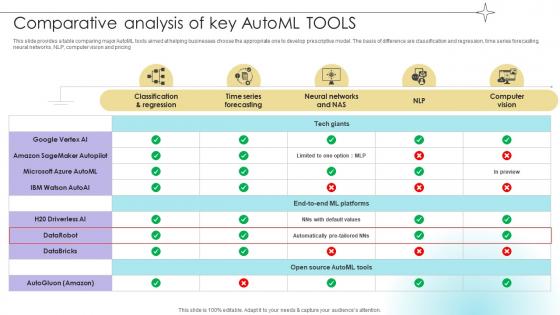
Comparative Analysis Of Key Automl Tools Data Analytics SS V
This slide provides a table comparing major AutoML tools aimed at helping businesses choose the appropriate one to develop prescriptive model. The basis of difference are classification and regression, time series forecasting, neural networks, NLP, computer vision and pricing.The Comparative Analysis Of Key Automl Tools Data Analytics SS V is a compilation of the most recent design trends as a series of slides. It is suitable for any subject or industry presentation, containing attractive visuals and photo spots for businesses to clearly express their messages. This template contains a variety of slides for the user to input data, such as structures to contrast two elements, bullet points, and slides for written information. Slidegeeks is prepared to create an impression. This slide provides a table comparing major AutoML tools aimed at helping businesses choose the appropriate one to develop prescriptive model. The basis of difference are classification and regression, time series forecasting, neural networks, NLP, computer vision and pricing.
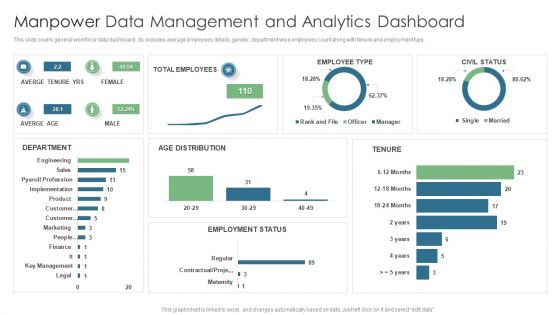
Manpower Data Management And Analytics Dashboard Topics PDF
This slide covers general workforce data dashboard . Its includes average employees details, gender, department wise employees count along with tenure and employment type. Pitch your topic with ease and precision using this Manpower Data Management And Analytics Dashboard Topics PDF. This layout presents information on Total Employees, Averge Tenure Yrs, Employee Type. It is also available for immediate download and adjustment. So, changes can be made in the color, design, graphics or any other component to create a unique layout.
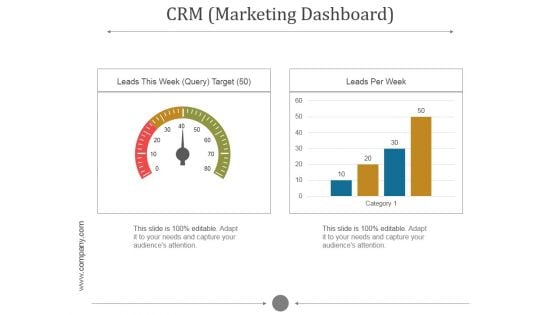
Crm Marketing Dashboard Ppt PowerPoint Presentation Templates
This is a crm marketing dashboard ppt powerpoint presentation templates. This is a two stage process. The stages in this process are leads this week query target, leads per week.
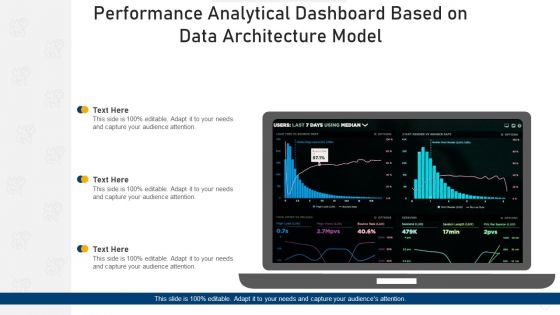
Performance Analytical Dashboard Based On Data Architecture Model Elements PDF
Persuade your audience using this performance analytical dashboard based on data architecture model elements pdf. This PPT design covers one stages, thus making it a great tool to use. It also caters to a variety of topics including performance analytical dashboard based on data architecture model. Download this PPT design now to present a convincing pitch that not only emphasizes the topic but also showcases your presentation skills.
Statistical Data Dashboard Icon Depicting Analytical Figures Sample PDF
Persuade your audience using this statistical data dashboard icon depicting analytical figures sample pdf. This PPT design covers four stages, thus making it a great tool to use. It also caters to a variety of topics including statistical data dashboard icon depicting analytical figures. Download this PPT design now to present a convincing pitch that not only emphasizes the topic but also showcases your presentation skills.
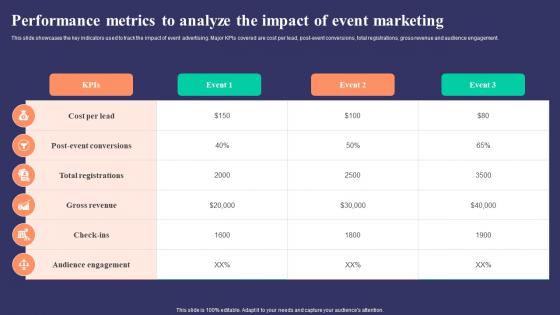
Performance Metrics To Analyze The Impact Strategies To Develop Successful Clipart Pdf
This slide showcases the key indicators used to track the impact of event advertising. Major KPIs covered are cost per lead, post event conversions, total registrations, gross revenue and audience engagement.Make sure to capture your audiences attention in your business displays with our gratis customizable Performance Metrics To Analyze The Impact Strategies To Develop Successful Clipart Pdf. These are great for business strategies, office conferences, capital raising or task suggestions. If you desire to acquire more customers for your tech business and ensure they stay satisfied, create your own sales presentation with these plain slides. This slide showcases the key indicators used to track the impact of event advertising. Major KPIs covered are cost per lead, post event conversions, total registrations, gross revenue and audience engagement.
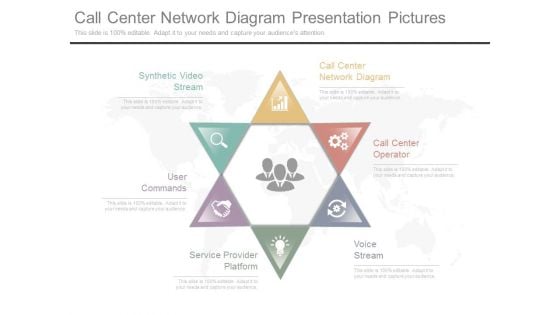
Call Center Network Diagram Presentation Pictures
This is a call center network diagram presentation pictures. This is a six stage process. The stages in this process are synthetic video stream, call center network diagram, user commands, call center operator, service provider platform, voice stream.
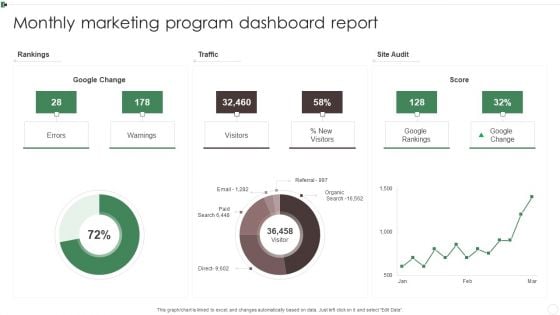
Monthly Marketing Program Dashboard Report Ppt Inspiration Information PDF
This graph or chart is linked to excel, and changes automatically based on data. Just left click on it and select Edit Data. Pitch your topic with ease and precision using this Monthly Marketing Program Dashboard Report Ppt Inspiration Information PDF. This layout presents information on Rankings, Traffic, Site Audit, Warnings. It is also available for immediate download and adjustment. So, changes can be made in the color, design, graphics or any other component to create a unique layout.
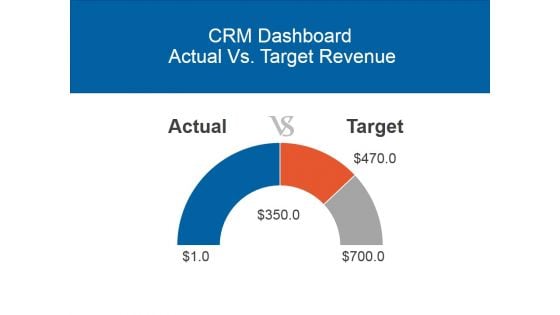
Crm Dashboard Actual Vs Target Revenue Ppt PowerPoint Presentation Guidelines
This is a crm dashboard actual vs target revenue ppt powerpoint presentation guidelines. This is a three stage process. The stages in this process are actual, target.
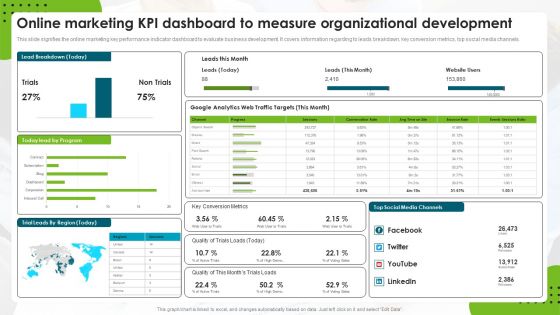
Online Marketing Kpi Dashboard To Measure Organizational Development Rules PDF
This slide signifies the online marketing key performance indicator dashboard to evaluate business development. It covers information regarding to leads breakdown, key conversion metrics, top social media channels. Pitch your topic with ease and precision using this Online Marketing Kpi Dashboard To Measure Organizational Development Rules PDF. This layout presents information on Web Traffic Targets, Google Analytics, Social Media Channels. It is also available for immediate download and adjustment. So, changes can be made in the color, design, graphics or any other component to create a unique layout.
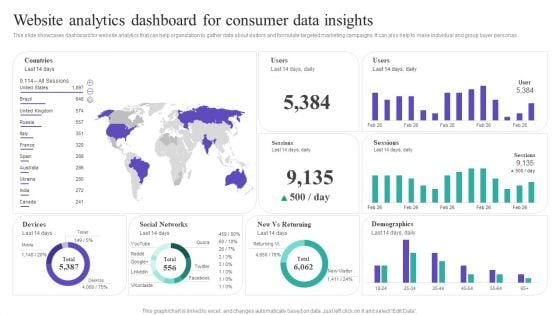
Website Analytics Dashboard For Consumer Data Insights Template PDF
This slide showcases dashboard for website analytics that can help organization to gather data about visitors and formulate targeted marketing campaigns. It can also help to make individual and group buyer personas Here you can discover an assortment of the finest PowerPoint and Google Slides templates. With these templates, you can create presentations for a variety of purposes while simultaneously providing your audience with an eye-catching visual experience. Download Website Analytics Dashboard For Consumer Data Insights Template PDF to deliver an impeccable presentation. These templates will make your job of preparing presentations much quicker, yet still, maintain a high level of quality. Slidegeeks has experienced researchers who prepare these templates and write high-quality content for you. Later on, you can personalize the content by editing the Website Analytics Dashboard For Consumer Data Insights Template PDF.
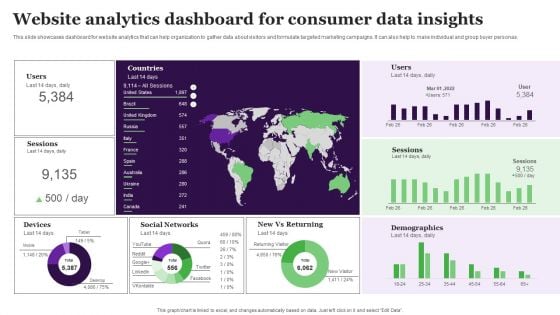
Website Analytics Dashboard For Consumer Data Insights Clipart PDF
This slide showcases dashboard for website analytics that can help organization to gather data about visitors and formulate targeted marketing campaigns. It can also help to make individual and group buyer personas. Want to ace your presentation in front of a live audience Our Website Analytics Dashboard For Consumer Data Insights Clipart PDF can help you do that by engaging all the users towards you.. Slidegeeks experts have put their efforts and expertise into creating these impeccable powerpoint presentations so that you can communicate your ideas clearly. Moreover, all the templates are customizable, and easy-to-edit and downloadable. Use these for both personal and commercial use.
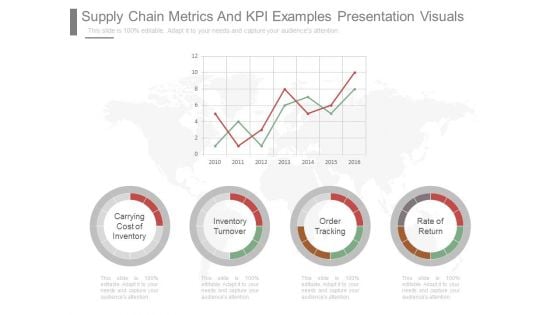
Supply Chain Metrics And Kpi Examples Presentation Visuals
This is a supply chain metrics and kpi examples presentation visuals. This is a four stage process. The stages in this process are carrying cost of inventory, inventory turnover, order tracking, rate of return.
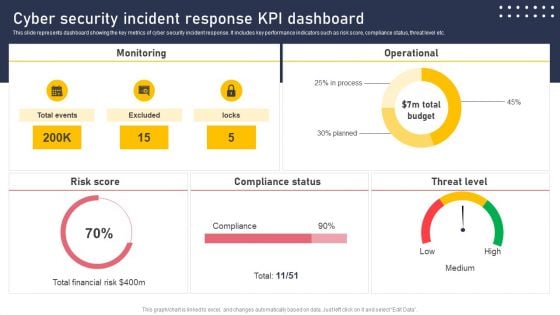
Cyber Security Incident Response KPI Dashboard Microsoft PDF
This slide represents dashboard showing the key metrics of cyber security incident response. It includes key performance indicators such as risk score, compliance status, threat level etc. Slidegeeks has constructed Cyber Security Incident Response KPI Dashboard Microsoft PDF after conducting extensive research and examination. These presentation templates are constantly being generated and modified based on user preferences and critiques from editors. Here, you will find the most attractive templates for a range of purposes while taking into account ratings and remarks from users regarding the content. This is an excellent jumping off point to explore our content and will give new users an insight into our top notch PowerPoint Templates.
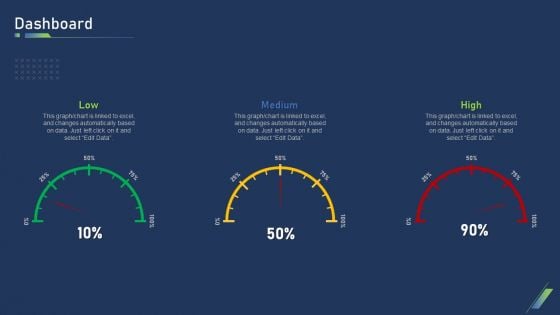
Using Bots Marketing Strategy Dashboard Infographics PDF
This is a using bots marketing strategy dashboard infographics pdf template with various stages. Focus and dispense information on three stages using this creative set, that comes with editable features. It contains large content boxes to add your information on topics like low, medium, high. You can also showcase facts, figures, and other relevant content using this PPT layout. Grab it now.
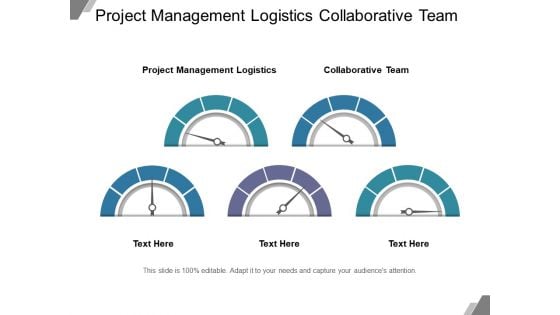
Project Management Logistics Collaborative Team Ppt PowerPoint Presentation Professional Graphics Pictures
This is a project management logistics collaborative team ppt powerpoint presentation professional graphics pictures. This is a five stage process. The stages in this process are project, management, logistics, collaborative, team.
3 Point Dashboard For Project Management Ppt PowerPoint Presentation Icon
This is a 3 point dashboard for project management ppt powerpoint presentation icon. This is a three stage process. The stages in this process are business, marketing, technology, measure, success.
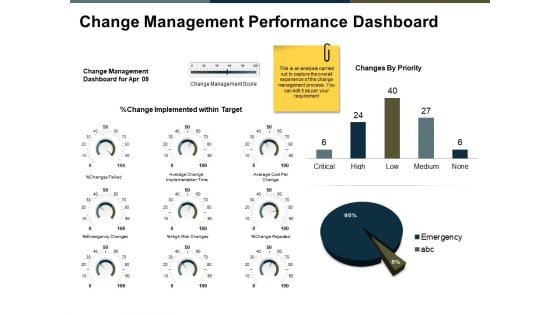
Change Management Performance Dashboard Ppt PowerPoint Presentation Professional Portrait
This is a change management performance dashboard ppt powerpoint presentation professional portrait. This is a three stage process. The stages in this process are finance, marketing, analysis, business, investment.


 Continue with Email

 Home
Home


