Snapshot
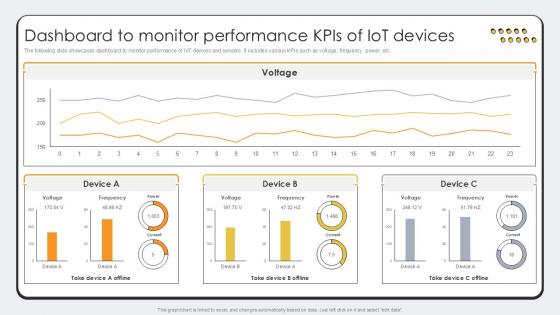
Dashboard To Monitor Performance Revolutionizing Production IoT Ppt Template
The following slide showcases dashboard to monitor performance of IoT devices and sensors. It includes various KPIs such as voltage, frequency, power, etc. Find highly impressive Dashboard To Monitor Performance Revolutionizing Production IoT Ppt Template on Slidegeeks to deliver a meaningful presentation. You can save an ample amount of time using these presentation templates. No need to worry to prepare everything from scratch because Slidegeeks experts have already done a huge research and work for you. You need to download Dashboard To Monitor Performance Revolutionizing Production IoT Ppt Template for your upcoming presentation. All the presentation templates are 100 percent editable and you can change the color and personalize the content accordingly. Download now The following slide showcases dashboard to monitor performance of IoT devices and sensors. It includes various KPIs such as voltage, frequency, power, etc.

Business Customer Marketing Ppt Powerpoint Presentation Summary Background Image Cpb
This is a business customer marketing ppt powerpoint presentation summary background image cpb. This is a two stage process. The stages in this process are business to customer marketing.
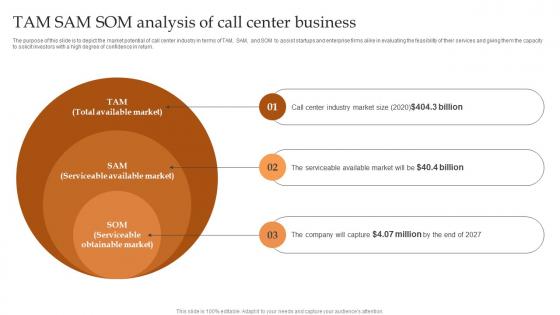
Tam Sam Som Analysis Of Call Center Business IT And Tech Support Business Ideas Pdf
The purpose of this slide is to depict the market potential of call center industry in terms of TAM, SAM, and SOM to assist startups and enterprise firms alike in evaluating the feasibility of their services and giving them the capacity to solicit investors with a high degree of confidence in return. From laying roadmaps to briefing everything in detail, our templates are perfect for you. You can set the stage with your presentation slides. All you have to do is download these easy-to-edit and customizable templates. Tam Sam Som Analysis Of Call Center Business IT And Tech Support Business Ideas Pdf will help you deliver an outstanding performance that everyone would remember and praise you for. Do download this presentation today. The purpose of this slide is to depict the market potential of call center industry in terms of TAM, SAM, and SOM to assist startups and enterprise firms alike in evaluating the feasibility of their services and giving them the capacity to solicit investors with a high degree of confidence in return.
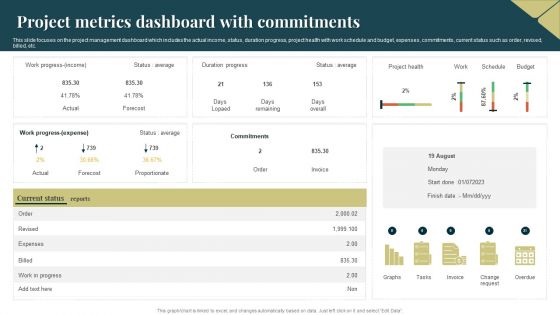
Project Metrics Dashboard With Commitments Mockup PDF
This slide focuses on the project management dashboard which includes the actual income, status, duration progress, project health with work schedule and budget, expenses, commitments, current status such as order, revised, billed, etc. Showcasing this set of slides titled Project Metrics Dashboard With Commitments Mockup PDF. The topics addressed in these templates are Expenses, Budget, Average. All the content presented in this PPT design is completely editable. Download it and make adjustments in color, background, font etc. as per your unique business setting.
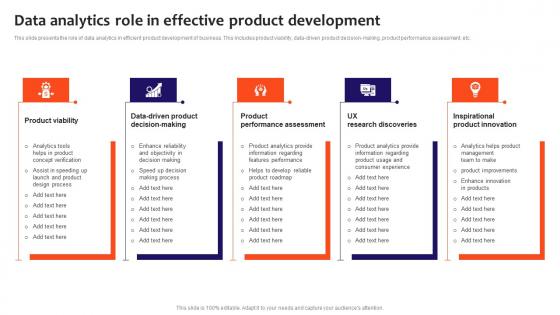
Data Analytics Role In Effective Product Development Slides Pdf
This slide presents the role of data analytics in efficient product development of business. This includes product viability, data driven product decision making, product performance assessment, etc. Pitch your topic with ease and precision using this Data Analytics Role In Effective Product Development Slides Pdf. This layout presents information on Product Viability, Product Performance, Inspirational Product Innovation. It is also available for immediate download and adjustment. So, changes can be made in the color, design, graphics or any other component to create a unique layout. This slide presents the role of data analytics in efficient product development of business. This includes product viability, data driven product decision making, product performance assessment, etc.
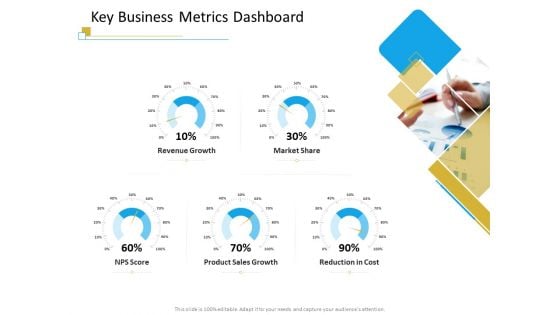
Successful Mobile Strategies For Business Key Business Metrics Dashboard Background PDF
Deliver and pitch your topic in the best possible manner with this successful mobile strategies for business key business metrics dashboard background pdf. Use them to share invaluable insights on revenue, growth, sales, cost, market and impress your audience. This template can be altered and modified as per your expectations. So, grab it now.
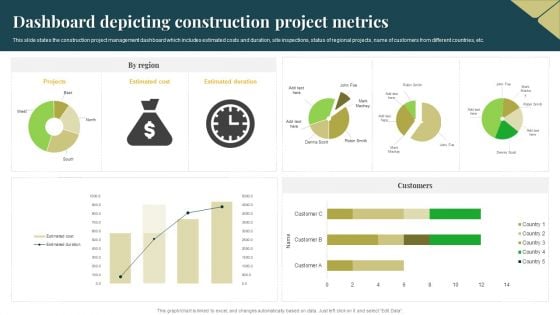
Dashboard Depicting Construction Project Metrics Inspiration PDF
This slide states the construction project management dashboard which includes estimated costs and duration, site inspections, status of regional projects, name of customers from different countries, etc. Pitch your topic with ease and precision using this Dashboard Depicting Construction Project Metrics Inspiration PDF. This layout presents information on Estimated Cost, Estimated Duration, Projects. It is also available for immediate download and adjustment. So, changes can be made in the color, design, graphics or any other component to create a unique layout.
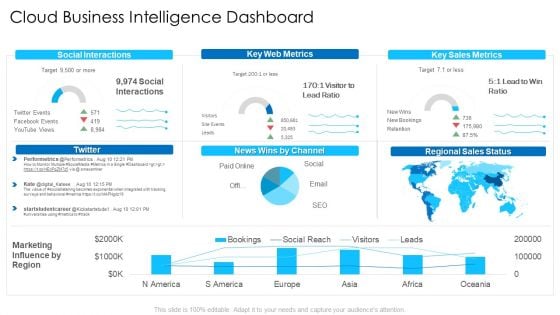
Cloud Business Intelligence Dashboard Microsoft PDF
Deliver an awe inspiring pitch with this creative cloud business intelligence dashboard microsoft pdf bundle. Topics like social interactions, key web metrics, regional sales status can be discussed with this completely editable template. It is available for immediate download depending on the needs and requirements of the user.
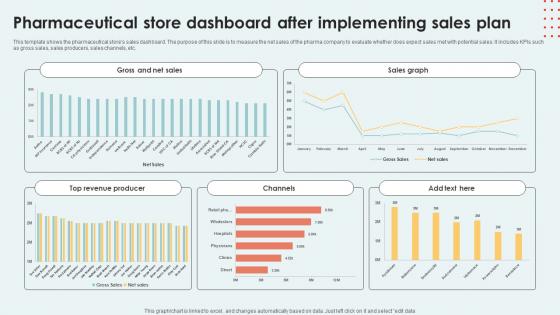
Pharmaceutical Store Dashboard After Implementing Sales Plan Inspiration Pdf
This template shows the pharmaceutical stores sales dashboard. The purpose of this slide is to measure the net sales of the pharma company to evaluate whether does expect sales met with potential sales. It includes KPIs such as gross sales, sales producers, sales channels, etc.Pitch your topic with ease and precision using this Pharmaceutical Store Dashboard After Implementing Sales Plan Inspiration Pdf This layout presents information on Gross Net Sales, Sales Graph, Top Revenue Producer It is also available for immediate download and adjustment. So, changes can be made in the color, design, graphics or any other component to create a unique layout. This template shows the pharmaceutical stores sales dashboard. The purpose of this slide is to measure the net sales of the pharma company to evaluate whether does expect sales met with potential sales. It includes KPIs such as gross sales, sales producers, sales channels, etc.

Project Change Management Kpi Dashboard Strategies For Success In Digital
This slide represents KPI dashboard to effectively track and monitor effectiveness of changes implemented in organizational projects. It includes details related to KPIs such as changes investigated, submitted, approved, declined, etc. Slidegeeks has constructed Project Change Management Kpi Dashboard Strategies For Success In Digital after conducting extensive research and examination. These presentation templates are constantly being generated and modified based on user preferences and critiques from editors. Here, you will find the most attractive templates for a range of purposes while taking into account ratings and remarks from users regarding the content. This is an excellent jumping-off point to explore our content and will give new users an insight into our top-notch PowerPoint Templates. This slide represents KPI dashboard to effectively track and monitor effectiveness of changes implemented in organizational projects. It includes details related to KPIs such as changes investigated, submitted, approved, declined, etc.
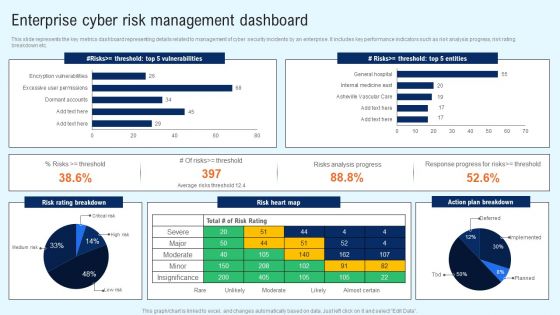
Implementing Cyber Security Incident Enterprise Cyber Risk Dashboard Professional PDF
This slide represents the key metrics dashboard representing details related to management of cyber security incidents by an enterprise. It includes key performance indicators such as risk analysis progress, risk rating breakdown etc. Do you have an important presentation coming up Are you looking for something that will make your presentation stand out from the rest Look no further than Implementing Cyber Security Incident Enterprise Cyber Risk Dashboard Professional PDF. With our professional designs, you can trust that your presentation will pop and make delivering it a smooth process. And with Slidegeeks, you can trust that your presentation will be unique and memorable. So why wait Grab Implementing Cyber Security Incident Enterprise Cyber Risk Dashboard Professional PDF today and make your presentation stand out from the rest.
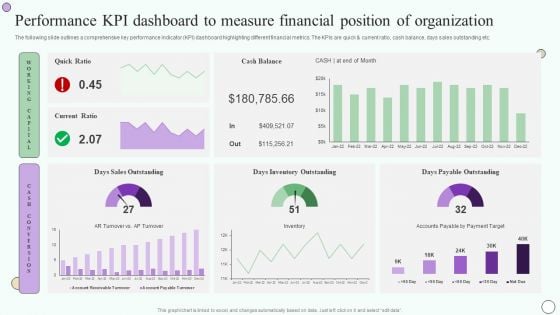
Estimating Business Overall Performance Kpi Dashboard To Measure Financial Position Inspiration PDF
The following slide outlines a comprehensive key performance indicator KPI dashboard highlighting different financial metrics. The KPIs are quick and current ratio, cash balance, days sales outstanding etc. Welcome to our selection of the Estimating Business Overall Performance Kpi Dashboard To Measure Financial Position Inspiration PDF. These are designed to help you showcase your creativity and bring your sphere to life. Planning and Innovation are essential for any business that is just starting out. This collection contains the designs that you need for your everyday presentations. All of our PowerPoints are 100 percent editable, so you can customize them to suit your needs. This multi-purpose template can be used in various situations. Grab these presentation templates today.
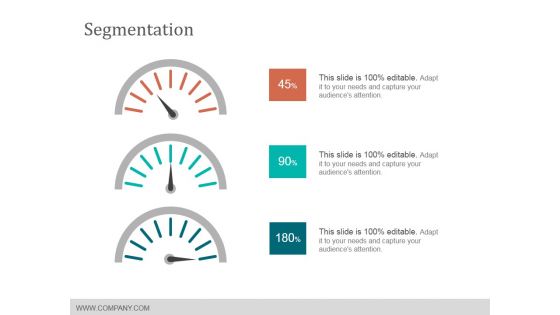
Segmentation Ppt PowerPoint Presentation Pictures Templates
This is a segmentation ppt powerpoint presentation pictures templates. This is a three stage process. The stages in this process are dashboard, business, measurement, finance.
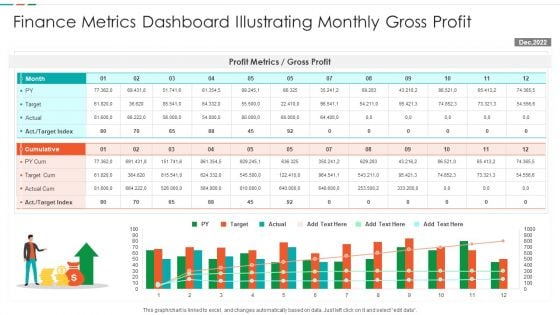
Finance Metrics Dashboard Illustrating Monthly Gross Profit Formats PDF
This graph or chart is linked to excel, and changes automatically based on data. Just left click on it and select edit data. Showcasing this set of slides titled Finance Metrics Dashboard Illustrating Monthly Gross Profit Formats PDF. The topics addressed in these templates are Profit Metrics Gross, Profit Target Cum, Actual Cum Target. All the content presented in this PPT design is completely editable. Download it and make adjustments in color, background, font etc. as per your unique business setting.

Current Status Of Product Ppt PowerPoint Presentation Diagrams
This is a current status of product ppt powerpoint presentation diagrams. This is a three stage process. The stages in this process are product, business, marketing, management, dashboard.
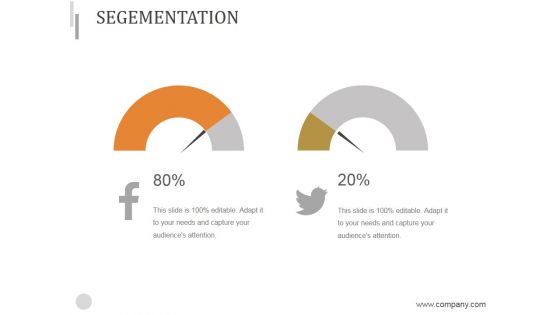
Segementation Ppt PowerPoint Presentation Images
This is a segementation ppt powerpoint presentation images. This is a two stage process. The stages in this process are segmentation, dashboard, management, business, marketing.
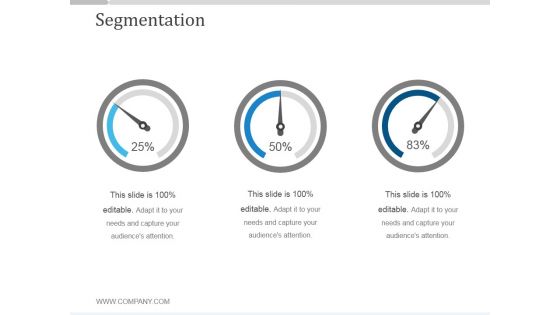
Segmentation Ppt PowerPoint Presentation Shapes
This is a segmentation ppt powerpoint presentation shapes. This is a three stage process. The stages in this process are dashboard, measure, management, business, finance.

Customer Service Benchmarking Ppt PowerPoint Presentation Inspiration
This is a customer service benchmarking ppt powerpoint presentation inspiration. This is a three stage process. The stages in this process are business, marketing, success, dashboard, technology.
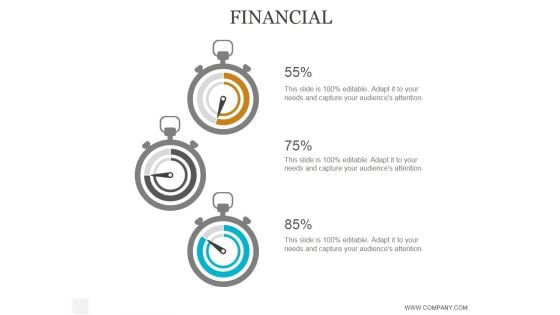
Financial Ppt PowerPoint Presentation Background Designs
This is a financial ppt powerpoint presentation background designs. This is a five stage process. The stages in this process are business, strategy, marketing, analysis, success, finance, dashboard.
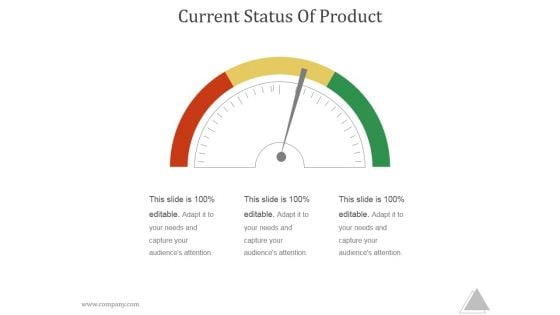
Current Status Of Product Ppt PowerPoint Presentation Templates
This is a current status of product ppt powerpoint presentation templates. This is a three stage process. The stages in this process are business, marketing, dashboard, measure.
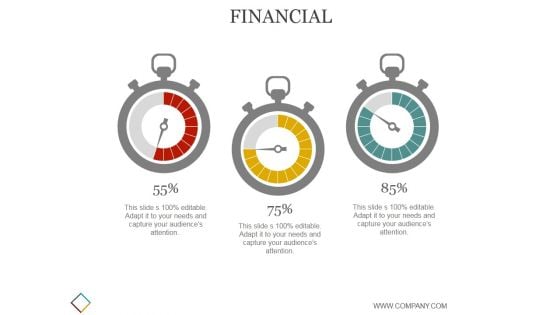
Financial Ppt PowerPoint Presentation Guide
This is a financial ppt powerpoint presentation guide. This is a three stage process. The stages in this process are business, strategy, marketing, analysis, dashboard, measuring.
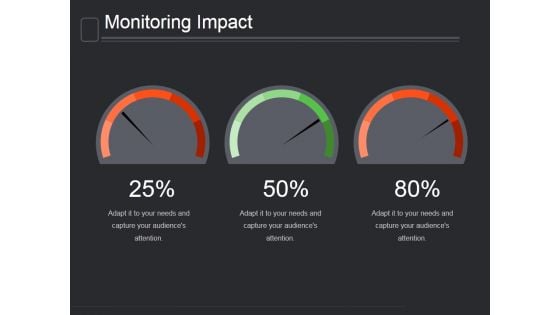
Monitoring Impact Ppt PowerPoint Presentation Background Image
This is a monitoring impact ppt powerpoint presentation background image. This is a three stage process. The stages in this process are business, marketing, management, dashboard, measure.
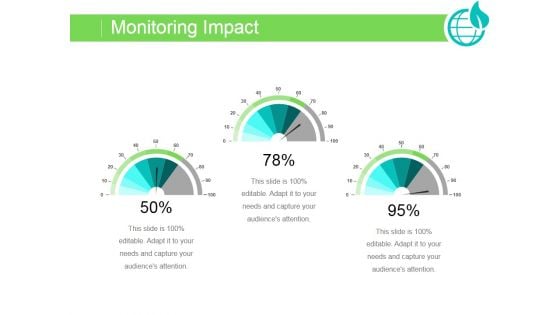
Monitoring Impact Ppt PowerPoint Presentation Example
This is a monitoring impact ppt powerpoint presentation example. This is a three stage process. The stages in this process are business, strategy, marketing, analysis, dashboard.
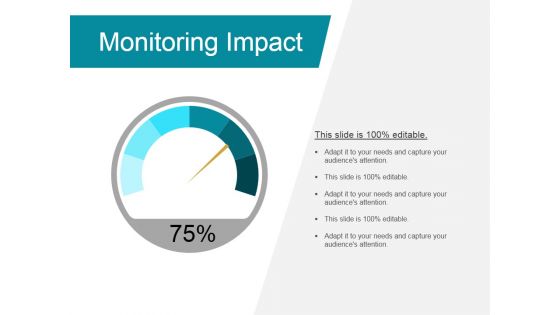
Monitoring Impact Ppt PowerPoint Presentation Professional
This is a monitoring impact ppt powerpoint presentation professional. This is a one stage process. The stages in this process are finance, dashboard, measurement, business.
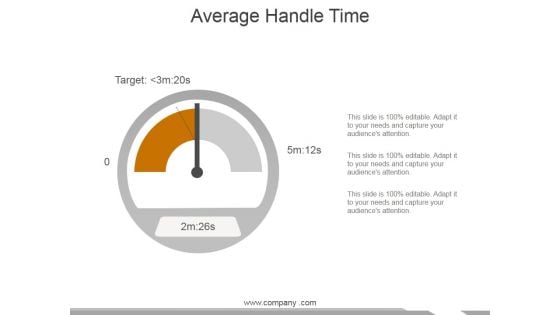
Average Handle Time Ppt PowerPoint Presentation Ideas Show
This is a average handle time ppt powerpoint presentation ideas show. This is a three stage process. The stages in this process are dashboard, business, marketing, measure.
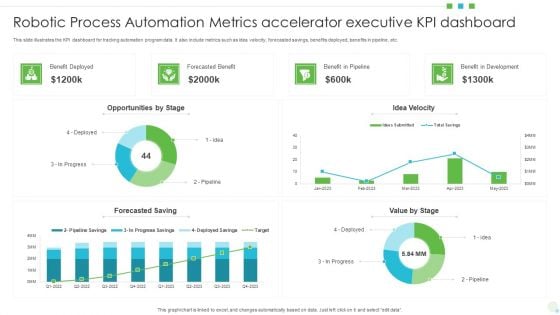
Robotic Process Automation Metrics Accelerator Executive KPI Dashboard Formats PDF
This slide illustrates the KPI dashboard for tracking automation program data. It also include metrics such as idea velocity, forecasted savings, benefits deployed, benefits in pipeline, etc. Showcasing this set of slides titled Robotic Process Automation Metrics Accelerator Executive KPI Dashboard Formats PDF. The topics addressed in these templates are Opportunities, Benefit In Development, Value. All the content presented in this PPT design is completely editable. Download it and make adjustments in color, background, font etc. as per your unique business setting.
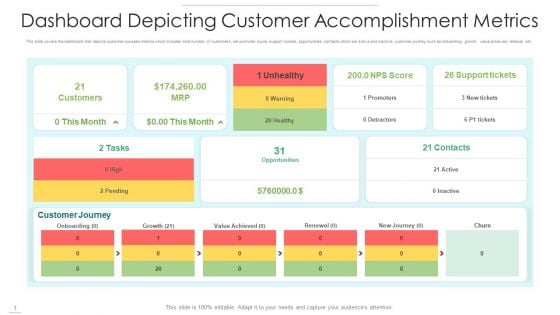
Dashboard Depicting Customer Accomplishment Metrics Slides PDF
This slide covers the dashboard that depicts customer success metrics which includes total number of customers, net promoter score, support tickets, opportunities, contacts which are active and inactive, customer journey such as onboarding, growth, value achieved, renewal, etc. Showcasing this set of slides titled dashboard depicting customer accomplishment metrics slides pdf. The topics addressed in these templates are customers, unhealthy, support tickets. All the content presented in this PPT design is completely editable. Download it and make adjustments in color, background, font etc. as per your unique business setting.
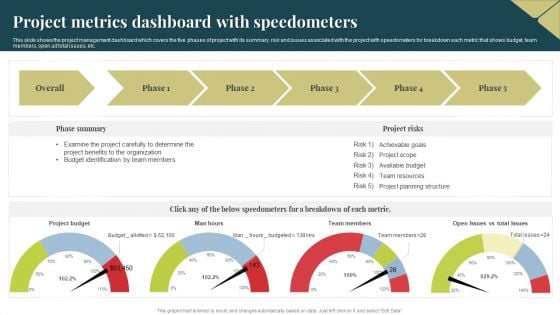
Project Metrics Dashboard With Speedometers Themes PDF
This slide shows the project management dashboard which covers the five phases of project with its summary, risk and issues associated with the project with speedometers for breakdown each metric that shows budget, team members, open ad total issues, etc. Showcasing this set of slides titled Project Metrics Dashboard With Speedometers Themes PDF. The topics addressed in these templates are Budget, Project Benefits, Organization. All the content presented in this PPT design is completely editable. Download it and make adjustments in color, background, font etc. as per your unique business setting.
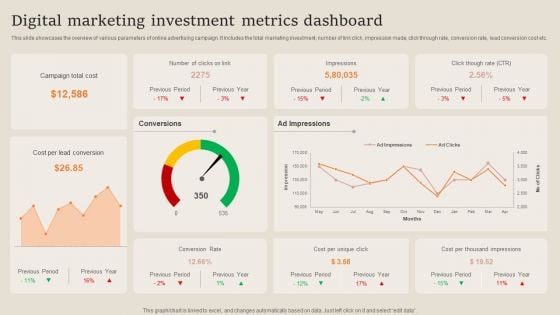
Digital Marketing Investment Metrics Dashboard Professional PDF
This slide showcases the overview of various parameters of online advertising campaign. It includes the total marketing investment, number of link click, impression made, click through rate, conversion rate, lead conversion cost etc. Showcasing this set of slides titled Digital Marketing Investment Metrics Dashboard Professional PDF. The topics addressed in these templates are Campaign Total Cost, Cost Per Lead Conversion, Investment Metrics Dashboard. All the content presented in this PPT design is completely editable. Download it and make adjustments in color, background, font etc. as per your unique business setting.
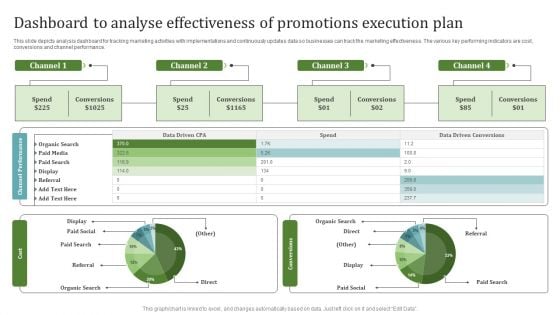
Dashboard To Analyse Effectiveness Of Promotions Execution Plan Diagrams PDF
This slide depicts analysis dashboard for tracking marketing activities with implementations and continuously updates data so businesses can track the marketing effectiveness. The various key performing indicators are cost, conversions and channel performance. Showcasing this set of slides titled Dashboard To Analyse Effectiveness Of Promotions Execution Plan Diagrams PDF. The topics addressed in these templates are Channel Performance, Cost, Conversions. All the content presented in this PPT design is completely editable. Download it and make adjustments in color, background, font etc. as per your unique business setting.
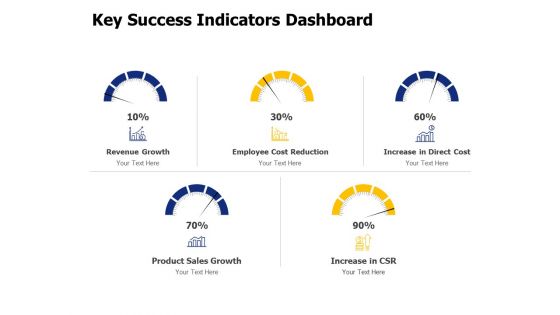
Key Success Indicators Dashboard Ppt PowerPoint Presentation Pictures Example Topics
Presenting this set of slides with name key success indicators dashboard ppt powerpoint presentation pictures example topics. The topics discussed in these slides are revenue growth, employee cost reduction, increase in direct cost, product sales growth, increase csr. This is a completely editable PowerPoint presentation and is available for immediate download. Download now and impress your audience.
Employee Count Reporting And Tracking Roadmap Download Pdf
The following slide showcases reporting and tracking roadmap to help organizations understand workforce dynamics and engage in strategic planning. It covers activities undertaken quarterly employee classification, data management, clarity in objectives and dashboard Showcasing this set of slides titled Employee Count Reporting And Tracking Roadmap Download Pdf. The topics addressed in these templates are Employee Classification, Data Management, Clarify Objectives. All the content presented in this PPT design is completely editable. Download it and make adjustments in color, background, font etc. as per your unique business setting. The following slide showcases reporting and tracking roadmap to help organizations understand workforce dynamics and engage in strategic planning. It covers activities undertaken quarterly employee classification, data management, clarity in objectives and dashboard
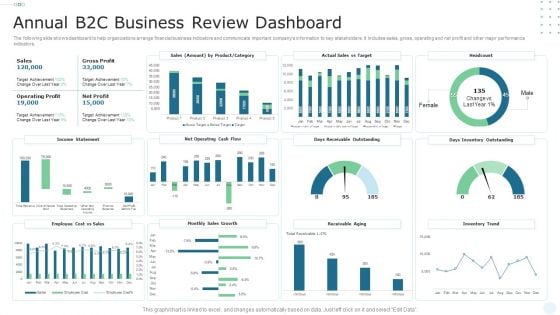
Annual B2C Business Review Dashboard Microsoft PDF
The following slide shows dashboard to help organizations arrange financial business indicators and communicate important companys information to key stakeholders. It includes sales, gross, operating and net profit and other major performance indicators. Showcasing this set of slides titled Annual B2C Business Review Dashboard Microsoft PDF. The topics addressed in these templates are Gross Profit, Sales, Operating Profit. All the content presented in this PPT design is completely editable. Download it and make adjustments in color, background, font etc. as per your unique business setting.

Dashboard To Evaluate Top Performing Comprehensive Guide To Wholesale Ppt Presentation
This slide showcases dashboard which helps track sales representatives performance by assessing cold calling KPIs. it provides information regarding KPIs such as conversion rates, no. of items sold. No. of deals converted, value generated etc. Coming up with a presentation necessitates that the majority of the effort goes into the content and the message you intend to convey. The visuals of a PowerPoint presentation can only be effective if it supplements and supports the story that is being told. Keeping this in mind our experts created Dashboard To Evaluate Top Performing Comprehensive Guide To Wholesale Ppt Presentation to reduce the time that goes into designing the presentation. This way, you can concentrate on the message while our designers take care of providing you with the right template for the situation. This slide showcases dashboard which helps track sales representatives performance by assessing cold calling KPIs. it provides information regarding KPIs such as conversion rates, no. of items sold. No. of deals converted, value generated etc.

Statistical Analysis Impact On Data Analytics For Informed Decision Ppt PowerPoint
This slide illustrates the business impact of performing statistical analysis. The parameters described in this slide are data-driven decision-making, operational efficiency, customer insights, quality control, revenue optimization, risk management, etc. Presenting this PowerPoint presentation, titled Statistical Analysis Impact On Data Analytics For Informed Decision Ppt PowerPoint, with topics curated by our researchers after extensive research. This editable presentation is available for immediate download and provides attractive features when used. Download now and captivate your audience. Presenting this Statistical Analysis Impact On Data Analytics For Informed Decision Ppt PowerPoint. Our researchers have carefully researched and created these slides with all aspects taken into consideration. This is a completely customizable Statistical Analysis Impact On Data Analytics For Informed Decision Ppt PowerPoint that is available for immediate downloading. Download now and make an impact on your audience. Highlight the attractive features available with our PPTs. This slide illustrates the business impact of performing statistical analysis. The parameters described in this slide are data-driven decision-making, operational efficiency, customer insights, quality control, revenue optimization, risk management, etc.
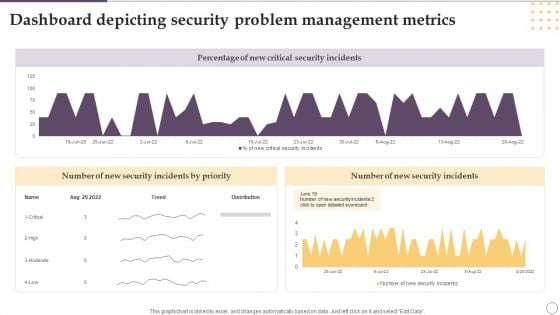
Dashboard Depicting Security Problem Management Metrics Ppt Gallery Designs PDF
This graph or chart is linked to excel, and changes automatically based on data. Just left click on it and select Edit Data. Showcasing this set of slides titled Dashboard Depicting Security Problem Management Metrics Ppt Gallery Designs PDF. The topics addressed in these templates are Percentage, New Critical, Security Incidents. All the content presented in this PPT design is completely editable. Download it and make adjustments in color, background, font etc. as per your unique business setting.
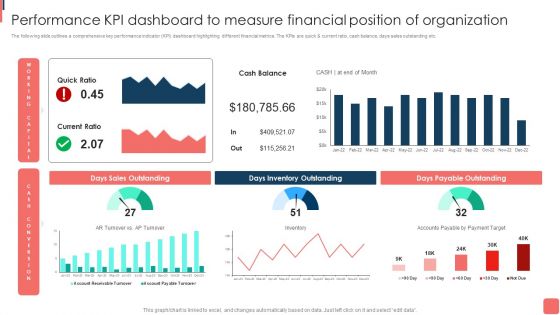
Effective Financial Planning Assessment Techniques Performance Kpi Dashboard To Measure Financial Graphics PDF
The following slide outlines a comprehensive key performance indicator KPI dashboard highlighting different financial metrics. The KPIs are quick and current ratio, cash balance, days sales outstanding etc. The best PPT templates are a great way to save time, energy, and resources. Slidegeeks have 100 precent editable powerpoint slides making them incredibly versatile. With these quality presentation templates, you can create a captivating and memorable presentation by combining visually appealing slides and effectively communicating your message. Download Effective Financial Planning Assessment Techniques Performance Kpi Dashboard To Measure Financial Graphics PDF from Slidegeeks and deliver a wonderful presentation.
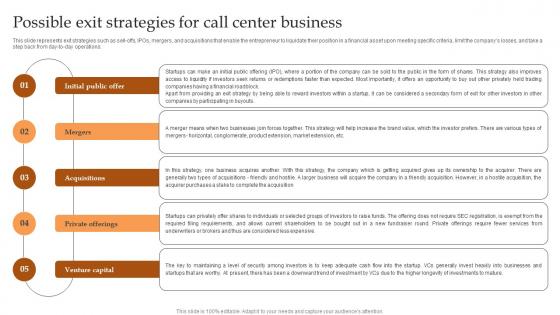
Possible Exit Strategies For Call Center Business IT And Tech Support Business Introduction Pdf
This slide represents exit strategies such as sell-offs, IPOs, mergers, and acquisitions that enable the entrepreneur to liquidate their position in a financial asset upon meeting specific criteria, limit the companys losses, and take a step back from day-to-day operations. Do you know about Slidesgeeks Possible Exit Strategies For Call Center Business IT And Tech Support Business Introduction Pdf These are perfect for delivering any kind od presentation. Using it, create PowerPoint presentations that communicate your ideas and engage audiences. Save time and effort by using our pre-designed presentation templates that are perfect for a wide range of topic. Our vast selection of designs covers a range of styles, from creative to business, and are all highly customizable and easy to edit. Download as a PowerPoint template or use them as Google Slides themes. This slide represents exit strategies such as sell-offs, IPOs, mergers, and acquisitions that enable the entrepreneur to liquidate their position in a financial asset upon meeting specific criteria, limit the companys losses, and take a step back from day-to-day operations.
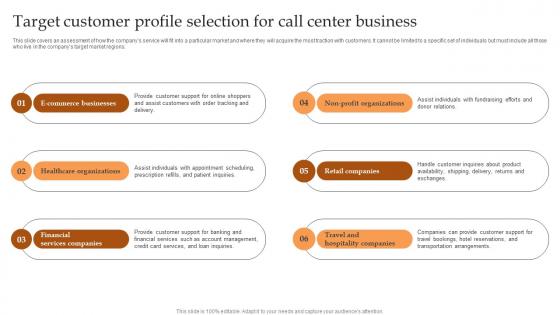
Target Customer Profile Selection For Call Center IT And Tech Support Business Structure Pdf
This slide covers an assessment of how the companys service will fit into a particular market and where they will acquire the most traction with customers. It cannot be limited to a specific set of individuals but must include all those who live in the companys target market regions. Present like a pro with Target Customer Profile Selection For Call Center IT And Tech Support Business Structure Pdf Create beautiful presentations together with your team, using our easy-to-use presentation slides. Share your ideas in real-time and make changes on the fly by downloading our templates. So whether you are in the office, on the go, or in a remote location, you can stay in sync with your team and present your ideas with confidence. With Slidegeeks presentation got a whole lot easier. Grab these presentations today. This slide covers an assessment of how the companys service will fit into a particular market and where they will acquire the most traction with customers. It cannot be limited to a specific set of individuals but must include all those who live in the companys target market regions.
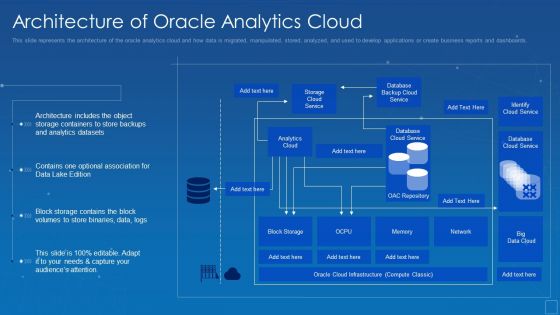
Oracle Cloud Data Analytics Administration IT Architecture Of Oracle Analytics Cloud Microsoft PDF
This slide represents the architecture of the oracle analytics cloud and how data is migrated, manipulated, stored, analyzed, and used to develop applications or create business reports and dashboards. Deliver an awe inspiring pitch with this creative oracle cloud data analytics administration it architecture of oracle analytics cloud microsoft pdf bundle. Topics like datasets, analytics, architecture, containers, association, optional can be discussed with this completely editable template. It is available for immediate download depending on the needs and requirements of the user.

Erp Project Metrics Plan Dashboard Slides PDF
This slide focuses on project management dashboard for enterprise resource planning which covers the total hours spent that includes project preparation, business blueprint, project realization, final preparation, go live and support with gantt chart showing detailed tasks. Pitch your topic with ease and precision using this Erp Project Metrics Plan Dashboard Slides PDF. This layout presents information on Business Blueprint, Project Preparation, Project Realization. It is also available for immediate download and adjustment. So, changes can be made in the color, design, graphics or any other component to create a unique layout.
Email Marketing Campaign Kpis Tracking Dashboard Template PDF
This slide shows key performance indicators KPI dashboard for measuring the effectiveness of email campaigns. It provides information about sent, delivered, opens, clicks, unsubscribed, bounces, complaints, etc. Are you in need of a template that can accommodate all of your creative concepts This one is crafted professionally and can be altered to fit any style. Use it with Google Slides or PowerPoint. Include striking photographs, symbols, depictions, and other visuals. Fill, move around, or remove text boxes as desired. Test out color palettes and font mixtures. Edit and save your work, or work with colleagues. Download Email Marketing Campaign Kpis Tracking Dashboard Template PDF and observe how to make your presentation outstanding. Give an impeccable presentation to your group and make your presentation unforgettable.
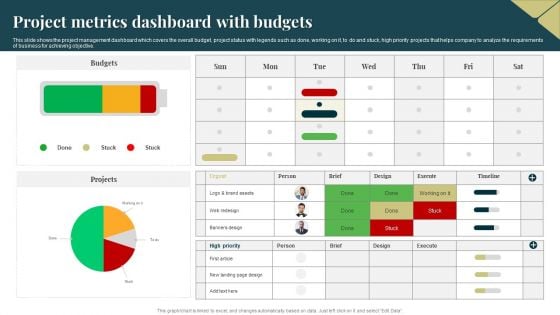
Project Metrics Dashboard With Budgets Topics PDF
This slide shows the project management dashboard which covers the overall budget, project status with legends such as done, working on it, to do and stuck, high priority projects that helps company to analyze the requirements of business for achieving objective. Pitch your topic with ease and precision using this Project Metrics Dashboard With Budgets Topics PDF. This layout presents information on Budgets, Projects, Banners Design. It is also available for immediate download and adjustment. So, changes can be made in the color, design, graphics or any other component to create a unique layout.
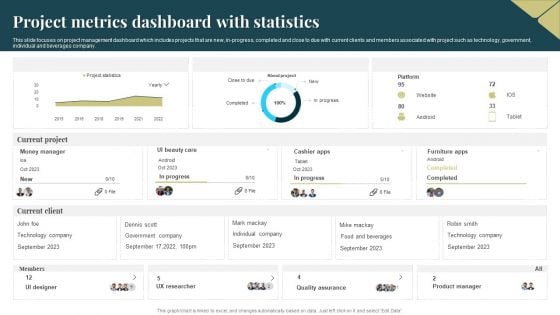
Project Metrics Dashboard With Statistics Slides PDF
This slide focuses on project management dashboard which includes projects that are new, in progress, completed and close to due with current clients and members associated with project such as technology, government, individual and beverages company. Showcasing this set of slides titled Project Metrics Dashboard With Statistics Slides PDF. The topics addressed in these templates are Quality Assurance, Product Manager, Technology. All the content presented in this PPT design is completely editable. Download it and make adjustments in color, background, font etc. as per your unique business setting.
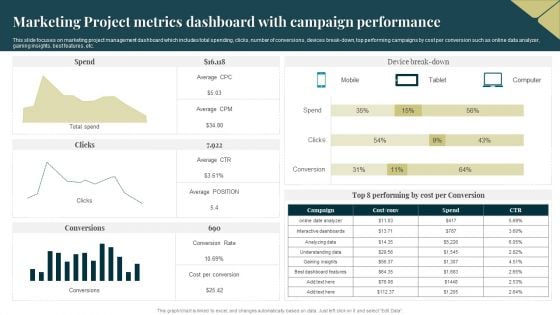
Marketing Project Metrics Dashboard With Campaign Performance Topics PDF
This slide focuses on marketing project management dashboard which includes total spending, clicks, number of conversions, devices break down, top performing campaigns by cost per conversion such as online data analyzer, gaining insights, best features, etc. Showcasing this set of slides titled Marketing Project Metrics Dashboard With Campaign Performance Topics PDF. The topics addressed in these templates are Average, Cost, Analyzing Data. All the content presented in this PPT design is completely editable. Download it and make adjustments in color, background, font etc. as per your unique business setting.
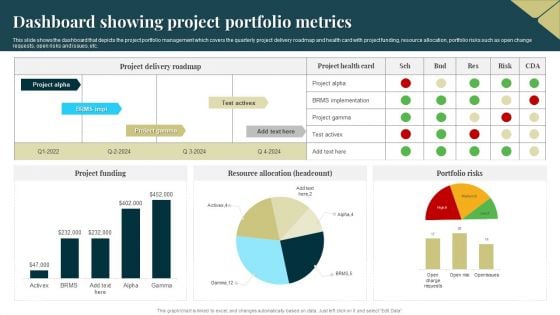
Dashboard Showing Project Portfolio Metrics Microsoft PDF
This slide shows the dashboard that depicts the project portfolio management which covers the quarterly project delivery roadmap and health card with project funding, resource allocation, portfolio risks such as open change requests, open risks and issues, etc. Pitch your topic with ease and precision using this Dashboard Showing Project Portfolio Metrics Microsoft PDF. This layout presents information on Resource Allocation, Portfolio Risks, Project Funding. It is also available for immediate download and adjustment. So, changes can be made in the color, design, graphics or any other component to create a unique layout.

Data Analytics Metrics For Internal Audit Ppt Model Outfit PDF
This slide covers the KPIs key performance indicators of data analytics for conducting internal audit. It includes information related to the reporting, planning and audit execution. Presenting Data Analytics Metrics For Internal Audit Ppt Model Outfit PDF to dispense important information. This template comprises three stages. It also presents valuable insights into the topics including Planning, Audit Execution, Reporting. This is a completely customizable PowerPoint theme that can be put to use immediately. So, download it and address the topic impactfully.
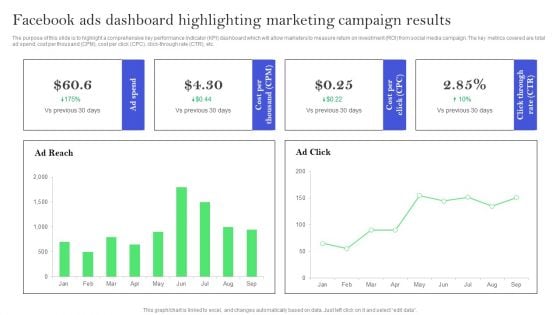
Facebook Ads Dashboard Highlighting Marketing Campaign Results Slides PDF
The purpose of this slide is to highlight a comprehensive key performance indicator KPI dashboard which will allow marketers to measure return on investment ROI from social media campaign. The key metrics covered are total ad spend, cost per thousand CPM, cost per click CPC, click through rate CTR, etc. From laying roadmaps to briefing everything in detail, our templates are perfect for you. You can set the stage with your presentation slides. All you have to do is download these easy to edit and customizable templates. Facebook Ads Dashboard Highlighting Marketing Campaign Results Slides PDF will help you deliver an outstanding performance that everyone would remember and praise you for. Do download this presentation today.
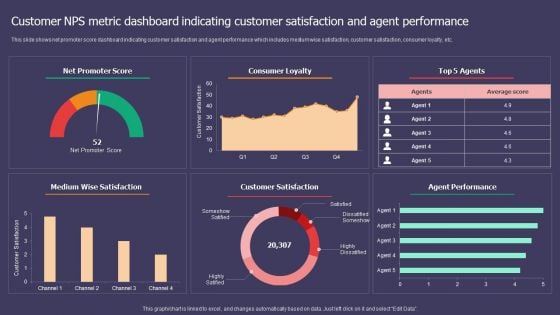
Customer NPS Metric Dashboard Indicating Customer Satisfaction And Agent Performance Template PDF
This slide shows net promoter score dashboard indicating customer satisfaction and agent performance which includes medium wise satisfaction, customer satisfaction, consumer loyalty, etc. Showcasing this set of slides titled Customer NPS Metric Dashboard Indicating Customer Satisfaction And Agent Performance Template PDF. The topics addressed in these templates are Net Promoter Score, Consumer Loyalty, Top 5 Agents. All the content presented in this PPT design is completely editable. Download it and make adjustments in color, background, font etc. as per your unique business setting.
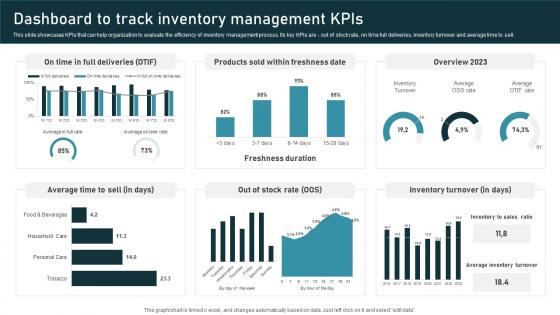
Dashboard To Track Inventory Administration Techniques For Enhanced Stock Accuracy Structure Pdf
This slide showcases KPIs that can help organization to evaluate the efficiency of inventory management process. Its key KPIs are out of stock rate, on time full deliveries, inventory turnover and average time to sell. Whether you have daily or monthly meetings, a brilliant presentation is necessary. Dashboard To Track Inventory Administration Techniques For Enhanced Stock Accuracy Structure Pdf can be your best option for delivering a presentation. Represent everything in detail using Dashboard To Track Inventory Administration Techniques For Enhanced Stock Accuracy Structure Pdf and make yourself stand out in meetings. The template is versatile and follows a structure that will cater to your requirements. All the templates prepared by Slidegeeks are easy to download and edit. Our research experts have taken care of the corporate themes as well. So, give it a try and see the results. This slide showcases KPIs that can help organization to evaluate the efficiency of inventory management process. Its key KPIs are out of stock rate, on time full deliveries, inventory turnover and average time to sell.
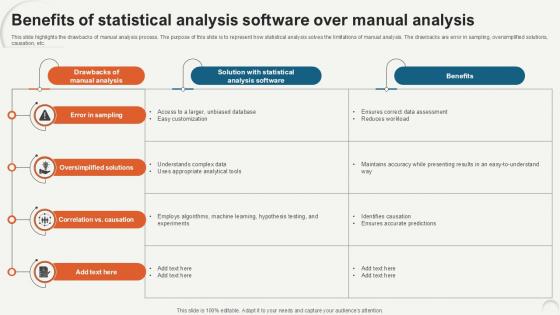
Benefits Of Statistical Analysis Data Analytics For Informed Decision Ppt Slide
This slide highlights the drawbacks of manual analysis process. The purpose of this slide is to represent how statistical analysis solves the limitations of manual analysis. The drawbacks are error in sampling, oversimplified solutions, causation, etc. Slidegeeks is one of the best resources for PowerPoint templates. You can download easily and regulate Benefits Of Statistical Analysis Data Analytics For Informed Decision Ppt Slide for your personal presentations from our wonderful collection. A few clicks is all it takes to discover and get the most relevant and appropriate templates. Use our Templates to add a unique zing and appeal to your presentation and meetings. All the slides are easy to edit and you can use them even for advertisement purposes. This slide highlights the drawbacks of manual analysis process. The purpose of this slide is to represent how statistical analysis solves the limitations of manual analysis. The drawbacks are error in sampling, oversimplified solutions, causation, etc.
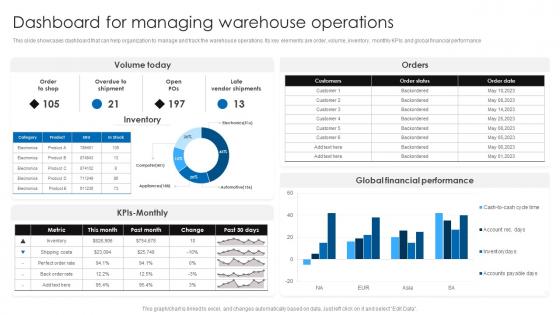
Dashboard For Managing Warehouse Operations Retail Stock Administration Strategies Formats Pdf
This slide showcases dashboard that can help organization to manage and track the warehouse operations. Its key elements are order, volume, inventory, monthly KPIs and global financial performance.Formulating a presentation can take up a lot of effort and time, so the content and message should always be the primary focus. The visuals of the PowerPoint can enhance the presenters message, so our Dashboard For Managing Warehouse Operations Retail Stock Administration Strategies Formats Pdf was created to help save time. Instead of worrying about the design, the presenter can concentrate on the message while our designers work on creating the ideal templates for whatever situation is needed. Slidegeeks has experts for everything from amazing designs to valuable content, we have put everything into Dashboard For Managing Warehouse Operations Retail Stock Administration Strategies Formats Pdf This slide showcases dashboard that can help organization to manage and track the warehouse operations. Its key elements are order, volume, inventory, monthly KPIs and global financial performance
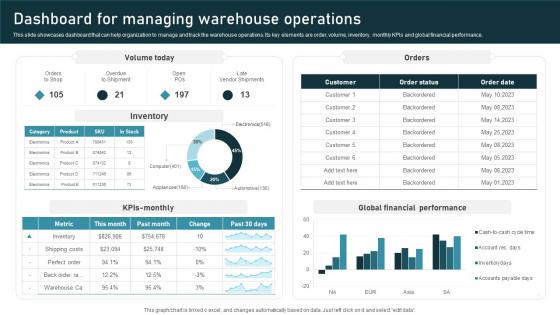
Dashboard Managing Inventory Administration Techniques For Enhanced Stock Accuracy Mockup Pdf
This slide showcases dashboard that can help organization to manage and track the warehouse operations. Its key elements are order, volume, inventory, monthly KPIs and global financial performance. Do you have an important presentation coming up Are you looking for something that will make your presentation stand out from the rest Look no further than Dashboard Managing Inventory Administration Techniques For Enhanced Stock Accuracy Mockup Pdf. With our professional designs, you can trust that your presentation will pop and make delivering it a smooth process. And with Slidegeeks, you can trust that your presentation will be unique and memorable. So why wait Grab Dashboard Managing Inventory Administration Techniques For Enhanced Stock Accuracy Mockup Pdf today and make your presentation stand out from the rest This slide showcases dashboard that can help organization to manage and track the warehouse operations. Its key elements are order, volume, inventory, monthly KPIs and global financial performance.
Dashboard For Tracking Impact Of Implementing Sales Techniques For Achieving Rules Pdf
This slide covers the KPI dashboard for tracking KPIs such as new customer YTD, sales revenue, profit, average weekly sales, above sales target, average revenue per unit, customer lifetime value, etc. Do you have an important presentation coming up Are you looking for something that will make your presentation stand out from the rest Look no further than Dashboard For Tracking Impact Of Implementing Sales Techniques For Achieving Rules Pdf. With our professional designs, you can trust that your presentation will pop and make delivering it a smooth process. And with Slidegeeks, you can trust that your presentation will be unique and memorable. So why wait Grab Dashboard For Tracking Impact Of Implementing Sales Techniques For Achieving Rules Pdf today and make your presentation stand out from the rest This slide covers the KPI dashboard for tracking KPIs such as new customer YTD, sales revenue, profit, average weekly sales, above sales target, average revenue per unit, customer lifetime value, etc.
Dashboard For Tracking Impact Of Warehouse Leveraging Logistics Automation Information Pdf
This slide covers the dashboard with after automation warehouse overview. It include KPIs such as autonomous robots status, robotic arms status, battery level, performance, time to return, etc.Get a simple yet stunning designed Dashboard For Tracking Impact Of Warehouse Leveraging Logistics Automation Information Pdf. It is the best one to establish the tone in your meetings. It is an excellent way to make your presentations highly effective. So, download this PPT today from Slidegeeks and see the positive impacts. Our easy-to-edit Dashboard For Tracking Impact Of Warehouse Leveraging Logistics Automation Information Pdf can be your go-to option for all upcoming conferences and meetings. So, what are you waiting for Grab this template today. This slide covers the dashboard with after automation warehouse overview. It include KPIs such as autonomous robots status, robotic arms status, battery level, performance, time to return, etc.
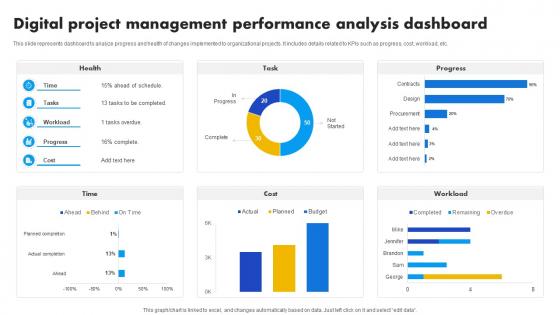
Digital Project Management Performance Analysis Dashboard Strategies For Success In Digital
This slide represents dashboard to analyze progress and health of changes implemented to organizational projects. It includes details related to KPIs such as progress, cost, workload, etc. Whether you have daily or monthly meetings, a brilliant presentation is necessary. Digital Project Management Performance Analysis Dashboard Strategies For Success In Digital can be your best option for delivering a presentation. Represent everything in detail using Digital Project Management Performance Analysis Dashboard Strategies For Success In Digital and make yourself stand out in meetings. The template is versatile and follows a structure that will cater to your requirements. All the templates prepared by Slidegeeks are easy to download and edit. Our research experts have taken care of the corporate themes as well. So, give it a try and see the results. This slide represents dashboard to analyze progress and health of changes implemented to organizational projects. It includes details related to KPIs such as progress, cost, workload, etc.
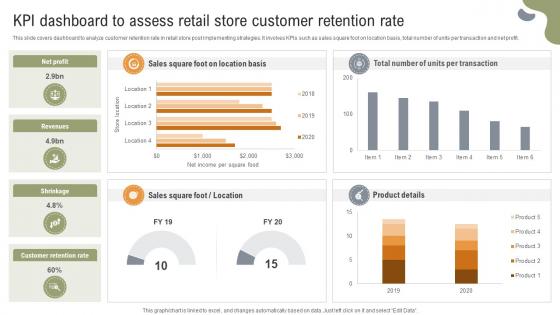
Implementing Strategies To Enhance Grocery KPI Dashboard To Assess Retail Store Customer
This slide covers dashboard to analyze customer retention rate in retail store post implementing strategies. It involves KPIs such as sales square foot on location basis, total number of units per transaction and net profit. Crafting an eye-catching presentation has never been more straightforward. Let your presentation shine with this tasteful yet straightforward Implementing Strategies To Enhance Grocery KPI Dashboard To Assess Retail Store Customer template. It offers a minimalistic and classy look that is great for making a statement. The colors have been employed intelligently to add a bit of playfulness while still remaining professional. Construct the ideal Implementing Strategies To Enhance Grocery KPI Dashboard To Assess Retail Store Customer that effortlessly grabs the attention of your audience Begin now and be certain to wow your customers This slide covers dashboard to analyze customer retention rate in retail store post implementing strategies. It involves KPIs such as sales square foot on location basis, total number of units per transaction and net profit.
Analytics Dashboard Tracking Effective Digital Transformation Journey PPT Presentation DT SS V
This slide represents an analytics dashboard for effective energy monitoring and management. It tracks KPIs such as energy production, solar energy production, savings, energy produced, carbon savings, and financial savings. Get a simple yet stunning designed Analytics Dashboard Tracking Effective Digital Transformation Journey PPT Presentation DT SS V. It is the best one to establish the tone in your meetings. It is an excellent way to make your presentations highly effective. So, download this PPT today from Slidegeeks and see the positive impacts. Our easy-to-edit Analytics Dashboard Tracking Effective Digital Transformation Journey PPT Presentation DT SS V can be your go-to option for all upcoming conferences and meetings. So, what are you waiting for Grab this template today. This slide represents an analytics dashboard for effective energy monitoring and management. It tracks KPIs such as energy production, solar energy production, savings, energy produced, carbon savings, and financial savings.
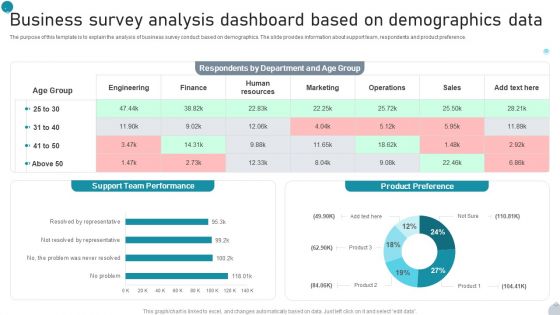
Business Survey Analysis Dashboard Based On Demographics Data Microsoft PDF
The purpose of this template is to explain the analysis of business survey conduct based on demographics. The slide provides information about support team, respondents and product preference. Pitch your topic with ease and precision using this Business Survey Analysis Dashboard Based On Demographics Data Microsoft PDF. This layout presents information on Support, Team Performance, Product Preference It is also available for immediate download and adjustment. So, changes can be made in the color, design, graphics or any other component to create a unique layout.
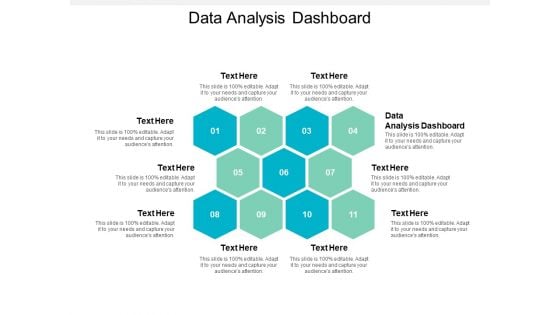
Data Analysis Dashboard Ppt PowerPoint Presentation Styles Maker Cpb
This is a data analysis dashboard ppt powerpoint presentation styles maker cpb. This is a eleven stage process. The stages in this process are data analysis dashboard.


 Continue with Email

 Home
Home


