Snapshot
Brand Identity Management Toolkit Overall Brand Performance Tracking Dashboard Diagrams PDF
This slide provides information regarding brand performance tracking dashboard capturing KPIs such as brand metric, brand commitment, advertising metrics, and purchase metrics. Create an editable Brand Identity Management Toolkit Overall Brand Performance Tracking Dashboard Diagrams PDF that communicates your idea and engages your audience. Whether youre presenting a business or an educational presentation, pre-designed presentation templates help save time. Brand Identity Management Toolkit Overall Brand Performance Tracking Dashboard Diagrams PDF is highly customizable and very easy to edit, covering many different styles from creative to business presentations. Slidegeeks has creative team members who have crafted amazing templates. So, go and get them without any delay.
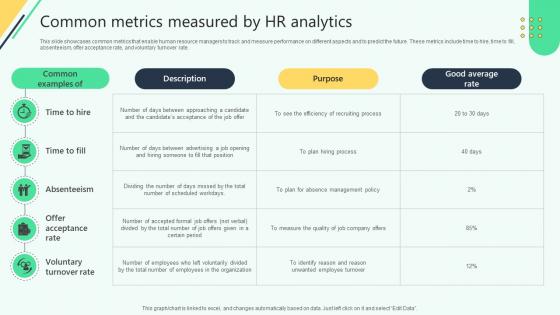
Common Metrics Measured By Hr Analytics Analysing Hr Data For Effective Decision Making
This slide showcases common metrics that enable human resource managers to track and measure performance on different aspects and to predict the future. These metrics include time to hire, time to fill,absenteeism, offer acceptance rate, and voluntary turnover rate. Slidegeeks is here to make your presentations a breeze with Common Metrics Measured By Hr Analytics Analysing Hr Data For Effective Decision Making With our easy-to-use and customizable templates, you can focus on delivering your ideas rather than worrying about formatting. With a variety of designs to choose from, you are sure to find one that suits your needs. And with animations and unique photos, illustrations, and fonts, you can make your presentation pop. So whether you are giving a sales pitch or presenting to the board, make sure to check out Slidegeeks first This slide showcases common metrics that enable human resource managers to track and measure performance on different aspects and to predict the future. These metrics include time to hire, time to fill,absenteeism, offer acceptance rate, and voluntary turnover rate.
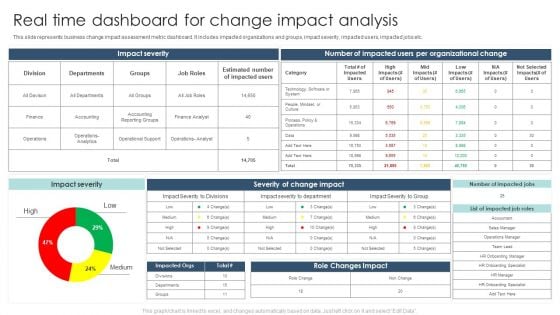
Real Time Dashboard For Change Impact Analysis Ppt Pictures Layouts PDF
This slide represents business change impact assessment metric dashboard. It includes impacted organizations and groups, impact severity, impacted users, impacted jobs etc. Pitch your topic with ease and precision using this Real Time Dashboard For Change Impact Analysis Ppt Pictures Layouts PDF. This layout presents information on Impact Severity, Role Changes Impact, High, Low, Medium. It is also available for immediate download and adjustment. So, changes can be made in the color, design, graphics or any other component to create a unique layout.
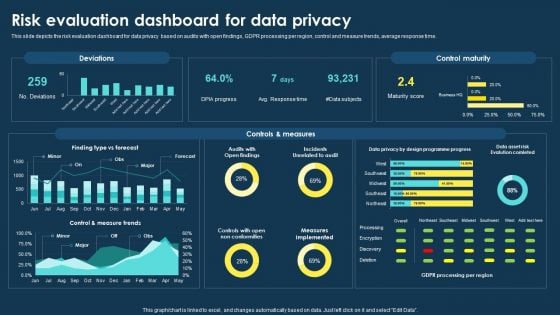
Integrating Data Privacy System Risk Evaluation Dashboard For Data Privacy Guidelines PDF
This slide depicts the risk evaluation dashboard for data privacy based on audits with open findings, GDPR processing per region, control and measure trends, average response time. Do you have to make sure that everyone on your team knows about any specific topic I yes, then you should give Integrating Data Privacy System Risk Evaluation Dashboard For Data Privacy Guidelines PDF a try. Our experts have put a lot of knowledge and effort into creating this impeccable Integrating Data Privacy System Risk Evaluation Dashboard For Data Privacy Guidelines PDF. You can use this template for your upcoming presentations, as the slides are perfect to represent even the tiniest detail. You can download these templates from the Slidegeeks website and these are easy to edit. So grab these today.
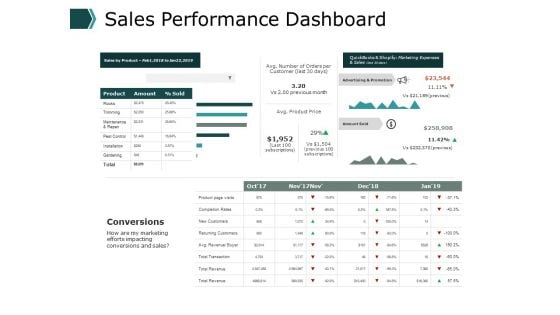
Sales Performance Dashboard Business Ppt PowerPoint Presentation Pictures Visuals
This is a sales performance dashboard business ppt powerpoint presentation pictures visuals . This is a three stage process. The stages in this process are finance, marketing, management, investment, analysis.
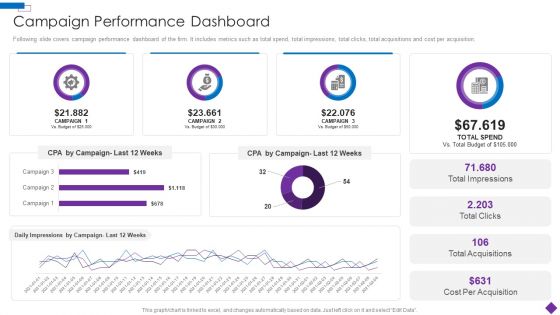
Introducing A New Product To The Market Campaign Performance Dashboard Pictures PDF
Following slide covers campaign performance dashboard of the firm. It includes metrics such as total spend, total impressions, total clicks, total acquisitions and cost per acquisition.Deliver and pitch your topic in the best possible manner with this Introducing A New Product To The Market Campaign Performance Dashboard Pictures PDF Use them to share invaluable insights on Per Acquisition, Total Acquisitions, Total Impressions and impress your audience. This template can be altered and modified as per your expectations. So, grab it now.
Customer Relationship Management CRM Dashboard For Tracking Contract Rate Pictures PDF
This slide covers the KPI dashboard for monitoring the sales teams performance through CRM software. It includes metrics such as outbound calls, demos, contracts closed, average contract value, etc. Deliver and pitch your topic in the best possible manner with this Customer Relationship Management CRM Dashboard For Tracking Contract Rate Pictures PDF. Use them to share invaluable insights on Contracts Closed, Contractvalue, Outbound Calls and impress your audience. This template can be altered and modified as per your expectations. So, grab it now.
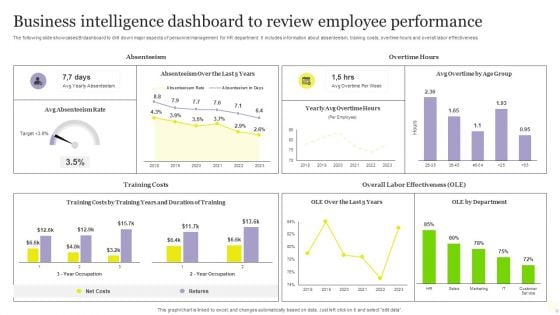
Business Intelligence Dashboard To Review Employee Performance Pictures PDF
The following slide showcases BI dashboard to drill down major aspects of personnel management for HR department. It includes information about absenteeism, training costs, overtime hours and overall labor effectiveness. Showcasing this set of slides titled Business Intelligence Dashboard To Review Employee Performance Pictures PDF. The topics addressed in these templates are Business Intelligence Dashboard, Review Employee Performance. All the content presented in this PPT design is completely editable. Download it and make adjustments in color, background, font etc. as per your unique business setting.
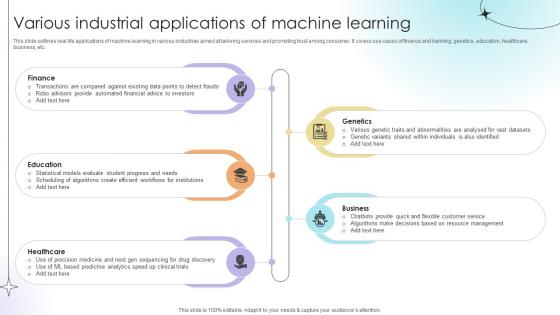
Various Industrial Applications Of Machine Learning Data Analytics SS V
This slide outlines real life applications of machine learning in various industries aimed at tailoring services and promoting trust among consumer. It covers use cases of finance and banking, genetics, education, healthcare, business, etc.Retrieve professionally designed Various Industrial Applications Of Machine Learning Data Analytics SS V to effectively convey your message and captivate your listeners. Save time by selecting pre-made slideshows that are appropriate for various topics, from business to educational purposes. These themes come in many different styles, from creative to corporate, and all of them are easily adjustable and can be edited quickly. Access them as PowerPoint templates or as Google Slides themes. You do not have to go on a hunt for the perfect presentation because Slidegeeks got you covered from everywhere. This slide outlines real life applications of machine learning in various industries aimed at tailoring services and promoting trust among consumer. It covers use cases of finance and banking, genetics, education, healthcare, business, etc.
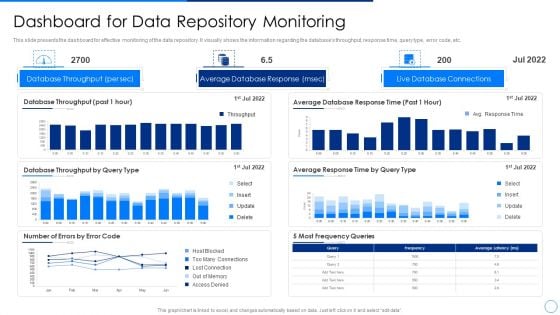
Scale Up Plan For Data Inventory Model Dashboard For Data Repository Monitoring Information PDF
BI System To Enhance Processes For Data Warehouse Management Ppt Professional Icon PDF
This slide shows the business intelligence architecture. It provides information such as enterprise data warehouse, data sources, analytics and user accessibility with tools, dashboards, reports and information delivery. Presenting BI System To Enhance Processes For Data Warehouse Management Ppt Professional Icon PDF to dispense important information. This template comprises four stages. It also presents valuable insights into the topics including Data Sources, Enterprise Data Warehouse, Extract Transform Load. This is a completely customizable PowerPoint theme that can be put to use immediately. So, download it and address the topic impactfully.
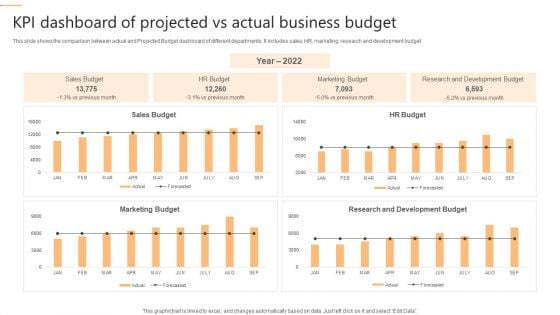
KPI Dashboard Of Projected Vs Actual Business Budget Pictures PDF
This slide shows the comparison between actual and Projected Budget dashboard of different departments. It includes sales, HR, marketing, research and development budget. Showcasing this set of slides titled KPI Dashboard Of Projected Vs Actual Business Budget Pictures PDF. The topics addressed in these templates are Marketing Budget, Development Budget, Sales Budget. All the content presented in this PPT design is completely editable. Download it and make adjustments in color, background, font etc. as per your unique business setting.
Business Data Consumption Dashboard Vector Icon Ppt PowerPoint Presentation File Good PDF
Presenting business data consumption dashboard vector icon ppt powerpoint presentation file good pdf to dispense important information. This template comprises three stages. It also presents valuable insights into the topics including business data consumption dashboard vector icon. This is a completely customizable PowerPoint theme that can be put to use immediately. So, download it and address the topic impactfully.

How To Create Cost Effective Kpis To Measure Effectiveness Of Facebook Strategy SS V
The following slide outlines key performance indicators KPI through which marketers can analyze impact of Facebook ads. The key metrics mentioned in slide are likes, shares, comments, click-through rate CTR, cost per conversion CPV, conversion rate, new followers, reach, and brand impressions. Find a pre-designed and impeccable How To Create Cost Effective Kpis To Measure Effectiveness Of Facebook Strategy SS V. The templates can ace your presentation without additional effort. You can download these easy-to-edit presentation templates to make your presentation stand out from others. So, what are you waiting for Download the template from Slidegeeks today and give a unique touch to your presentation. The following slide outlines key performance indicators KPI through which marketers can analyze impact of Facebook ads. The key metrics mentioned in slide are likes, shares, comments, click-through rate CTR, cost per conversion CPV, conversion rate, new followers, reach, and brand impressions.

Facebook Marketing Techniques Kpis To Measure Effectiveness Of Facebook Ad Strategy SS V
The following slide outlines key performance indicators KPI through which marketers can analyze impact of Facebook ads. The key metrics mentioned in slide are likes, shares, comments, click-through rate CTR , cost per conversion CPV , conversion rate, new followers, reach, and brand impressions. Find a pre-designed and impeccable Facebook Marketing Techniques Kpis To Measure Effectiveness Of Facebook Ad Strategy SS V. The templates can ace your presentation without additional effort. You can download these easy-to-edit presentation templates to make your presentation stand out from others. So, what are you waiting for Download the template from Slidegeeks today and give a unique touch to your presentation. The following slide outlines key performance indicators KPI through which marketers can analyze impact of Facebook ads. The key metrics mentioned in slide are likes, shares, comments, click-through rate CTR , cost per conversion CPV , conversion rate, new followers, reach, and brand impressions.
Facebook Ad Campaign Performance Tracking Dashboard Ppt Show Picture PDF
This slide represents the KPI dashboard to effectively measure and monitor performance of Facebook marketing campaign conducted by the organization to enhance customer engagement. It includes details related to KPIs such as ad impressions, ad reach etc. Are you in need of a template that can accommodate all of your creative concepts This one is crafted professionally and can be altered to fit any style. Use it with Google Slides or PowerPoint. Include striking photographs, symbols, depictions, and other visuals. Fill, move around, or remove text boxes as desired. Test out color palettes and font mixtures. Edit and save your work, or work with colleagues. Download Facebook Ad Campaign Performance Tracking Dashboard Ppt Show Picture PDF and observe how to make your presentation outstanding. Give an impeccable presentation to your group and make your presentation unforgettable.

Marketing Growth Strategy To Kpis To Measure Success Of Influencer Marketing Strategy SS V
The following slide outlines different success metrics through which marketing executives can measure effectiveness of influencer marketing campaigns. The key performance indicators KPIs outlined in slide are brand reach, impressions, followers growth, click-through rate CTR, customer engagement rate, etc. From laying roadmaps to briefing everything in detail, our templates are perfect for you. You can set the stage with your presentation slides. All you have to do is download these easy-to-edit and customizable templates. Marketing Growth Strategy To Kpis To Measure Success Of Influencer Marketing Strategy SS V will help you deliver an outstanding performance that everyone would remember and praise you for. Do download this presentation today. The following slide outlines different success metrics through which marketing executives can measure effectiveness of influencer marketing campaigns. The key performance indicators KPIs outlined in slide are brand reach, impressions, followers growth, click-through rate CTR, customer engagement rate, etc.
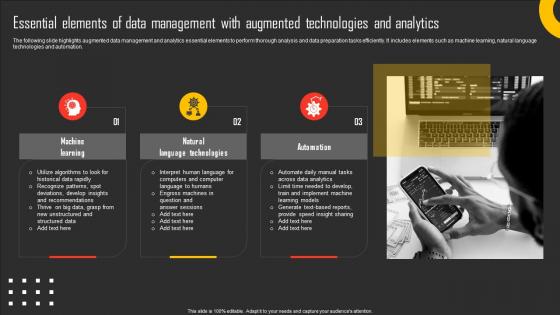
Essential Elements Of Data Management With Augmented Technologies And Analytics Professional Pdf
The following slide highlights augmented data management and analytics essential elements to perform thorough analysis and data preparation tasks efficiently. It includes elements such as machine learning, natural language technologies and automation. Showcasing this set of slides titled Essential Elements Of Data Management With Augmented Technologies And Analytics Professional Pdf. The topics addressed in these templates are Machine Learning, Natural Language Technologies, Automation. All the content presented in this PPT design is completely editable. Download it and make adjustments in color, background, font etc. as per your unique business setting. The following slide highlights augmented data management and analytics essential elements to perform thorough analysis and data preparation tasks efficiently. It includes elements such as machine learning, natural language technologies and automation.
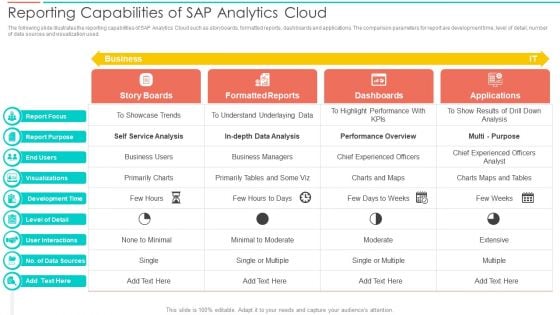
SAC Planning And Implementation Reporting Capabilities Of SAP Analytics Cloud Mockup PDF
The following slide illustrates the reporting capabilities of SAP Analytics Cloud such as storyboards, formatted reports, dashboards and applications. The comparison parameters for report are development time, level of detail, number of data sources and visualization used. Deliver an awe inspiring pitch with this creative SAC Planning And Implementation Reporting Capabilities Of SAP Analytics Cloud Mockup PDF bundle. Topics like Report Focus, Report Purpose, Development Time can be discussed with this completely editable template. It is available for immediate download depending on the needs and requirements of the user.
Online Marketing Analytics To Enhance Business Growth Dashboard For Tracking Business Blog Kpis Template PDF
This slide covers the dashboard for analyzing blogging KPIs such as performance, published posts, views, new blog subscribers, top blog posts by pageviews, top blog posts by CTR, etc. Slidegeeks is one of the best resources for PowerPoint templates. You can download easily and regulate Online Marketing Analytics To Enhance Business Growth Dashboard For Tracking Business Blog Kpis Template PDF for your personal presentations from our wonderful collection. A few clicks is all it takes to discover and get the most relevant and appropriate templates. Use our Templates to add a unique zing and appeal to your presentation and meetings. All the slides are easy to edit and you can use them even for advertisement purposes.
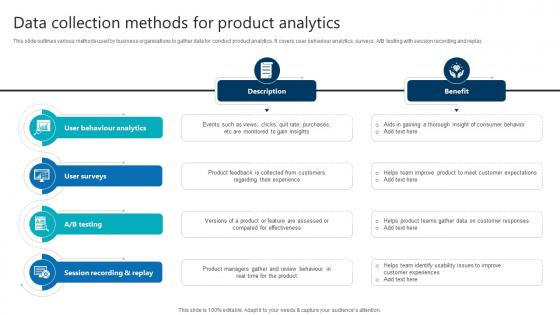
Data Collection Methods For Product Analytics Product Analytics Implementation Data Analytics V
This slide outlines various methods used by business organisations to gather data for conduct product analytics. It covers user behaviour analytics, surveys, A or B testing with session recording and replay.Crafting an eye-catching presentation has never been more straightforward. Let your presentation shine with this tasteful yet straightforward Data Collection Methods For Product Analytics Product Analytics Implementation Data Analytics V template. It offers a minimalistic and classy look that is great for making a statement. The colors have been employed intelligently to add a bit of playfulness while still remaining professional. Construct the ideal Data Collection Methods For Product Analytics Product Analytics Implementation Data Analytics V that effortlessly grabs the attention of your audience Begin now and be certain to wow your customers This slide outlines various methods used by business organisations to gather data for conduct product analytics. It covers user behaviour analytics, surveys, A or B testing with session recording and replay.
Strategies For Successful Customer Base Development In B2b M Commerce B2b Sales Performance Tracking Dashboard Demonstration PDF
This slide represents metric dashboard to track sales performance on e-commerce website. It cover performance indicators such as sales breakdown, order breakdown, recurring sales etc. Make sure to capture your audiences attention in your business displays with our gratis customizable Strategies For Successful Customer Base Development In B2b M Commerce B2b Sales Performance Tracking Dashboard Demonstration PDF. These are great for business strategies, office conferences, capital raising or task suggestions. If you desire to acquire more customers for your tech business and ensure they stay satisfied, create your own sales presentation with these plain slides.
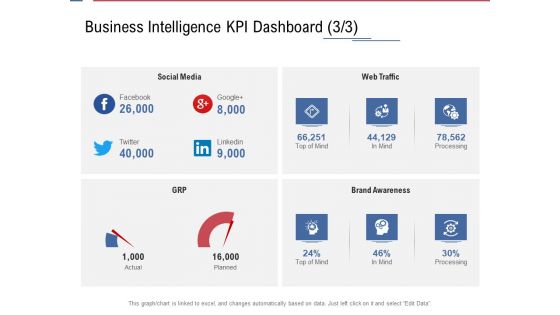
Data Assimilation Business Intelligence KPI Dashboard Media Ppt Layouts Show PDF
Deliver an awe inspiring pitch with this creative data assimilation business intelligence kpi dashboard media ppt layouts show pdf bundle. Topics like business intelligence kpi dashboard can be discussed with this completely editable template. It is available for immediate download depending on the needs and requirements of the user.
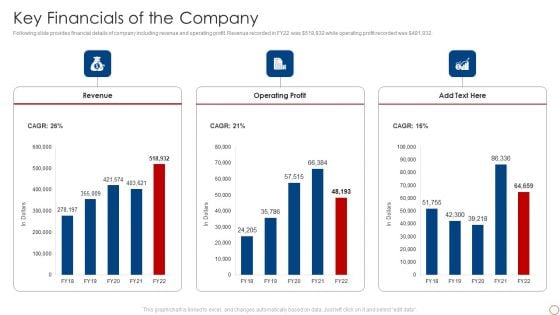
Kpis For Evaluating Business Sustainability Key Financials Of The Company Rules PDF
Following slide provides financial details of company including revenue and operating profit. Revenue recorded in FY22 was dollar 518,932 while operating profit recorded was dollar 481,932. Deliver and pitch your topic in the best possible manner with this Kpis For Evaluating Business Sustainability Financial Performance Indicator Dashboard Demonstration PDF. Use them to share invaluable insights on Revenue, Operating Profit and impress your audience. This template can be altered and modified as per your expectations. So, grab it now.

Corporate Sports Team Engagement Sports Event Service List For Teambuilding Sports Proposal Venue Diagrams PDF
Presenting this set of slides with name corporate sports team engagement sports event service list for teambuilding sports proposal venue diagrams pdf. The topics discussed in these slides are photography, videography, awards, winners. This is a completely editable PowerPoint presentation and is available for immediate download. Download now and impress your audience.
KPIs To Track Impact Of Eco Friendly Procurement Icons Pdf
The slide showcases key performance indicators that assist in maintaining a track record of activities initiated in order to attain sustainable procurement in organisations. The KPIs are carbon emissions, power and energy, social, governance, etc.Pitch your topic with ease and precision using this KPIs To Track Impact Of Eco Friendly Procurement Icons Pdf This layout presents information on Measure Organizations, Consumption Costs, Stakeholder Engagement It is also available for immediate download and adjustment. So, changes can be made in the color, design, graphics or any other component to create a unique layout. The slide showcases key performance indicators that assist in maintaining a track record of activities initiated in order to attain sustainable procurement in organisations. The KPIs are carbon emissions, power and energy, social, governance, etc.
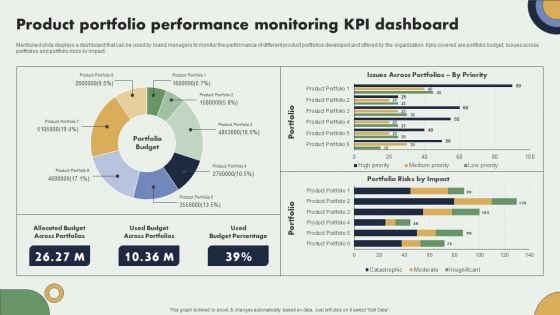
Product Portfolio Performance Monitoring Kpi Dashboard Brand Expansion Plan Slides PDF
Mentioned slide displays a dashboard that can be used by brand managers to monitor the performance of different product portfolios developed and offered by the organization. Kpis covered are portfolio budget, issues across portfolios and portfolio risks by impact.Take your projects to the next level with our ultimate collection of Product Portfolio Performance Monitoring Kpi Dashboard Brand Expansion Plan Slides PDF. Slidegeeks has designed a range of layouts that are perfect for representing task or activity duration, keeping track of all your deadlines at a glance. Tailor these designs to your exact needs and give them a truly corporate look with your own brand colors they all make your projects stand out from the rest.
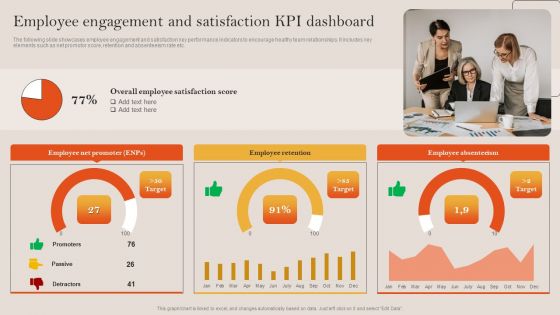
Tactical Employee Engagement Action Planning Employee Engagement Satisfaction Kpi Dashboard Sample PDF
The following slide showcases employee engagement and satisfaction key performance indicators to encourage healthy team relationships. It includes key elements such as net promotor score, retention and absenteeism rate etc. Presenting this PowerPoint presentation, titled Tactical Employee Engagement Action Planning Employee Engagement Satisfaction Kpi Dashboard Sample PDF, with topics curated by our researchers after extensive research. This editable presentation is available for immediate download and provides attractive features when used. Download now and captivate your audience. Presenting this Tactical Employee Engagement Action Planning Employee Engagement Satisfaction Kpi Dashboard Sample PDF. Our researchers have carefully researched and created these slides with all aspects taken into consideration. This is a completely customizable Tactical Employee Engagement Action Planning Employee Engagement Satisfaction Kpi Dashboard Sample PDF that is available for immediate downloading. Download now and make an impact on your audience. Highlight the attractive features available with our PPTs.

Key Performance Indicators Template 2 Ppt PowerPoint Presentation Microsoft
This is a key performance indicators template 2 ppt powerpoint presentation microsoft. This is a four stage process. The stages in this process are business, table, marketing, strategy, data.
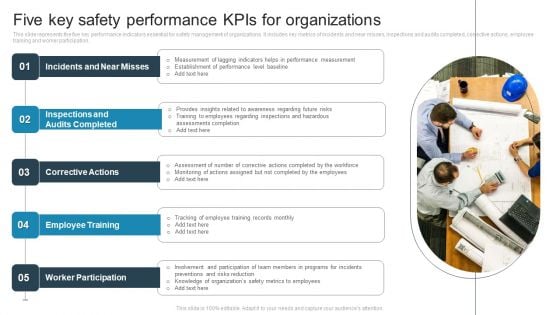
Five Key Safety Performance Kpis For Organizations Brochure PDF
This slide represents the five key performance indicators essential for safety management of organizations. It includes key metrics of incidents and near misses, inspections and audits completed, corrective actions, employee training and worker participation. Presenting Five Key Safety Performance Kpis For Organizations Brochure PDF to dispense important information. This template comprises Five stages. It also presents valuable insights into the topics including Incidents And Near Misses, Inspections And Audits Completed, Corrective Actions. This is a completely customizable PowerPoint theme that can be put to use immediately. So, download it and address the topic impactfully.

Data Hub Services Proposal Example Document Report Doc Pdf Ppt
Heres a predesigned Data Hub Services Proposal Example Document Report Doc Pdf Ppt for you. Built on extensive research and analysis, this one-complete deck has all the center pieces of your specific requirements. This temple exudes brilliance and professionalism. Being completely editable, you can make changes to suit your purpose. Get this Data Hub Services Proposal Example Document Report Doc Pdf Ppt A4 One pager now.
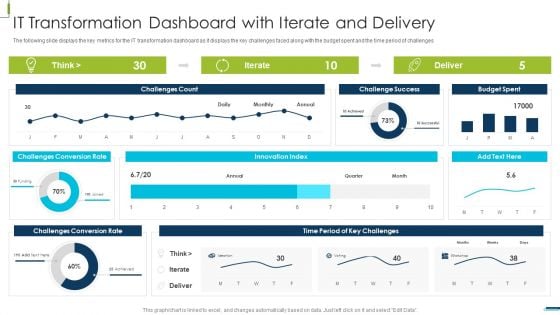
Corporate Digital Transformation Roadmap IT Transformation Dashboard With Iterate And Delivery Microsoft PDF
The following slide displays the key metrics for the IT transformation dashboard as it displays the key challenges faced along with the budget spent and the time period of challenges Deliver and pitch your topic in the best possible manner with this Corporate Digital Transformation Roadmap IT Transformation Dashboard With Iterate And Delivery Microsoft PDF Use them to share invaluable insights on IT Transformation Dashboard With Iterate And Delivery and impress your audience. This template can be altered and modified as per your expectations. So, grab it now.
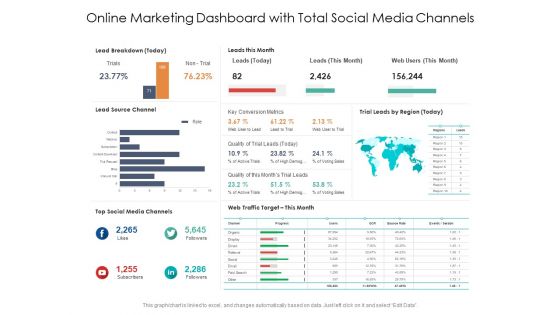
Online Marketing Dashboard With Total Social Media Channels Ppt PowerPoint Presentation Show Maker PDF
Presenting this set of slides with name online marketing dashboard with total social media channels ppt powerpoint presentation show maker pdf. The topics discussed in these slides are lead breakdown, leads this month, key conversion metrics, quality of trial leads, web traffic target, top social media channels, lead source channel. This is a completely editable PowerPoint presentation and is available for immediate download. Download now and impress your audience.
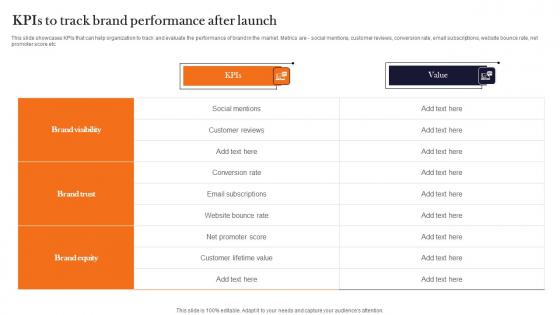
Kpis To Track Brand Performance After Launch Product Advertising And Positioning Pictures Pdf
This slide showcases KPIs that can help organization to track and evaluate the performance of brand in the market. Metrics are social mentions, customer reviews, conversion rate, email subscriptions, website bounce rate, net promoter score etc. The Kpis To Track Brand Performance After Launch Product Advertising And Positioning Pictures Pdf is a compilation of the most recent design trends as a series of slides. It is suitable for any subject or industry presentation, containing attractive visuals and photo spots for businesses to clearly express their messages. This template contains a variety of slides for the user to input data, such as structures to contrast two elements, bullet points, and slides for written information. Slidegeeks is prepared to create an impression. This slide showcases KPIs that can help organization to track and evaluate the performance of brand in the market. Metrics are social mentions, customer reviews, conversion rate, email subscriptions, website bounce rate, net promoter score etc.

Best Practices Of Attribution Analysis Product Analytics Implementation Data Analytics V
This slide provides key practices aimed at optimizing the practice of attribution analysis to boost marketing efforts. It covers choose KPIs, backend training, connect channels, use automation and talk to stakeholders There are so many reasons you need a Best Practices Of Attribution Analysis Product Analytics Implementation Data Analytics V. The first reason is you can not spend time making everything from scratch, Thus, Slidegeeks has made presentation templates for you too. You can easily download these templates from our website easily. This slide provides key practices aimed at optimizing the practice of attribution analysis to boost marketing efforts. It covers choose KPIs, backend training, connect channels, use automation and talk to stakeholders
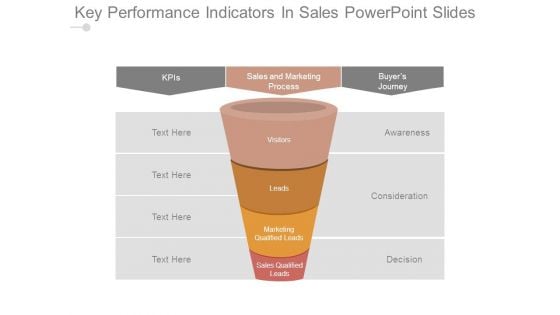
Key Performance Indicators In Sales Powerpoint Slides
This is a key performance indicators in sales powerpoint slides. This is a four stage process. The stages in this process are kpis, sales and marketing process, buyers journey, awareness, consideration, decision, visitors, leads, marketing qualified leads, sales qualified leads.
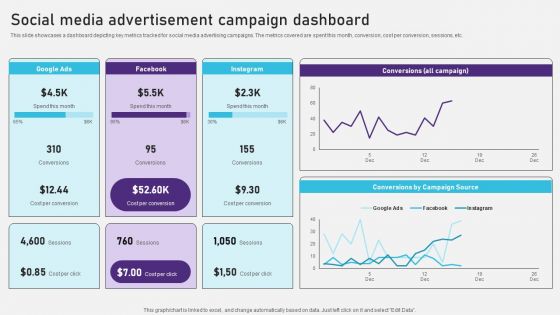
Advertising Campaign Optimization Process Social Media Advertisement Campaign Dashboard Graphics PDF
This slide showcases a dashboard depicting key metrics tracked for social media advertising campaigns. The metrics covered are spent this month, conversion, cost per conversion, sessions, etc. Do you have to make sure that everyone on your team knows about any specific topic I yes, then you should give Advertising Campaign Optimization Process Social Media Advertisement Campaign Dashboard Graphics PDF a try. Our experts have put a lot of knowledge and effort into creating this impeccable Advertising Campaign Optimization Process Social Media Advertisement Campaign Dashboard Graphics PDF. You can use this template for your upcoming presentations, as the slides are perfect to represent even the tiniest detail. You can download these templates from the Slidegeeks website and these are easy to edit. So grab these today.
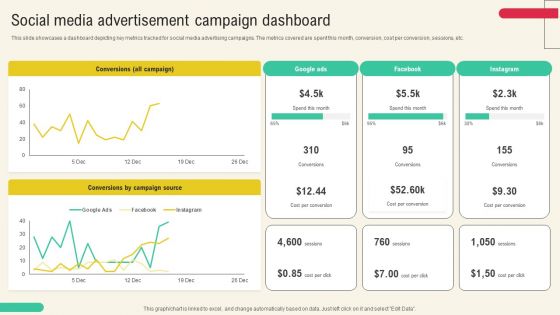
Client Acquisition Through Marketing Campaign Social Media Advertisement Campaign Dashboard Clipart PDF
This slide showcases a dashboard depicting key metrics tracked for social media advertising campaigns. The metrics covered are spent this month, conversion, cost per conversion, sessions, etc. Get a simple yet stunning designed Client Acquisition Through Marketing Campaign Social Media Advertisement Campaign Dashboard Clipart PDF. It is the best one to establish the tone in your meetings. It is an excellent way to make your presentations highly effective. So, download this PPT today from Slidegeeks and see the positive impacts. Our easy to edit Client Acquisition Through Marketing Campaign Social Media Advertisement Campaign Dashboard Clipart PDF can be your go to option for all upcoming conferences and meetings. So, what are you waiting for Grab this template today.

Communication Barriers Manager Dashboard For Analyzing Ppt PowerPoint Presentation Inspiration Grid PDF
This slide represents the dashboard of communication manager. It includes KPIs such as current conversation, performance, customers and opportunities.Pitch your topic with ease and precision using this Communication Barriers Manager Dashboard For Analyzing Ppt PowerPoint Presentation Inspiration Grid PDF. This layout presents information on Current Conversation, Economic Indicator, Conversation Calls. It is also available for immediate download and adjustment. So, changes can be made in the color, design, graphics or any other component to create a unique layout.
Brand Plan Toolkit For Marketers Overall Brand Performance Tracking Dashboard Rules PDF
This slide provides information regarding brand performance tracking dashboard capturing KPIs such as brand metric, brand commitment, advertising metrics, and purchase metrics. From laying roadmaps to briefing everything in detail, our templates are perfect for you. You can set the stage with your presentation slides. All you have to do is download these easy to edit and customizable templates. Brand Plan Toolkit For Marketers Overall Brand Performance Tracking Dashboard Rules PDF will help you deliver an outstanding performance that everyone would remember and praise you for. Do download this presentation today.
Instructions For Brand Performance Management Team Overall Brand Performance Tracking Dashboard Formats PDF
This slide provides information regarding brand performance tracking dashboard capturing KPIs such as brand metric, brand commitment, advertising metrics, and purchase metrics. Present like a pro with Instructions For Brand Performance Management Team Overall Brand Performance Tracking Dashboard Formats PDF Create beautiful presentations together with your team, using our easy to use presentation slides. Share your ideas in real time and make changes on the fly by downloading our templates. So whether you are in the office, on the go, or in a remote location, you can stay in sync with your team and present your ideas with confidence. With Slidegeeks presentation got a whole lot easier. Grab these presentations today.
Toolkit To Administer Tactical Overall Brand Performance Tracking Dashboard Mockup PDF
This slide provides information regarding brand performance tracking dashboard capturing KPIs such as brand metric, brand commitment, advertising metrics, and purchase metrics. The best PPT templates are a great way to save time, energy, and resources. Slidegeeks have 100 percent editable powerpoint slides making them incredibly versatile. With these quality presentation templates, you can create a captivating and memorable presentation by combining visually appealing slides and effectively communicating your message. Download Toolkit To Administer Tactical Overall Brand Performance Tracking Dashboard Mockup PDF from Slidegeeks and deliver a wonderful presentation.
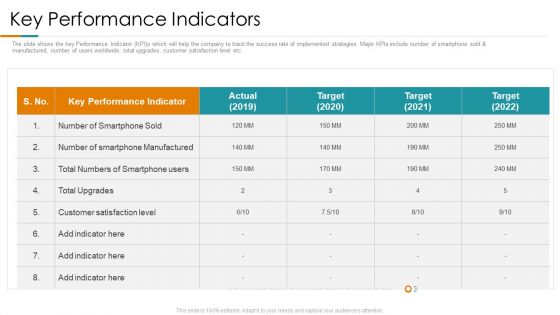
Key Performance Indicators Ppt Inspiration Layouts PDF
The slide shows the key Performance Indicator KPIs which will help the company to track the success rate of implemented strategies. Major KPIs include number of smartphone sold and manufactured, number of users worldwide, total upgrades, customer satisfaction level etc. Deliver an awe-inspiring pitch with this creative key performance indicators ppt inspiration layouts pdf. bundle. Topics like performance, target, manufactured can be discussed with this completely editable template. It is available for immediate download depending on the needs and requirements of the user.
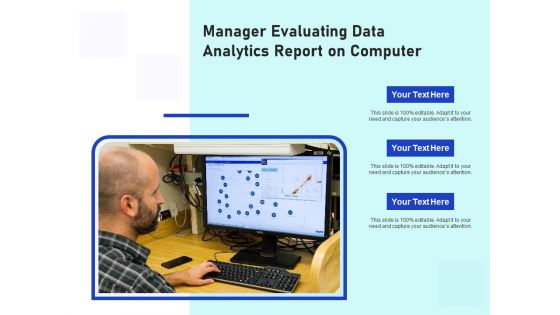
Manager Evaluating Data Analytics Report On Computer Ppt PowerPoint Presentation File Background PDF
Presenting manager evaluating data analytics report on computer ppt powerpoint presentation file background pdf to dispense important information. This template comprises one stages. It also presents valuable insights into the topics including manager evaluating data analytics report on computer. This is a completely customizable PowerPoint theme that can be put to use immediately. So, download it and address the topic impactfully.
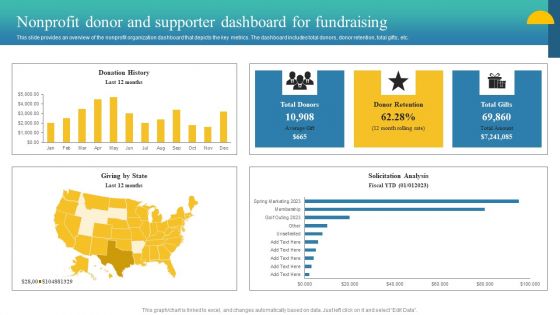
Charity Fundraising Marketing Plan Nonprofit Donor And Supporter Dashboard Rules PDF
This slide provides an overview of the nonprofit organization dashboard that depicts the key metrics. The dashboard includes total donors, donor retention, total gifts, etc. Create an editable Charity Fundraising Marketing Plan Nonprofit Donor And Supporter Dashboard Rules PDF that communicates your idea and engages your audience. Whether youre presenting a business or an educational presentation, pre-designed presentation templates help save time. Charity Fundraising Marketing Plan Nonprofit Donor And Supporter Dashboard Rules PDF is highly customizable and very easy to edit, covering many different styles from creative to business presentations. Slidegeeks has creative team members who have crafted amazing templates. So, go and get them without any delay.

Business Operations Dashboard Ppt PowerPoint Presentation Styles Pictures PDF
This slide shows dashboard for measuring business operations. It includes details of total production, weekly average production, scrap and scrap average in each production line. It also covers daily production statistics, production trend, project summary, events and distribution.Deliver an awe-inspiring pitch with this creative business operations dashboard ppt powerpoint presentation styles pictures pdf. bundle. Topics like production trend, daily production, production summary, distribution can be discussed with this completely editable template. It is available for immediate download depending on the needs and requirements of the user.
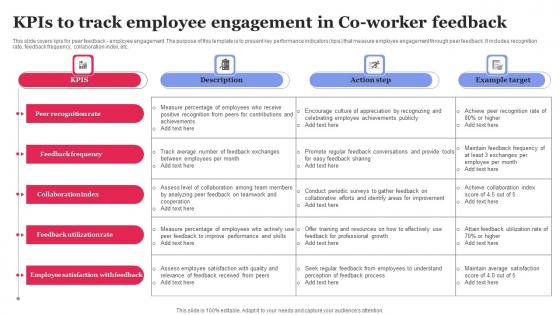
KPIS To Track Employee Engagement In Co Worker Feedback Inspiration Pdf
This slide covers kpis for peer feedback employee engagement. The purpose of this template is to present key performance indicators kpis that measure employee engagement through peer feedback. It includes recognition rate, feedback frequency, collaboration index, etc. Showcasing this set of slides titled KPIS To Track Employee Engagement In Co Worker Feedback Inspiration Pdf The topics addressed in these templates are Peer Recognition Rate, Feedback Frequency, Collaboration Index All the content presented in this PPT design is completely editable. Download it and make adjustments in color, background, font etc. as per your unique business setting. This slide covers kpis for peer feedback employee engagement. The purpose of this template is to present key performance indicators kpis that measure employee engagement through peer feedback. It includes recognition rate, feedback frequency, collaboration index, etc.
Quantitative Data Analysis Icon For Predictive Modelling Ppt Ideas Images PDF
Presenting Quantitative Data Analysis Icon For Predictive Modelling Ppt Ideas Images PDF to dispense important information. This template comprises one stages. It also presents valuable insights into the topics including Quantitative Data, Analysis Icon, Predictive Modelling. This is a completely customizable PowerPoint theme that can be put to use immediately. So, download it and address the topic impactfully.
Strategies To Maintain Transportation Shipping And Logistics Tracking Dashboard With Shipments Ppt Infographics Information PDF
This slide covers Key performance indicators to track the automation system of the company. This dashboard includes Logistics Efficiency Status, delivery time accuracy etc. Presenting this PowerPoint presentation, titled Strategies To Maintain Transportation Shipping And Logistics Tracking Dashboard With Shipments Ppt Infographics Information PDF, with topics curated by our researchers after extensive research. This editable presentation is available for immediate download and provides attractive features when used. Download now and captivate your audience. Presenting this Strategies To Maintain Transportation Shipping And Logistics Tracking Dashboard With Shipments Ppt Infographics Information PDF. Our researchers have carefully researched and created these slides with all aspects taken into consideration. This is a completely customizable Strategies To Maintain Transportation Shipping And Logistics Tracking Dashboard With Shipments Ppt Infographics Information PDF that is available for immediate downloading. Download now and make an impact on your audience. Highlight the attractive features available with our PPTs.
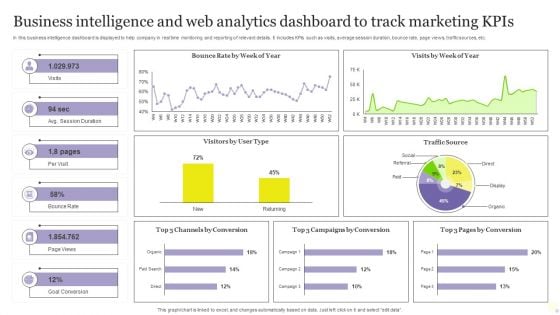
Business Intelligence And Web Analytics Dashboard To Track Marketing Kpis Inspiration PDF
In this business intelligence dashboard is displayed to help company in real time monitoring and reporting of relevant details. It includes KPIs such as visits, average session duration, bounce rate, page views, traffic sources, etc. Showcasing this set of slides titled Business Intelligence And Web Analytics Dashboard To Track Marketing Kpis Inspiration PDF. The topics addressed in these templates are Goal Conversion, Track Marketing Kpis, Web Analytics Dashboard. All the content presented in this PPT design is completely editable. Download it and make adjustments in color, background, font etc. as per your unique business setting.
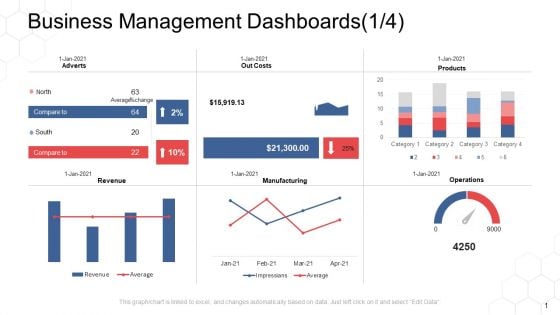
Corporate Regulation Business Management Dashboards Costs Ppt Pictures Show PDF
Deliver and pitch your topic in the best possible manner with this corporate regulation business management dashboards costs ppt pictures show pdf. Use them to share invaluable insights on revenue, manufacturing, operations, products, costs and impress your audience. This template can be altered and modified as per your expectations. So, grab it now.
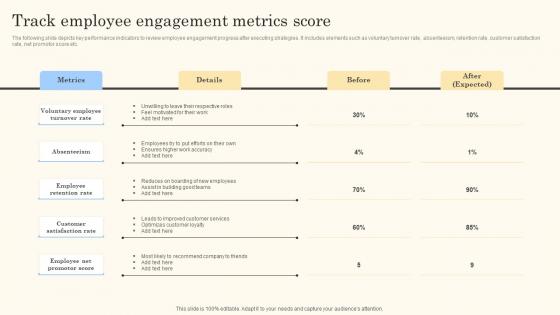
Track Employee Engagement Metrics Score Action Steps For Employee Engagement Slides Pdf
The following slide depicts key performance indicators to review employee engagement progress after executing strategies. It includes elements such as voluntary turnover rate, absenteeism, retention rate, customer satisfaction rate, net promotor score etc.Make sure to capture your audiences attention in your business displays with our gratis customizable Track Employee Engagement Metrics Score Action Steps For Employee Engagement Slides Pdf. These are great for business strategies, office conferences, capital raising or task suggestions. If you desire to acquire more customers for your tech business and ensure they stay satisfied, create your own sales presentation with these plain slides. The following slide depicts key performance indicators to review employee engagement progress after executing strategies. It includes elements such as voluntary turnover rate, absenteeism, retention rate, customer satisfaction rate, net promotor score etc.
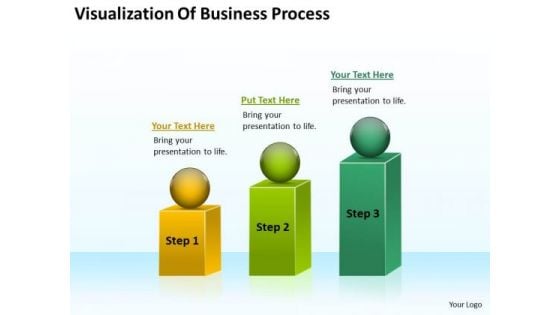
Visualization Of Business Process Ppt Plan PowerPoint Templates
We present our visualization of business process ppt plan PowerPoint templates.Present our Process and Flows PowerPoint Templates because Our PowerPoint Templates and Slides will Embellish your thoughts. They will help you illustrate the brilliance of your ideas. Download and present our Spheres PowerPoint Templates because It will Raise the bar of your Thoughts. They are programmed to take you to the next level. Use our Flow Charts PowerPoint Templates because Our PowerPoint Templates and Slides are conceived by a dedicated team. Use them and give form to your wondrous ideas. Use our Shapes PowerPoint Templates because Our PowerPoint Templates and Slides has conjured up a web of all you need with the help of our great team. Use them to string together your glistening ideas. Download and present our Marketing PowerPoint Templates because Our PowerPoint Templates and Slides will let you Leave a lasting impression to your audiences. They possess an inherent longstanding recall factor.Use these PowerPoint slides for presentations relating to Diagram, chart, market, statistics, square, grow, infograph, bar, corporate, business, vector, success, presentation, growing, circle, finance,analyst, goal, report, marketing, different, accounting, management, graph, illustration, geometric, sphere, design, growth, infographic, progress, profit,information, increase, aim, analyze, financial, rising, measure, block. The prominent colors used in the PowerPoint template are Green, Green lime, Yellow. Make an exhibition characteristic of you. Display your effectiveness on our Visualization Of Business Process Ppt Plan PowerPoint Templates.
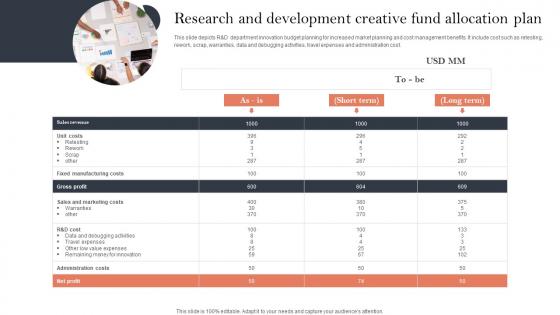
Research And Development Creative Fund Allocation Plan Pictures Pdf
This slide depicts RandD department innovation budget planning for increased market planning and cost management benefits. It include cost such as retesting, rework, scrap, warranties, data and debugging activities, travel expenses and administration cost. Showcasing this set of slides titled Research And Development Creative Fund Allocation Plan Pictures Pdf. The topics addressed in these templates are Gross Profit, Administration Costs, Net Profit. All the content presented in this PPT design is completely editable. Download it and make adjustments in color, background, font etc. as per your unique business setting. This slide depicts RandD department innovation budget planning for increased market planning and cost management benefits. It include cost such as retesting, rework, scrap, warranties, data and debugging activities, travel expenses and administration cost.
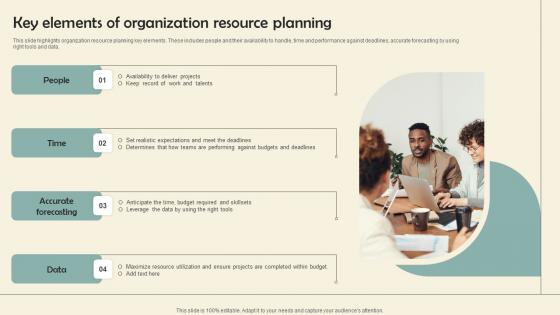
Key Elements Of Organization Resource Planning Pictures Pdf
This slide highlights organization resource planning key elements. These includes people and their availability to handle, time and performance against deadlines, accurate forecasting by using right tools and data.Pitch your topic with ease and precision using this Key Elements Of Organization Resource Planning Pictures Pdf This layout presents information on Accurate Forecasting, Budget Required Skillsets, Completed Budget It is also available for immediate download and adjustment. So, changes can be made in the color, design, graphics or any other component to create a unique layout. This slide highlights organization resource planning key elements. These includes people and their availability to handle, time and performance against deadlines, accurate forecasting by using right tools and data.
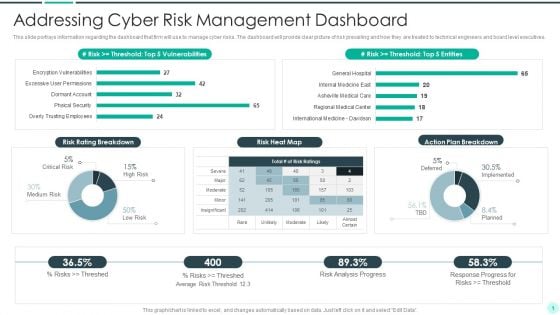
Executing Advance Data Analytics At Workspace Addressing Cyber Risk Guidelines PDF
This slide portrays information regarding the dashboard that firm will use to manage cyber risks. The dashboard will provide clear picture of risk prevailing and how they are treated to technical engineers and board level executives.Deliver an awe inspiring pitch with this creative executing advance data analytics at workspace addressing cyber risk guidelines pdf bundle. Topics like addressing cyber risk management dashboard can be discussed with this completely editable template. It is available for immediate download depending on the needs and requirements of the user.
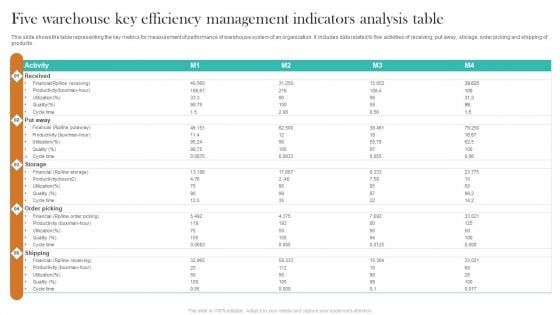
Five Warehouse Key Efficiency Management Indicators Analysis Table Demonstration PDF
This slide shows the table representing the key metrics for measurement of performance of warehouse system of an organization. It includes data related to five activities of receiving, put away, storage, order picking and shipping of products. Showcasing this set of slides titled Five Warehouse Key Efficiency Management Indicators Analysis Table Demonstration PDF. The topics addressed in these templates are Activity, Received, Storage. All the content presented in this PPT design is completely editable. Download it and make adjustments in color, background, font etc. as per your unique business setting.
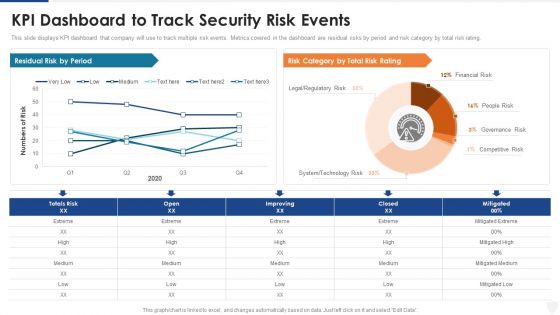
KPI Dashboard To Track Security Risk Events Ppt Pictures Deck PDF
This slide displays KPI dashboard that company will use to track multiple risk events. Metrics covered in the dashboard are residual risks by period and risk category by total risk rating. Deliver and pitch your topic in the best possible manner with this kpi dashboard to track security risk events ppt pictures deck pdf. Use them to share invaluable insights on technology risk, system, financial risk and impress your audience. This template can be altered and modified as per your expectations. So, grab it now.
Content Marketing Dashboard For Effective Tracking Ppt PowerPoint Presentation File Outline PDF
Purpose of the following slide is to show key metrics that can help the organization to track their content marketing efforts, these metrics are ad cost, visits, cost per click etc.. Do you have an important presentation coming up Are you looking for something that will make your presentation stand out from the rest Look no further than Content Marketing Dashboard For Effective Tracking Ppt PowerPoint Presentation File Outline PDF. With our professional designs, you can trust that your presentation will pop and make delivering it a smooth process. And with Slidegeeks, you can trust that your presentation will be unique and memorable. So why wait Grab Content Marketing Dashboard For Effective Tracking Ppt PowerPoint Presentation File Outline PDF today and make your presentation stand out from the rest.
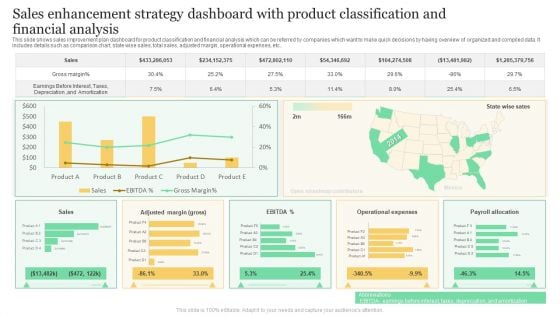
Sales Enhancement Strategy Dashboard With Product Classification And Financial Analysis Formats PDF
This slide shows sales improvement plan dashboard for product classification and financial analysis which can be referred by companies which want to make quick decisions by having overview of organized and compiled data. It includes details such as comparison chart, state wise sales, total sales, adjusted margin, operational expenses, etc. Showcasing this set of slides titled Sales Enhancement Strategy Dashboard With Product Classification And Financial Analysis Formats PDF. The topics addressed in these templates are Gross Margin, Sales, Operational Expenses. All the content presented in this PPT design is completely editable. Download it and make adjustments in color, background, font etc. as per your unique business setting.


 Continue with Email

 Home
Home


