Snapshot

Customer Loyalty Template 2 Ppt PowerPoint Presentation Portfolio Introduction
This is a customer loyalty template 2 ppt powerpoint presentation portfolio introduction. This is a two stage process. The stages in this process are customer loyalty lifecycle, loyalty program performance dashboard, business, opportunity, icons.
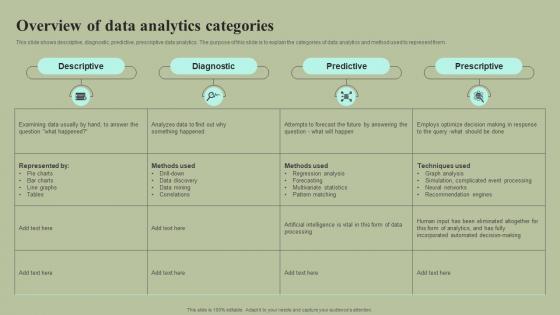
Overview Of Data Analytics Categories Cybernetic Integration Diagrams Pdf
This slide shows descriptive, diagnostic, predictive, prescriptive data analytics. The purpose of this slide is to explain the categories of data analytics and method used to represent them. Do you have an important presentation coming up Are you looking for something that will make your presentation stand out from the rest Look no further than Overview Of Data Analytics Categories Cybernetic Integration Diagrams Pdf With our professional designs, you can trust that your presentation will pop and make delivering it a smooth process. And with Slidegeeks, you can trust that your presentation will be unique and memorable. So why wait Grab Overview Of Data Analytics Categories Cybernetic Integration Diagrams Pdf today and make your presentation stand out from the rest. This slide shows descriptive, diagnostic, predictive, prescriptive data analytics. The purpose of this slide is to explain the categories of data analytics and method used to represent them.
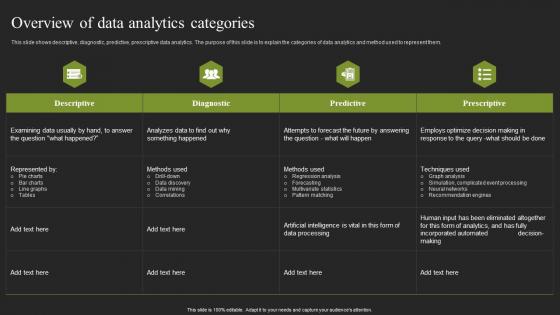
Overview Of Data Analytics Categories Cybernetic Systems Infographics Pdf
This slide shows descriptive, diagnostic, predictive, prescriptive data analytics. The purpose of this slide is to explain the categories of data analytics and method used to represent them. Create an editable Overview Of Data Analytics Categories Cybernetic Systems Infographics Pdf that communicates your idea and engages your audience. Whether you are presenting a business or an educational presentation, pre designed presentation templates help save time. Overview Of Data Analytics Categories Cybernetic Systems Infographics Pdf is highly customizable and very easy to edit, covering many different styles from creative to business presentations. Slidegeeks has creative team members who have crafted amazing templates. So, go and get them without any delay. This slide shows descriptive, diagnostic, predictive, prescriptive data analytics. The purpose of this slide is to explain the categories of data analytics and method used to represent them.
Step 2 Create Detailed Data Tracking Plan Product Analytics Implementation Data Analytics V
This slide provides a detailed plan for XYZ company aimed at tracking customer data to personalize product features and recommendations. It covers details under various heads such as event, description, properties, source, location, code, user ID, timestamp and status Formulating a presentation can take up a lot of effort and time, so the content and message should always be the primary focus. The visuals of the PowerPoint can enhance the presenters message, so our Step 2 Create Detailed Data Tracking Plan Product Analytics Implementation Data Analytics V was created to help save time. Instead of worrying about the design, the presenter can concentrate on the message while our designers work on creating the ideal templates for whatever situation is needed. Slidegeeks has experts for everything from amazing designs to valuable content, we have put everything into Step 2 Create Detailed Data Tracking Plan Product Analytics Implementation Data Analytics V. This slide provides a detailed plan for XYZ company aimed at tracking customer data to personalize product features and recommendations. It covers details under various heads such as event, description, properties, source, location, code, user ID, timestamp and status
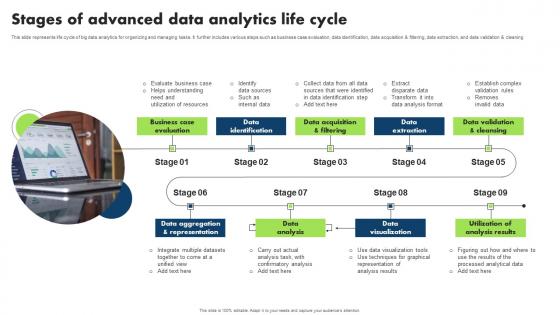
Stages Of Advanced Data Analytics Life Cycle Diagrams Pdf
This slide represents life cycle of big data analytics for organizing and managing tasks. It further includes various steps such as business case evaluation, data identification, data acquisition and filtering, data extraction, and data validation and cleaning Showcasing this set of slides titled Stages Of Advanced Data Analytics Life Cycle Diagrams Pdf. The topics addressed in these templates are Business Case Evaluation, Data Identification, Data Extraction. All the content presented in this PPT design is completely editable. Download it and make adjustments in color, background, font etc. as per your unique business setting. This slide represents life cycle of big data analytics for organizing and managing tasks. It further includes various steps such as business case evaluation, data identification, data acquisition and filtering, data extraction, and data validation and cleaning
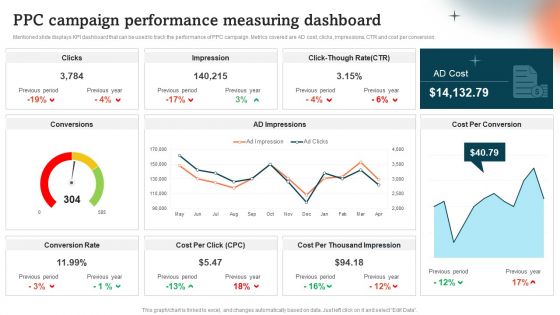
Ppc Campaign Performance Measuring Dashboard Guide To Personal Branding Pictures PDF
Mentioned slide displays KPI dashboard that can be used to track the performance of PPC campaign. Metrics covered are AD cost, clicks, impressions, CTR and cost per conversion.Presenting this PowerPoint presentation, titled Ppc Campaign Performance Measuring Dashboard Guide To Personal Branding Pictures PDF, with topics curated by our researchers after extensive research. This editable presentation is available for immediate download and provides attractive features when used. Download now and captivate your audience. Presenting this Ppc Campaign Performance Measuring Dashboard Guide To Personal Branding Pictures PDF. Our researchers have carefully researched and created these slides with all aspects taken into consideration. This is a completely customizable Ppc Campaign Performance Measuring Dashboard Guide To Personal Branding Pictures PDF that is available for immediate downloading. Download now and make an impact on your audience. Highlight the attractive features available with our PPTs.
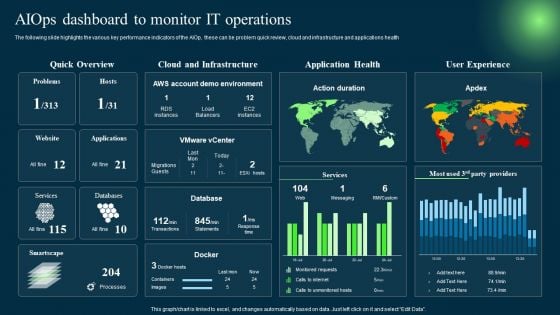
Introduction To Artificial Intelligence In Operation Management Industry Aiops Dashboard To Monitor IT Operations Clipart PDF
The following slide highlights the various key performance indicators of the AIOp, these can be problem quick review, cloud and infrastructure and applications health. Create an editable Introduction To Artificial Intelligence In Operation Management Industry Aiops Dashboard To Monitor IT Operations Clipart PDF that communicates your idea and engages your audience. Whether you are presenting a business or an educational presentation, pre-designed presentation templates help save time. Introduction To Artificial Intelligence In Operation Management Industry Aiops Dashboard To Monitor IT Operations Clipart PDF is highly customizable and very easy to edit, covering many different styles from creative to business presentations. Slidegeeks has creative team members who have crafted amazing templates. So, go and get them without any delay.
Direct Marketing Dashboard For Tracking Business Revenues Efficient B2B And B2C Marketing Techniques For Organization Elements PDF
Purpose of the following slide is to show key metrics that can help the organization to track direct marketing efforts, it highlights essential KPIs such as NPS, customer by location etc.This Direct Marketing Dashboard For Tracking Business Revenues Efficient B2B And B2C Marketing Techniques For Organization Elements PDF is perfect for any presentation, be it in front of clients or colleagues. It is a versatile and stylish solution for organizing your meetings. The Direct Marketing Dashboard For Tracking Business Revenues Efficient B2B And B2C Marketing Techniques For Organization Elements PDF features a modern design for your presentation meetings. The adjustable and customizable slides provide unlimited possibilities for acing up your presentation. Slidegeeks has done all the homework before launching the product for you. So, do not wait, grab the presentation templates today.
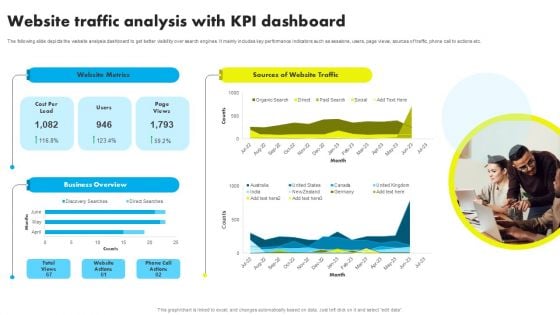
Website Traffic Analysis With KPI Dashboard Ppt Visual Aids Slides PDF

Infrastructure Supervision Infrastructure Monitoring Dashboard Ppt PowerPoint Presentation File Professional PDF
This slide covers the dashboard which can be used to monitor the server count, geo activity, processor, memory space, network security, etc. Deliver an awe inspiring pitch with this creative Infrastructure Supervision Infrastructure Monitoring Dashboard Ppt PowerPoint Presentation File Professional PDF bundle. Topics like Calendar, Clock, Geo Activity, OS Assessment, Host Pending Reboot, Change Tracking can be discussed with this completely editable template. It is available for immediate download depending on the needs and requirements of the user.
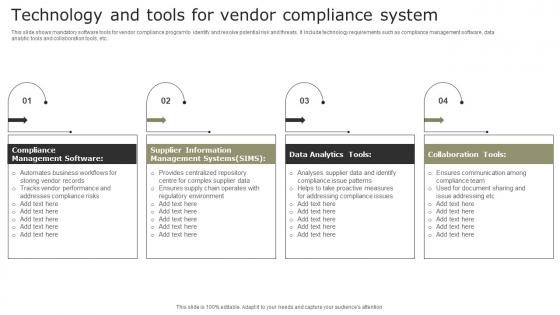
Technology And Tools For Vendor Compliance System Pictures Pdf
This slide shows mandatory software tools for vendor compliance program to identify and resolve potential risk and threats. It include technology requirements such as compliance management software, data analytic tools and collaboration tools, etc. Pitch your topic with ease and precision using this Technology And Tools For Vendor Compliance System Pictures Pdf. This layout presents information on Compliance Management Software, Data Analytics Tools, Collaboration Tools. It is also available for immediate download and adjustment. So, changes can be made in the color, design, graphics or any other component to create a unique layout. This slide shows mandatory software tools for vendor compliance program to identify and resolve potential risk and threats. It include technology requirements such as compliance management software, data analytic tools and collaboration tools, etc.
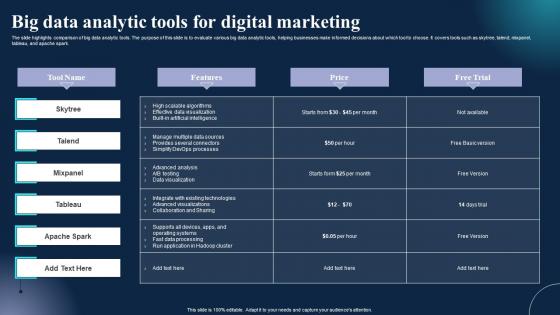
Big Data Analytic Tools For Digital Marketing Information Pdf
The slide highlights comparison of big data analytic tools. The purpose of this slide is to evaluate various big data analytic tools, helping businesses make informed decisions about which tool to choose. It covers tools such as skytree, talend, mixpanel, tableau, and apache spark. Pitch your topic with ease and precision using this Big Data Analytic Tools For Digital Marketing Information Pdf. This layout presents information on Tool Name, Features, Price. It is also available for immediate download and adjustment. So, changes can be made in the color, design, graphics or any other component to create a unique layout. The slide highlights comparison of big data analytic tools. The purpose of this slide is to evaluate various big data analytic tools, helping businesses make informed decisions about which tool to choose. It covers tools such as skytree, talend, mixpanel, tableau, and apache spark.
Positive Marketing For Corporate Dashboard For Tracking Marketing Activities At Social Topics PDF
This slide covers information regarding the dashboard for tracking essential marketing activities at social media platform in terms of social traffic and conversion, referral traffic by site, key social media metrics. Deliver and pitch your topic in the best possible manner with this positive marketing for corporate dashboard for tracking marketing activities at social topics pdf. Use them to share invaluable insights on social events, social traffic and conversion and impress your audience. This template can be altered and modified as per your expectations. So, grab it now.
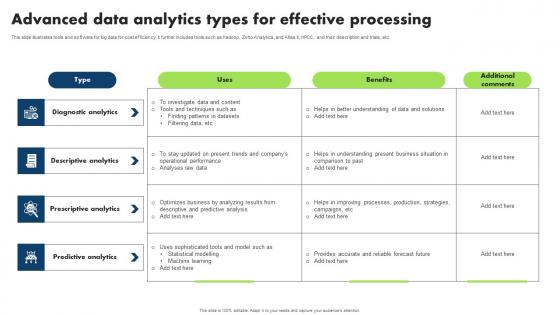
Advanced Data Analytics Types For Effective Processing Microsoft Pdf
This slide illustrates tools and software for big data for cost efficiency. It further includes tools such as Hadoop, Zoho Analytics, and Atlas.ti, HPCC, and their description and trials, etc Showcasing this set of slides titled Advanced Data Analytics Types For Effective Processing Microsoft Pdf. The topics addressed in these templates are Diagnostic Analytics, Descriptive Analytics, Prescriptive Analytics. All the content presented in this PPT design is completely editable. Download it and make adjustments in color, background, font etc. as per your unique business setting. This slide illustrates tools and software for big data for cost efficiency. It further includes tools such as Hadoop, Zoho Analytics, and Atlas.ti, HPCC, and their description and trials, etc
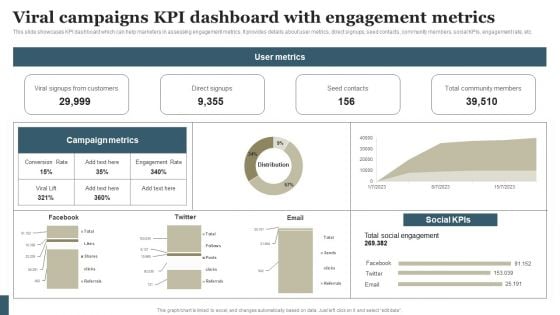
Viral Marketing Techniques To Increase Annual Business Sales Viral Campaigns KPI Dashboard With Engagement Guidelines PDF
This slide showcases KPI dashboard which can help marketers in assessing engagement metrics. It provides details about user metrics, direct signups, seed contacts, community members, social KPIs, engagement rate, etc. Present like a pro with Viral Marketing Techniques To Increase Annual Business Sales Viral Campaigns KPI Dashboard With Engagement Guidelines PDF Create beautiful presentations together with your team, using our easy-to-use presentation slides. Share your ideas in real-time and make changes on the fly by downloading our templates. So whether you are in the office, on the go, or in a remote location, you can stay in sync with your team and present your ideas with confidence. With Slidegeeks presentation got a whole lot easier. Grab these presentations today.
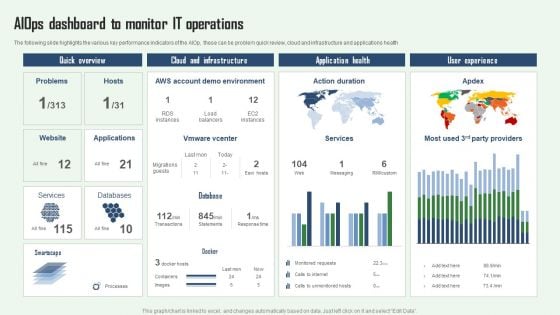
Aiops Dashboard To Monitor IT Operations Aiops Integration Summary Report Clipart PDF
The following slide highlights the various key performance indicators of the AIOp, these can be problem quick review, cloud and infrastructure and applications health. If you are looking for a format to display your unique thoughts, then the professionally designed Aiops Dashboard To Monitor IT Operations Aiops Integration Summary Report Clipart PDF is the one for you. You can use it as a Google Slides template or a PowerPoint template. Incorporate impressive visuals, symbols, images, and other charts. Modify or reorganize the text boxes as you desire. Experiment with shade schemes and font pairings. Alter, share or cooperate with other people on your work. Download Aiops Dashboard To Monitor IT Operations Aiops Integration Summary Report Clipart PDF and find out how to give a successful presentation. Present a perfect display to your team and make your presentation unforgettable.
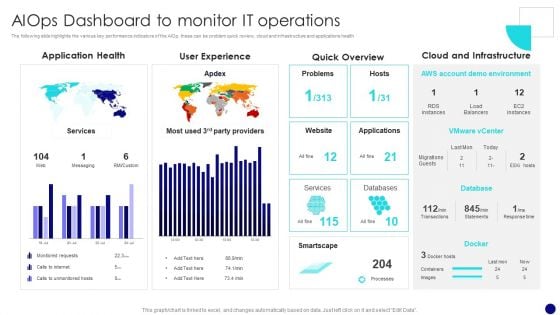
Information Technology Operations Administration With ML Aiops Dashboard To Monitor Diagrams PDF
The following slide highlights the various key performance indicators of the AIOp, these can be problem quick review, cloud and infrastructure and applications health. If you are looking for a format to display your unique thoughts, then the professionally designed Information Technology Operations Administration With ML Aiops Dashboard To Monitor Diagrams PDF is the one for you. You can use it as a Google Slides template or a PowerPoint template. Incorporate impressive visuals, symbols, images, and other charts. Modify or reorganize the text boxes as you desire. Experiment with shade schemes and font pairings. Alter, share or cooperate with other people on your work. Download Information Technology Operations Administration With ML Aiops Dashboard To Monitor Diagrams PDF and find out how to give a successful presentation. Present a perfect display to your team and make your presentation unforgettable.

Operational Strategy For ML In IT Sector Aiops Dashboard To Monitor IT Operations Diagrams PDF
The following slide highlights the various key performance indicators of the AIOps, these can be problem quick review, cloud and infrastructure and applications health If you are looking for a format to display your unique thoughts, then the professionally designed Operational Strategy For ML In IT Sector Aiops Dashboard To Monitor IT Operations Diagrams PDF is the one for you. You can use it as a Google Slides template or a PowerPoint template. Incorporate impressive visuals, symbols, images, and other charts. Modify or reorganize the text boxes as you desire. Experiment with shade schemes and font pairings. Alter, share or cooperate with other people on your work. Download Operational Strategy For ML In IT Sector Aiops Dashboard To Monitor IT Operations Diagrams PDF and find out how to give a successful presentation. Present a perfect display to your team and make your presentation unforgettable.
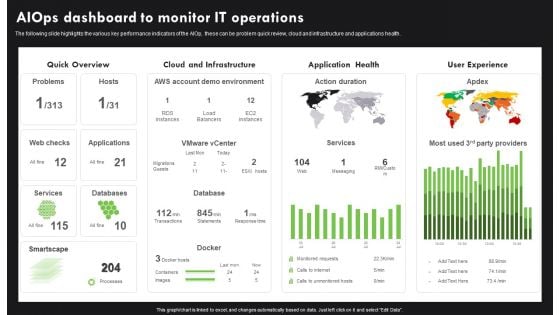
AI Deployment In IT Process Aiops Dashboard To Monitor IT Operations Infographics PDF
The following slide highlights the various key performance indicators of the AIOp, these can be problem quick review, cloud and infrastructure and applications health. If you are looking for a format to display your unique thoughts, then the professionally designed AI Deployment In IT Process Aiops Dashboard To Monitor IT Operations Infographics PDF is the one for you. You can use it as a Google Slides template or a PowerPoint template. Incorporate impressive visuals, symbols, images, and other charts. Modify or reorganize the text boxes as you desire. Experiment with shade schemes and font pairings. Alter, share or cooperate with other people on your work. Download AI Deployment In IT Process Aiops Dashboard To Monitor IT Operations Infographics PDF and find out how to give a successful presentation. Present a perfect display to your team and make your presentation unforgettable.
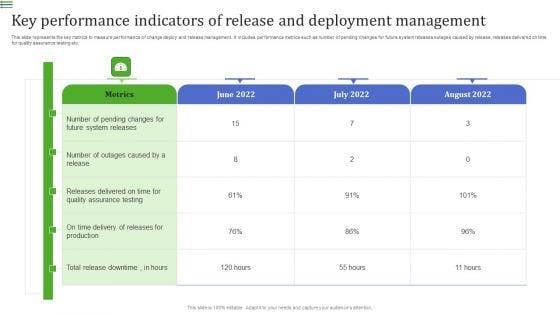
Key Performance Indicators Of Release And Deployment Management Demonstration PDF
This slide represents the key metrics to measure performance of change deploy and release management. It includes performance metrics such as number of pending changes for future system releases outages caused by release, releases delivered on time for quality assurance testing etc.Pitch your topic with ease and precision using this Key Performance Indicators Of Release And Deployment Management Demonstration PDF. This layout presents information on System Releases, Assurance Testing, Outages Caused. It is also available for immediate download and adjustment. So, changes can be made in the color, design, graphics or any other component to create a unique layout.
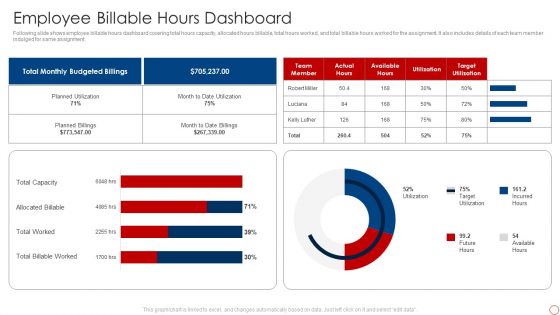
Kpis For Evaluating Business Sustainability Employee Billable Hours Dashboard Professional PDF
Following slide shows employee billable hours dashboard covering total hours capacity, allocated hours billable, total hours worked, and total billable hours worked for the assignment. It also includes details of each team member indulged for same assignment. Deliver and pitch your topic in the best possible manner with this Kpis For Evaluating Business Sustainability Employee Billable Hours Dashboard Professional PDF. Use them to share invaluable insights on Total Billable Worked, Total Worked, Allocated Billable, Total Capacity and impress your audience. This template can be altered and modified as per your expectations. So, grab it now.
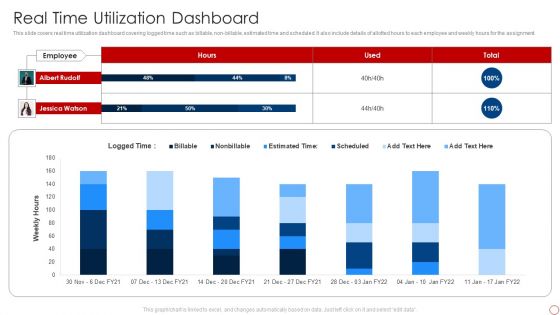
Kpis For Evaluating Business Sustainability Real Time Utilization Dashboard Portrait PDF
This slide covers real time utilization dashboard covering logged time such as billable, non-billable, estimated time and scheduled. It also include details of allotted hours to each employee and weekly hours for the assignment. Deliver an awe inspiring pitch with this creative Kpis For Evaluating Business Sustainability Real Time Utilization Dashboard Portrait PDF bundle. Topics like Logged Time, Employee, Albert Rudolf can be discussed with this completely editable template. It is available for immediate download depending on the needs and requirements of the user.
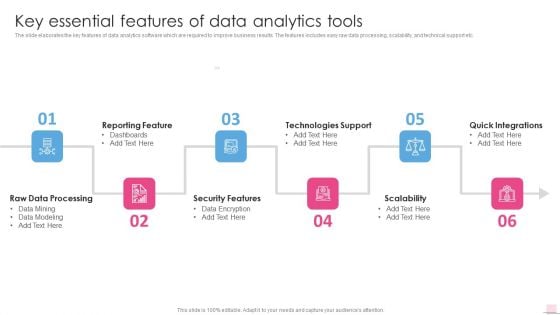
Key Essential Features Of Data Analytics Tools Business Analysis Modification Toolkit Structure PDF
The slide elaborates the key features of data analytics software which are required to improve business results. The features includes easy raw data processing, scalability, and technical support etc.This is a Key Essential Features Of Data Analytics Tools Business Analysis Modification Toolkit Structure PDF template with various stages. Focus and dispense information on six stages using this creative set, that comes with editable features. It contains large content boxes to add your information on topics like Reporting Feature, Security Features, Technologies Support. You can also showcase facts, figures, and other relevant content using this PPT layout. Grab it now.
Strategies To Mitigate Cyber Security Risks Dashboard Incident Tracking Ppt Model PDF
Presenting this set of slides with name strategies to mitigate cyber security risks dashboard incident tracking ppt model pdf. The topics discussed in these slides are application whitelisting, patch applications, patch operating systems, restrict admin privileges, disable untrusted microsoft office macros, user application hardening, multi factor authentication, daily backup important data. This is a completely editable PowerPoint presentation and is available for immediate download. Download now and impress your audience.
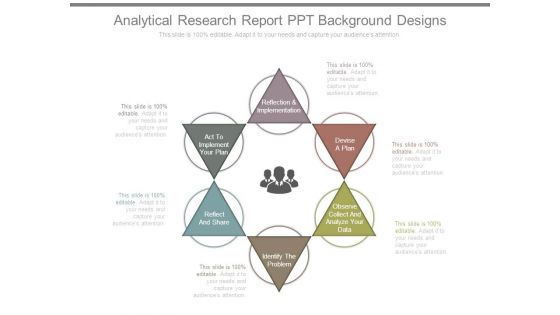
Analytical Research Report Ppt Background Designs
This is a analytical research report ppt background designs. This is a six stage process. The stages in this process are reflection and implementation, act to implement your plan, devise a plan, reflect and share, observe collect and analyze your data, identify the problem.
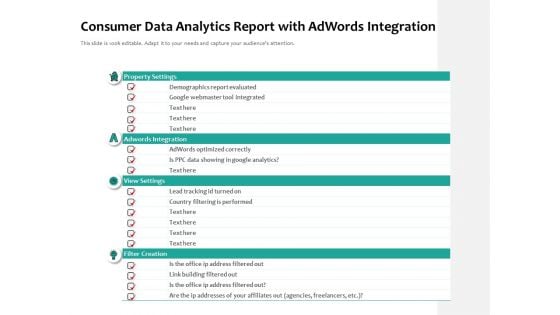
Consumer Data Analytics Report With Adwords Integration Ppt PowerPoint Presentation Gallery Sample PDF
Pitch your topic with ease and precision using this consumer data analytics report with adwords integration ppt powerpoint presentation gallery sample pdf. This layout presents information on property settings, adwords integration, view settings, filter creation. It is also available for immediate download and adjustment. So, changes can be made in the color, design, graphics or any other component to create a unique layout.
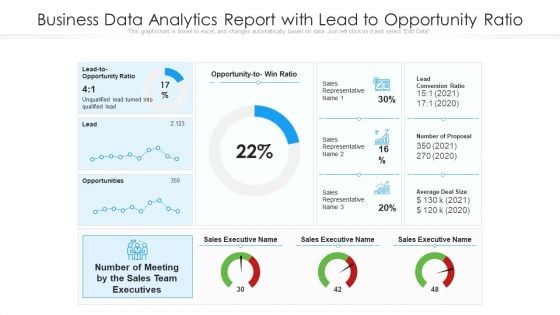
Business Data Analytics Report With Lead To Opportunity Ratio Ppt Styles Show PDF
Deliver an awe-inspiring pitch with this creative business data analytics report with lead to opportunity ratio ppt styles show pdf bundle. Topics like lead conversion ratio, sales team executives, average deal size can be discussed with this completely editable template. It is available for immediate download depending on the needs and requirements of the user.
Icon For Financial Analytics With Splunk Big Data Designs Pdf
Showcasing this set of slides titled Icon For Financial Analytics With Splunk Big Data Designs Pdf The topics addressed in these templates are Icon For Financial, Analytics With Splunk, Big Data All the content presented in this PPT design is completely editable. Download it and make adjustments in color, background, font etc. as per your unique business setting. Our Icon For Financial Analytics With Splunk Big Data Designs Pdf are topically designed to provide an attractive backdrop to any subject. Use them to look like a presentation pro.
Product Data Analytics Icon Showcasing Business Revenue Growth Structure Pdf
Showcasing this set of slides titled Product Data Analytics Icon Showcasing Business Revenue Growth Structure Pdf. The topics addressed in these templates are Product Data Analytics, Icon Showcasing Business, Revenue Growth. All the content presented in this PPT design is completely editable. Download it and make adjustments in color, background, font etc. as per your unique business setting. Our Product Data Analytics Icon Showcasing Business Revenue Growth Structure Pdf are topically designed to provide an attractive backdrop to any subject. Use them to look like a presentation pro.
Icon For Big Data Analytics In Digital Marketing Introduction Pdf
Pitch your topic with ease and precision using this Icon For Big Data Analytics In Digital Marketing Introduction Pdf. This layout presents information on Big Data, Analytics, Digital Marketing. It is also available for immediate download and adjustment. So, changes can be made in the color, design, graphics or any other component to create a unique layout. Our Icon For Big Data Analytics In Digital Marketing Introduction Pdf are topically designed to provide an attractive backdrop to any subject. Use them to look like a presentation pro.
Real Time Edge Data Analytics Icon Ideas Pdf
Pitch your topic with ease and precision using this Real Time Edge Data Analytics Icon Ideas Pdf This layout presents information on Real Time Edge, Data Analytics Icon It is also available for immediate download and adjustment. So, changes can be made in the color, design, graphics or any other component to create a unique layout. Our Real Time Edge Data Analytics Icon Ideas Pdf are topically designed to provide an attractive backdrop to any subject. Use them to look like a presentation pro.
Advanced Data Analytics In Cloud Computing Icon Summary Pdf
Pitch your topic with ease and precision using this Advanced Data Analytics In Cloud Computing Icon Summary Pdf. This layout presents information on Advanced Data Analytics, Cloud Computing Icon. It is also available for immediate download and adjustment. So, changes can be made in the color, design, graphics or any other component to create a unique layout. Our Advanced Data Analytics In Cloud Computing Icon Summary Pdf are topically designed to provide an attractive backdrop to any subject. Use them to look like a presentation pro.
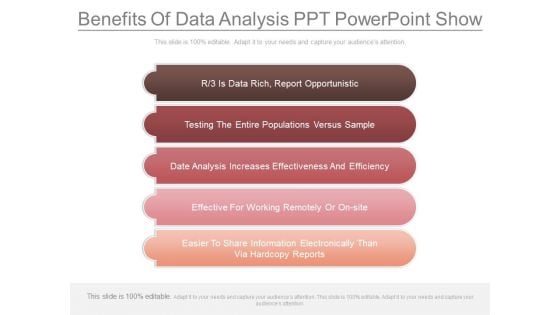
Benefits Of Data Analysis Ppt Powerpoint Show
This is a benefits of data analysis ppt powerpoint show. This is a five stage process. The stages in this process are r three is data rich, report opportunistic, testing the entire populations versus sample, date analysis increases effectiveness and efficiency, effective for working remotely or on site, easier to share information electronically than via hardcopy reports.
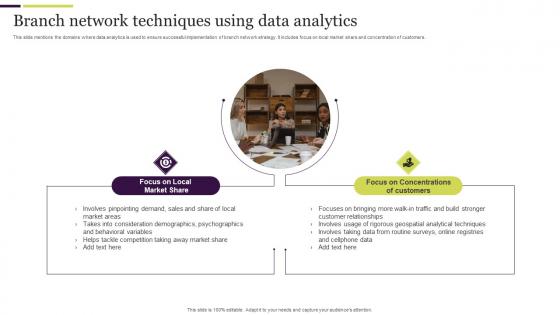
Branch Network Techniques Using Data Analytics Microsoft Pdf
This slide mentions the domains where data analytics is used to ensure successful implementation of branch network strategy. It includes focus on local market share and concentration of customers. Pitch your topic with ease and precision using this Branch Network Techniques Using Data Analytics Microsoft Pdf. This layout presents information on Concentrations Of Customers, Branch Network Techniques, Data Analytics. It is also available for immediate download and adjustment. So, changes can be made in the color, design, graphics or any other component to create a unique layout. This slide mentions the domains where data analytics is used to ensure successful implementation of branch network strategy. It includes focus on local market share and concentration of customers.
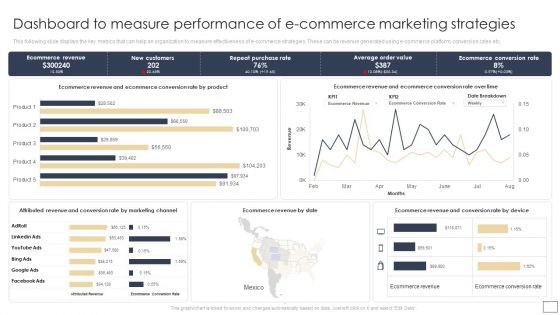
Dashboard To Measure Performance Of E Commerce Marketing Strategies Structure PDF
This following slide displays the key metrics that can help an organization to measure effectiveness of e-commerce strategies. These can be revenue generated using e-commerce platform, conversion rates etc.Create an editable Dashboard To Measure Performance Of E Commerce Marketing Strategies Structure PDF that communicates your idea and engages your audience. Whether you are presenting a business or an educational presentation, pre-designed presentation templates help save time. Dashboard To Measure Performance Of E Commerce Marketing Strategies Structure PDF is highly customizable and very easy to edit, covering many different styles from creative to business presentations. Slidegeeks has creative team members who have crafted amazing templates. So, go and get them without any delay.
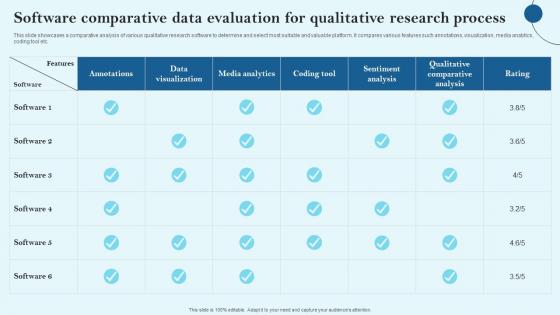
Software Comparative Data Evaluation For Qualitative Research Process Sample Pdf
This slide showcases a comparative analysis of various qualitative research software to determine and select most suitable and valuable platform. It compares various features such annotations, visualization, media analytics, coding tool etc. Pitch your topic with ease and precision using this Software Comparative Data Evaluation For Qualitative Research Process Sample Pdf This layout presents information on Annotations, Data Visualization, Media Analytics It is also available for immediate download and adjustment. So, changes can be made in the color, design, graphics or any other component to create a unique layout. This slide showcases a comparative analysis of various qualitative research software to determine and select most suitable and valuable platform. It compares various features such annotations, visualization, media analytics, coding tool etc.
B2B And B2C Startups Marketing Mix Strategies Content Marketing Dashboard For Effective Tracking Template PDF
Purpose of the following slide is to show key metrics that can help the organization to track their content marketing efforts, these metrics are ad cost, visits, cost per click etc. Boost your pitch with our creative B2B And B2C Startups Marketing Mix Strategies Content Marketing Dashboard For Effective Tracking Template PDF. Deliver an awe inspiring pitch that will mesmerize everyone. Using these presentation templates you will surely catch everyones attention. You can browse the ppts collection on our website. We have researchers who are experts at creating the right content for the templates. So you do not have to invest time in any additional work. Just grab the template now and use them.
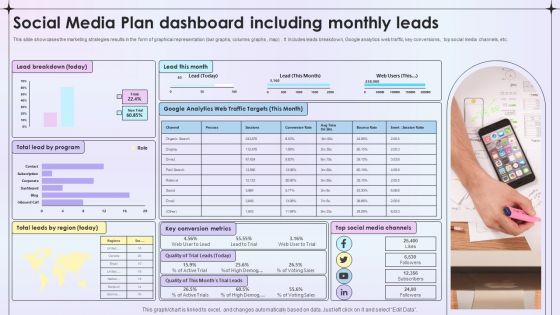
Social Media Plan Dashboard Including Monthly Leads Ppt File Slides PDF
This slide showcases the marketing strategies results in the form of graphical representation bar graphs, columns graphs , map. It includes leads breakdown, Google analytics web traffic, key conversions , top social media channels, etc. Showcasing this set of slides titled Social Media Plan Dashboard Including Monthly Leads Ppt File Slides PDF. The topics addressed in these templates are Lead Breakdown, Key Conversion Metrics, Social Media Channels. All the content presented in this PPT design is completely editable. Download it and make adjustments in color, background, font etc. as per your unique business setting.
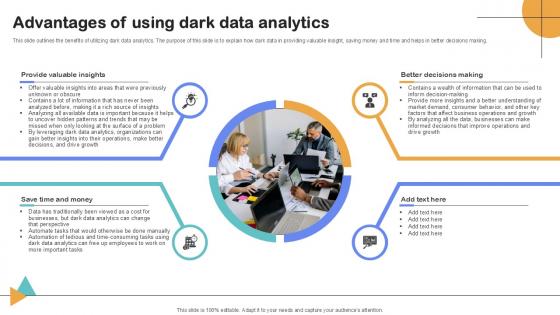
Advantages Of Using Dark Data Analytics Importance Of Unstructured Data Ppt Slide
This slide outlines the benefits of utilizing dark data analytics. The purpose of this slide is to explain how dark data in providing valuable insight, saving money and time and helps in better decisions making.Create an editable Advantages Of Using Dark Data Analytics Importance Of Unstructured Data Ppt Slide that communicates your idea and engages your audience. Whether you are presenting a business or an educational presentation, pre-designed presentation templates help save time. Advantages Of Using Dark Data Analytics Importance Of Unstructured Data Ppt Slide is highly customizable and very easy to edit, covering many different styles from creative to business presentations. Slidegeeks has creative team members who have crafted amazing templates. So, go and get them without any delay. This slide outlines the benefits of utilizing dark data analytics. The purpose of this slide is to explain how dark data in providing valuable insight, saving money and time and helps in better decisions making.
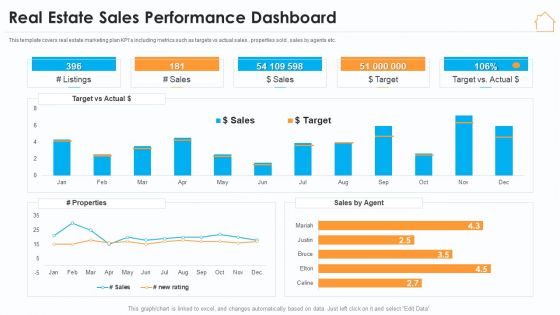
Real Estate Marketing Strategy Vendors Real Estate Sales Performance Dashboard Graphics PDF
This template covers real estate marketing plan KPIs including metrics such as targets vs actual sales , properties sold , sales by agents etc. Deliver an awe inspiring pitch with this creative real estate marketing strategy vendors real estate sales performance dashboard graphics pdf bundle. Topics like target, sales, performance dashboard can be discussed with this completely editable template. It is available for immediate download depending on the needs and requirements of the user.
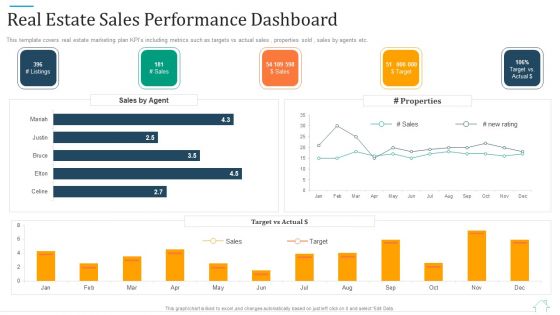
Promotional Strategy For Real Estate Project Real Estate Sales Performance Dashboard Information PDF
This template covers real estate marketing plan KPIs including metrics such as targets vs actual sales , properties sold , sales by agents etc. Deliver an awe inspiring pitch with this creative promotional strategy for real estate project real estate sales performance dashboard information pdf bundle. Topics like real estate sales performance dashboard can be discussed with this completely editable template. It is available for immediate download depending on the needs and requirements of the user.
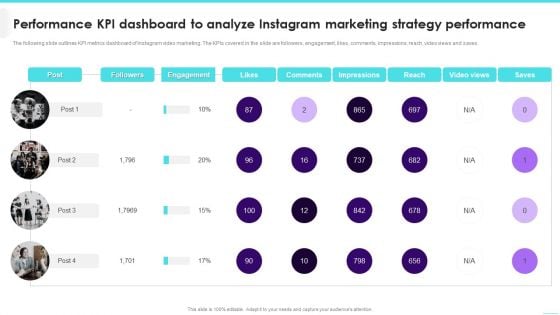
Performance KPI Dashboard To Analyze Instagram Marketing Strategy Performance Infographics PDF
The following slide outlines KPI metrics dashboard of Instagram video marketing. The KPIs covered in the slide are followers, engagement, likes, comments, impressions, reach, video views and saves.Deliver an awe inspiring pitch with this creative Performance KPI Dashboard To Analyze Instagram Marketing Strategy Performance Infographics PDF bundle. Topics like Engagement, Impressions, Comments can be discussed with this completely editable template. It is available for immediate download depending on the needs and requirements of the user.
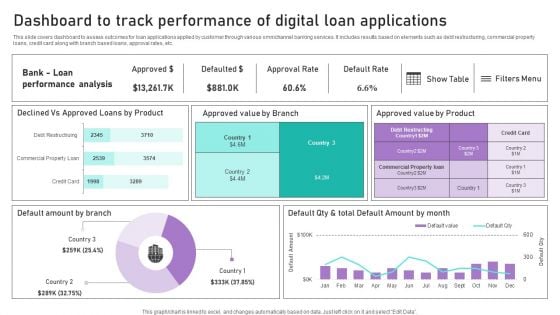
Dashboard To Track Performance Of Digital Loan Applications Ppt Infographics PDF
This slide covers dashboard to assess outcomes for loan applications applied by customer through various omnichannel banking services. It includes results based on elements such as debt restructuring, commercial property loans, credit card along with branch based loans, approval rates, etc. Are you in need of a template that can accommodate all of your creative concepts This one is crafted professionally and can be altered to fit any style. Use it with Google Slides or PowerPoint. Include striking photographs, symbols, depictions, and other visuals. Fill, move around, or remove text boxes as desired. Test out color palettes and font mixtures. Edit and save your work, or work with colleagues. Download Dashboard To Track Performance Of Digital Loan Applications Ppt Infographics PDF and observe how to make your presentation outstanding. Give an impeccable presentation to your group and make your presentation unforgettable.
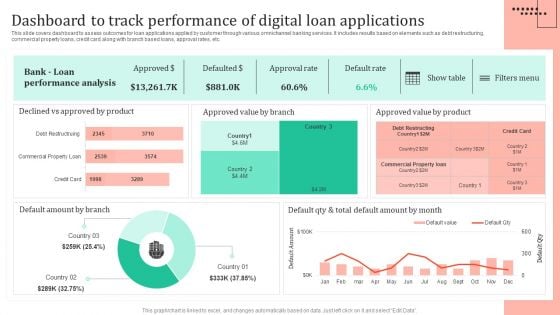
Omnichannel Strategy Implementation For Banking Solutions Dashboard To Track Performance Of Digital Summary PDF
This slide covers dashboard to assess outcomes for loan applications applied by customer through various omnichannel banking services. It includes results based on elements such as debt restructuring, commercial property loans, credit card along with branch based loans, approval rates, etc. Boost your pitch with our creative Omnichannel Strategy Implementation For Banking Solutions Dashboard To Track Performance Of Digital Summary PDF. Deliver an awe-inspiring pitch that will mesmerize everyone. Using these presentation templates you will surely catch everyones attention. You can browse the ppts collection on our website. We have researchers who are experts at creating the right content for the templates. So you do not have to invest time in any additional work. Just grab the template now and use them.
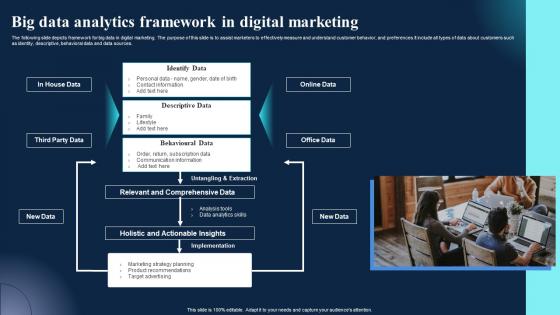
Big Data Analytics Framework In Digital Marketing Clipart Pdf
The following slide depicts framework for big data in digital marketing. The purpose of this slide is to assist marketers to effectively measure and understand customer behavior, and preferences.It include all types of data about customers such as identity, descriptive, behavioral data and data sources. Showcasing this set of slides titled Big Data Analytics Framework In Digital Marketing Clipart Pdf. The topics addressed in these templates are Online Data, Office Data, New Data. All the content presented in this PPT design is completely editable. Download it and make adjustments in color, background, font etc. as per your unique business setting. The following slide depicts framework for big data in digital marketing. The purpose of this slide is to assist marketers to effectively measure and understand customer behavior, and preferences.It include all types of data about customers such as identity, descriptive, behavioral data and data sources.
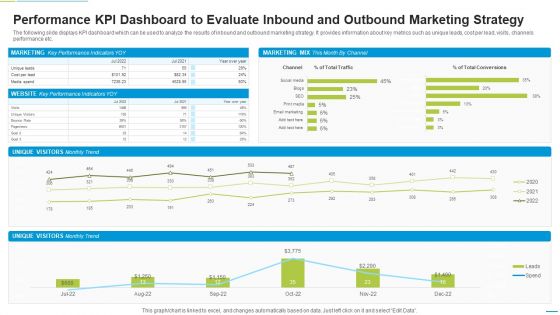
Performance KPI Dashboard To Evaluate Inbound And Outbound Marketing Strategy Mockup PDF
The following slide displays KPI dashboard which can be used to analyze the results of inbound and outbound marketing strategy. It provides information about key metrics such as unique leads, cost per lead, visits, channels performance etc. Showcasing this set of slides titled Performance KPI Dashboard To Evaluate Inbound And Outbound Marketing Strategy Mockup PDF. The topics addressed in these templates are Marketing, Unique Visitors, Cost Per Lead. All the content presented in this PPT design is completely editable. Download it and make adjustments in color, background, font etc. as per your unique business setting.
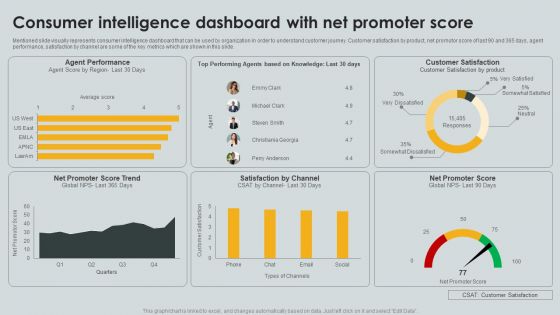
Consumer Intelligence Dashboard With Net Promoter Score Ppt PowerPoint Presentation File Templates PDF
Mentioned slide visually represents consumer intelligence dashboard that can be used by organization in order to understand customer journey. Customer satisfaction by product, net promotor score of last 90 and 365 days, agent performance, satisfaction by channel are some of the key metrics which are shown in this slide. Showcasing this set of slides titled Consumer Intelligence Dashboard With Net Promoter Score Ppt PowerPoint Presentation File Templates PDF. The topics addressed in these templates are Agent Performance, Satisfaction Channel, Net Promoter. All the content presented in this PPT design is completely editable. Download it and make adjustments in color, background, font etc. as per your unique business setting.
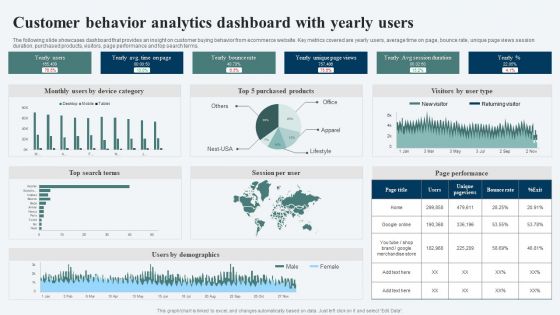
Customer Behavior Analytics Dashboard With Yearly Users Ppt Portfolio Ideas PDF
The following slide showcases dashboard that provides an insight on customer buying behavior from ecommerce website. Key metrics covered are yearly users, average time on page, bounce rate, unique page views session duration, purchased products, visitors, page performance and top search terms. Showcasing this set of slides titled Customer Behavior Analytics Dashboard With Yearly Users Ppt Portfolio Ideas PDF. The topics addressed in these templates are Yearly Users, Yearly Bounce Rate, Top Search Terms. All the content presented in this PPT design is completely editable. Download it and make adjustments in color, background, font etc. as per your unique business setting.
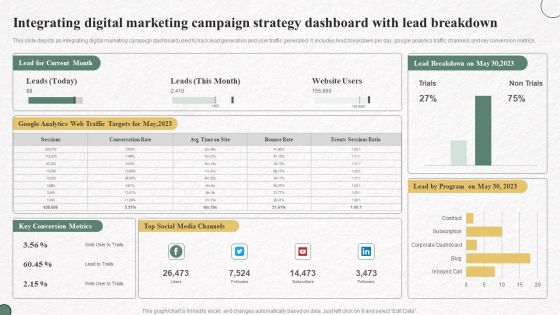
Integrating Digital Marketing Campaign Strategy Dashboard With Lead Breakdown Slides PDF
This slide depicts an integrating digital marketing campaign dashboard used to track lead generation and user traffic generated. It includes lead breakdown per day, google analytics traffic channels and key conversion metrics. Showcasing this set of slides titled Integrating Digital Marketing Campaign Strategy Dashboard With Lead Breakdown Slides PDF. The topics addressed in these templates are Lead Current Month, Website Users, Top Social Media Channels. All the content presented in this PPT design is completely editable. Download it and make adjustments in color, background, font etc. as per your unique business setting.
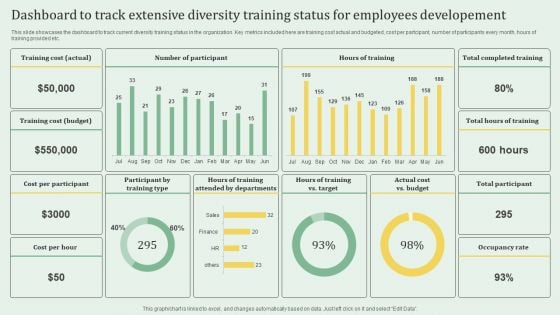
Dashboard To Track Extensive Diversity Training Status For Employees Developement Elements PDF
This slide showcases the dashboard to track current diversity training status in the organization. Key metrics included here are training cost actual and budgeted, cost per partcipant, number of participants every month, hours of training provided etc. Showcasing this set of slides titled Dashboard To Track Extensive Diversity Training Status For Employees Developement Elements PDF. The topics addressed in these templates are Training Cost, Budget, Occupancy Rate. All the content presented in this PPT design is completely editable. Download it and make adjustments in color, background, font etc. as per your unique business setting.
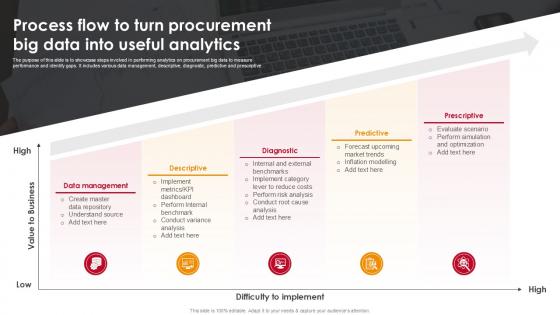
Process Flow To Turn Procurement Big Data Into Useful Analytics
Do you have an important presentation coming up Are you looking for something that will make your presentation stand out from the rest Look no further than Process Flow To Turn Procurement Big Data Into Useful Analytics. With our professional designs, you can trust that your presentation will pop and make delivering it a smooth process. And with Slidegeeks, you can trust that your presentation will be unique and memorable. So why wait Grab Process Flow To Turn Procurement Big Data Into Useful Analytics today and make your presentation stand out from the rest This slide showcases steps for analyzing procurement big data to assess performance and identify gaps. It represents data management and various analytics types, including descriptive, diagnostic, predictive, and prescriptive, to drive informed decision-making and improvements.
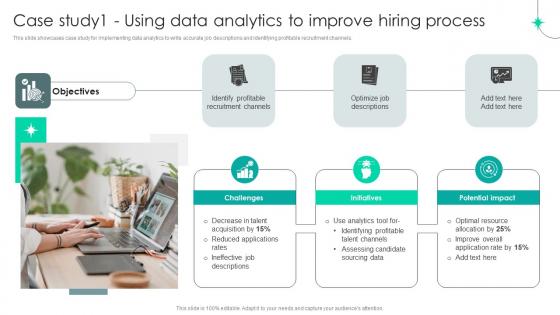
Strategic Staffing Using Data Case Study1 Using Data Analytics To Improve Hiring CRP DK SS V
This slide showcases case study for implementing data analytics to write accurate job descriptions and identifying profitable recruitment channels. Find highly impressive Strategic Staffing Using Data Case Study1 Using Data Analytics To Improve Hiring CRP DK SS V on Slidegeeks to deliver a meaningful presentation. You can save an ample amount of time using these presentation templates. No need to worry to prepare everything from scratch because Slidegeeks experts have already done a huge research and work for you. You need to download Strategic Staffing Using Data Case Study1 Using Data Analytics To Improve Hiring CRP DK SS V for your upcoming presentation. All the presentation templates are 100 percent editable and you can change the color and personalize the content accordingly. Download now This slide showcases case study for implementing data analytics to write accurate job descriptions and identifying profitable recruitment channels.
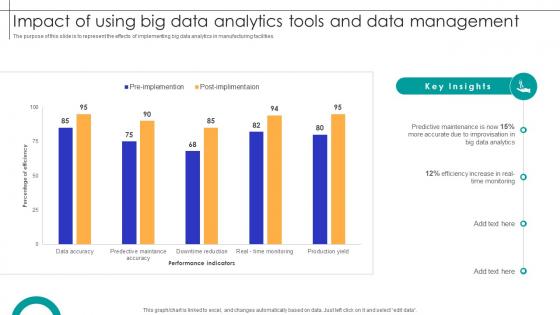
Impact Of Using Big Data Analytics Tools And Data Management Streamlining Production Ppt Example
The purpose of this slide is to represent the effects of implementing big data analytics in manufacturing facilities. Here you can discover an assortment of the finest PowerPoint and Google Slides templates. With these templates, you can create presentations for a variety of purposes while simultaneously providing your audience with an eye-catching visual experience. Download Impact Of Using Big Data Analytics Tools And Data Management Streamlining Production Ppt Example to deliver an impeccable presentation. These templates will make your job of preparing presentations much quicker, yet still, maintain a high level of quality. Slidegeeks has experienced researchers who prepare these templates and write high-quality content for you. Later on, you can personalize the content by editing the Impact Of Using Big Data Analytics Tools And Data Management Streamlining Production Ppt Example The purpose of this slide is to represent the effects of implementing big data analytics in manufacturing facilities.
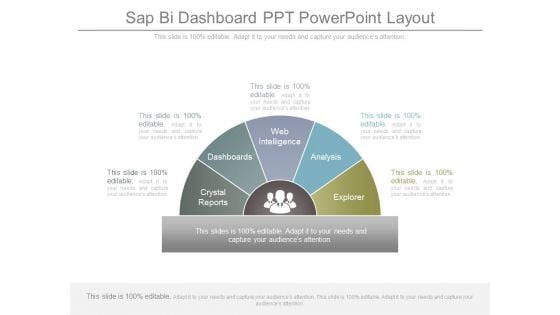
Sap Bi Dashboard Ppt Powerpoint Layout
This is a sap bi dashboard ppt powerpoint layout. This is a five stage process. The stages in this process are crystal reports, dashboards, web intelligence, analysis, explorer.
Acquisition Dashboard Ppt PowerPoint Presentation Portfolio Demonstration
This is a acquisition dashboard ppt powerpoint presentation portfolio demonstration. This is a five stage process. The stages in this process are acquisition dashboard.
Analytical Dashboarding Ppt Powerpoint Presentation Slides Cpb
This is a analytical dashboarding ppt powerpoint presentation slides cpb. This is a five stage process. The stages in this process are analytical dashboarding.
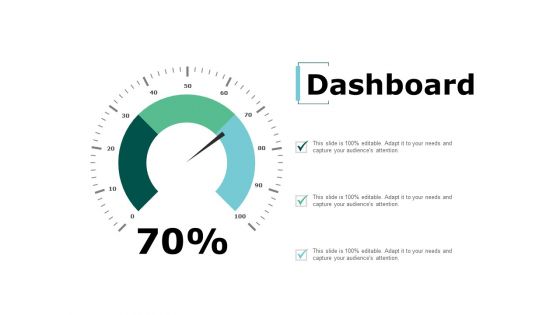
Dashboard Management Ppt Powerpoint Presentation Inspiration Model
This is a dashboard management ppt powerpoint presentation inspiration model. This is a three stage process. The stages in this process are dashboard, marketing, management, analysis, strategy.
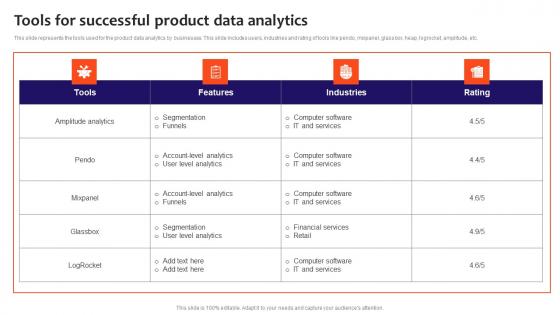
Tools For Successful Product Data Analytics Infographics Pdf
This slide represents the tools used for the product data analytics by businesses. This slide includes users, industries and rating of tools like pendo, mixpanel, glassbox, heap, logrocket, amplitude, etc. Showcasing this set of slides titled Tools For Successful Product Data Analytics Infographics Pdf. The topics addressed in these templates are Funnels, IT And Services, Financial Services. All the content presented in this PPT design is completely editable. Download it and make adjustments in color, background, font etc. as per your unique business setting. This slide represents the tools used for the product data analytics by businesses. This slide includes users, industries and rating of tools like pendo, mixpanel, glassbox, heap, logrocket, amplitude, etc.

Data Scientist Predictive Analytics In Powerpoint And Google Slides Cpb
Presenting our innovatively designed set of slides titled Data Scientist Predictive Analytics In Powerpoint And Google Slides Cpb. This completely editable PowerPoint graphic exhibits Data Scientist Predictive Analytics that will help you convey the message impactfully. It can be accessed with Google Slides and is available in both standard screen and widescreen aspect ratios. Apart from this, you can download this well structured PowerPoint template design in different formats like PDF, JPG, and PNG. So, click the download button now to gain full access to this PPT design. Our Data Scientist Predictive Analytics In Powerpoint And Google Slides Cpb are topically designed to provide an attractive backdrop to any subject. Use them to look like a presentation pro.
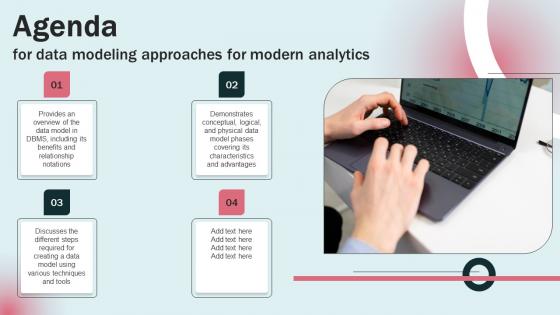
Agenda For Data Modeling Approaches For Modern Analytics Download Pdf
Boost your pitch with our creative Agenda For Data Modeling Approaches For Modern Analytics Download Pdf. Deliver an awe inspiring pitch that will mesmerize everyone. Using these presentation templates you will surely catch everyones attention. You can browse the ppts collection on our website. We have researchers who are experts at creating the right content for the templates. So you do not have to invest time in any additional work. Just grab the template now and use them. Our Agenda For Data Modeling Approaches For Modern Analytics Download Pdf are topically designed to provide an attractive backdrop to any subject. Use them to look like a presentation pro.


 Continue with Email

 Home
Home


