Snapshot
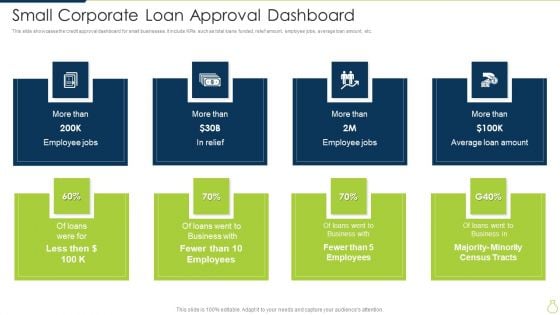
Small Corporate Loan Approval Dashboard Diagrams PDF
This slide showcases the credit approval dashboard for small businesses. It include KPIs such as total loans funded, relief amount, employee jobs, average loan amount, etc. Persuade your audience using this Small Corporate Loan Approval Dashboard Diagrams PDF. This PPT design covers eight stages, thus making it a great tool to use. It also caters to a variety of topics including Business, Loans, Census Tracts. Download this PPT design now to present a convincing pitch that not only emphasizes the topic but also showcases your presentation skills.
Key Financial Ratios Template 2 Ppt PowerPoint Presentation Icon Slide Download
This is a key financial ratios template 2 ppt powerpoint presentation icon slide download. This is a six stage process. The stages in this process are price to earnings, debt to equity ratio, current ratio, return on, equity, return on , assets, return on investment.
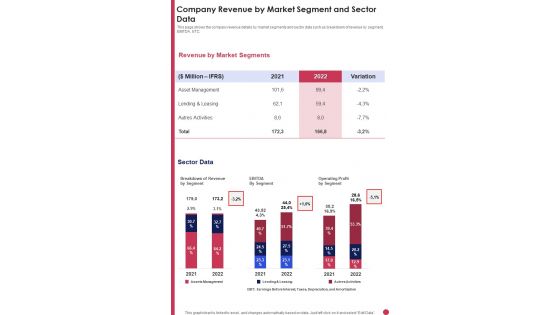
Company Revenue By Market Segment And Sector Data Template 281 One Pager Documents
This page shows the company revenue details by market segments and sector data such as breakdown of revenue by segment, EBITDA, ETC. Presenting you a fantastic Company Revenue By Market Segment And Sector Data Template 281 One Pager Documents. This piece is crafted on hours of research and professional design efforts to ensure you have the best resource. It is completely editable and its design allow you to rehash its elements to suit your needs. Get this Company Revenue By Market Segment And Sector Data Template 281 One Pager Documents A4 One-pager now.
Companies Branding Analysis Ppt Sample
This is a companies branding analysis ppt sample. This is a five stage process. The stages in this process are growth, loyalty, success, sales, customer.
Tracking Goals Alignment KPI Dashboard Guidelines PDF
This slide showcases a tracking dashboard for determining the alignment and progress percentage of the assigned objectives. It also includes the objective evaluation KPIs such as active objectives, overall progress, total employees, objective as per employees, aligned, organizational and departmental objectives. Pitch your topic with ease and precision using this Tracking Goals Alignment KPI Dashboard Guidelines PDF. This layout presents information on Employee, Organizational Objectives, Departmental Objectives. It is also available for immediate download and adjustment. So, changes can be made in the color, design, graphics or any other component to create a unique layout.

PIM Software Solution Report Dashboard Mockup PDF
This slide covers the dashboard with active product information and performance report. It also includes product KPIs such as active products, missing products, items sold by category, and top 5 products. Pitch your topic with ease and precision using this PIM Software Solution Report Dashboard Mockup PDF. This layout presents information on Product Information, Product Performance, Missing Product Details. It is also available for immediate download and adjustment. So, changes can be made in the color, design, graphics or any other component to create a unique layout.
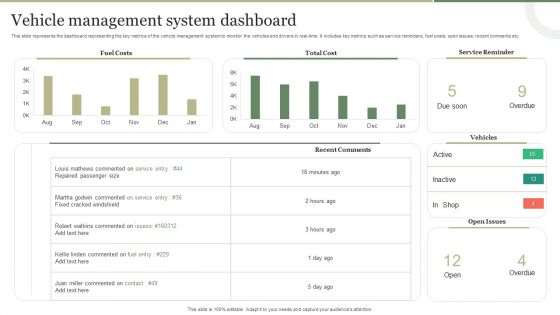
Vehicle Management System Dashboard Graphics PDF
This slide represents the dashboard to help fleet managers to monitor the vehicles and the drivers in real-time. It represents KPIs such as vehicle status, service reminders, open issues, inspections summary, service costs etc. Pitch your topic with ease and precision using this Vehicle Management System Dashboard Graphics PDF. This layout presents information on Vehicle Management System, Representing Maintenance Status. It is also available for immediate download and adjustment. So, changes can be made in the color, design, graphics or any other component to create a unique layout.
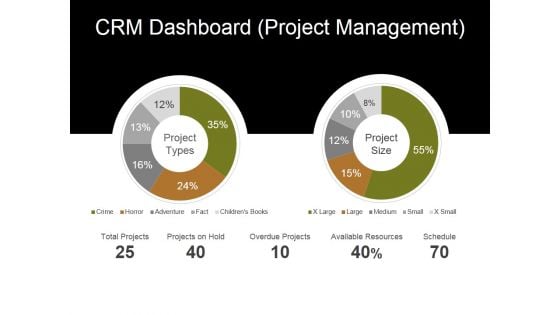
Crm Dashboard Project Management Ppt PowerPoint Presentation Layouts Ideas
This is a crm dashboard project management ppt powerpoint presentation layouts ideas. This is a two stage process. The stages in this process are total projects, projects on hold, overdue projects, available resources, schedule.
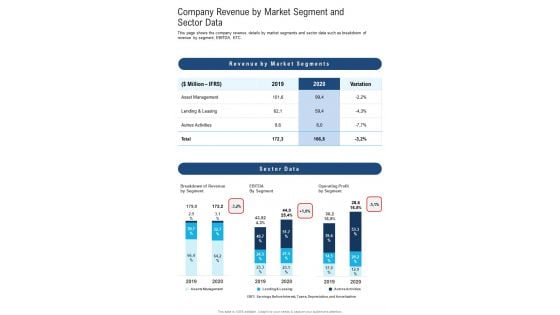
Company Revenue By Market Segment And Sector Data One Pager Documents
Presenting you an exemplary Company Revenue By Market Segment And Sector Data One Pager Documents. Our one-pager comprises all the must-have essentials of an inclusive document. You can edit it with ease, as its layout is completely editable. With such freedom, you can tweak its design and other elements to your requirements. Download this Company Revenue By Market Segment And Sector Data One Pager Documents brilliant piece now.
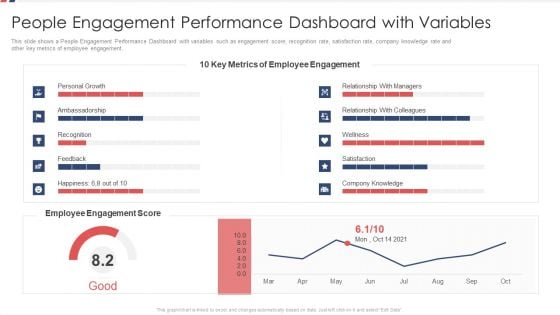
People Engagement Performance Dashboard With Variables Ppt Gallery Example File PDF
This slide shows a People Engagement Performance Dashboard with variables such as engagement score, recognition rate, satisfaction rate, company knowledge rate and other key metrics of employee engagement. Deliver and pitch your topic in the best possible manner with this people engagement performance dashboard with variables ppt gallery example file pdf. Use them to share invaluable insights on personal growth, employee engagement score, employee engagement metrics and impress your audience. This template can be altered and modified as per your expectations. So, grab it now.
Consumer Journey Mapping Techniques Dashboard For Tracking Social Media Platforms Introduction PDF
This slide covers the KPI dashboard for analyzing social media channels. It includes metrics such as social media followers, Facebook daily reach, Facebook engaged users and page impressions, etc. Pitch your topic with ease and precision using this Consumer Journey Mapping Techniques Dashboard For Tracking Social Media Platforms Introduction PDF. This layout presents information on Linkedin Key Metrics, Social Media Followers, Awareness. It is also available for immediate download and adjustment. So, changes can be made in the color, design, graphics or any other component to create a unique layout.
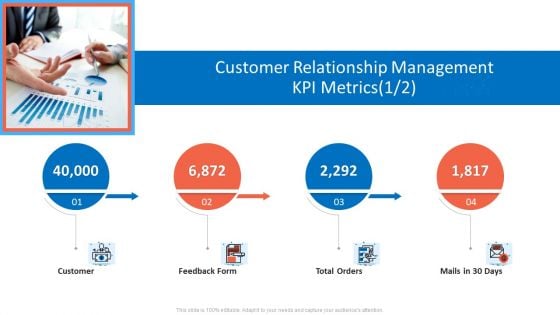
Customer Relationship Management Dashboard Customer Relationship Management KPI Metrics Form Elements PDF
Presenting customer relationship management dashboard customer relationship management kpi metrics form elements pdf to provide visual cues and insights. Share and navigate important information on four stages that need your due attention. This template can be used to pitch topics like customer, feedback form, total orders, mails in 30 days. In addtion, this PPT design contains high resolution images, graphics, etc, that are easily editable and available for immediate download.
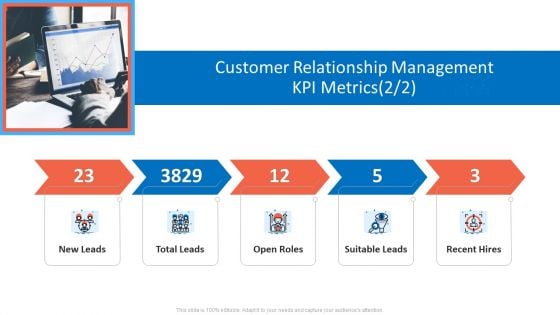
Customer Relationship Management Dashboard Customer Relationship Management KPI Metrics Open Ideas PDF
This is a customer relationship management dashboard customer relationship management kpi metrics open ideas pdf template with various stages. Focus and dispense information on five stages using this creative set, that comes with editable features. It contains large content boxes to add your information on topics like new leads, total leads, open roles, suitable leads, recent hires. You can also showcase facts, figures, and other relevant content using this PPT layout. Grab it now.
Business Dashboard Icon With Decline Formats PDF
Presenting Business Dashboard Icon With Decline Formats PDF to dispense important information. This template comprises three stages. It also presents valuable insights into the topics including Business Dashboard Icon, Decline. This is a completely customizable PowerPoint theme that can be put to use immediately. So, download it and address the topic impactfully.
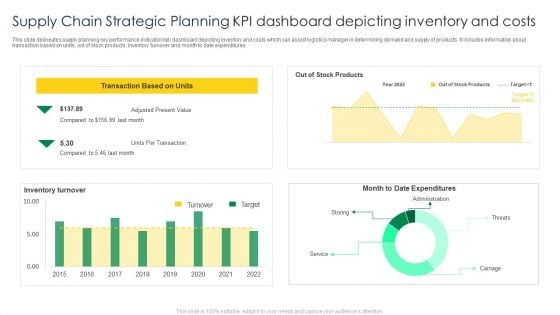
Supply Chain Strategic Planning KPI Dashboard Depicting Inventory And Costs Template PDF
This slide delineates supply planning key performance indicator kpi dashboard depicting inventory and costs which can assist logistics manager in determining demand and supply of products. It includes information about transaction based on units, out of stock products, inventory turnover and month to date expenditures. Showcasing this set of slides titled Supply Chain Strategic Planning KPI Dashboard Depicting Inventory And Costs Template PDF. The topics addressed in these templates are Transaction Based Units, 2016 To 2022. All the content presented in this PPT design is completely editable. Download it and make adjustments in color, background, font etc. as per your unique business setting.
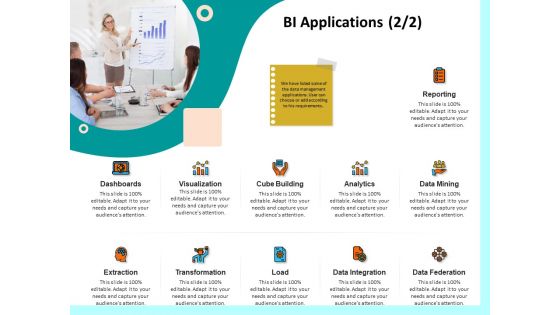
Firm Productivity Administration BI Applications Reporting Ppt PowerPoint Presentation Outline Example Introduction PDF
Presenting this set of slides with name firm productivity administration bi applications reporting ppt powerpoint presentation outline example introduction pdf. This is a eleven stage process. The stages in this process are reporting, dashboards, visualization, cube building, analytics, data mining, extraction, transformation load, data integration, data federation. This is a completely editable PowerPoint presentation and is available for immediate download. Download now and impress your audience.
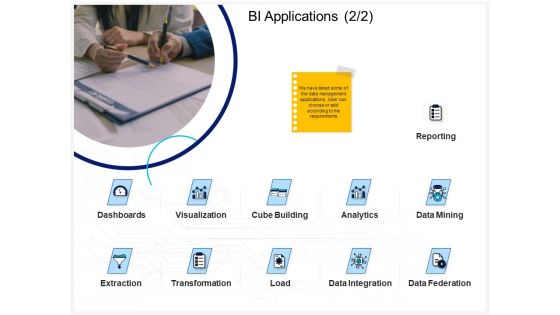
Enterprise Problem Solving And Intellect BI Applications Reporting Ppt PowerPoint Presentation Styles Summary PDF
Presenting this set of slides with name enterprise problem solving and intellect bi applications reporting ppt powerpoint presentation styles summary pdf. This is a ten stage process. The stages in this process are reporting, dashboards, visualization, cube building, analytics, data mining, extraction, transformation load, data integration, data federation. This is a completely editable PowerPoint presentation and is available for immediate download. Download now and impress your audience.
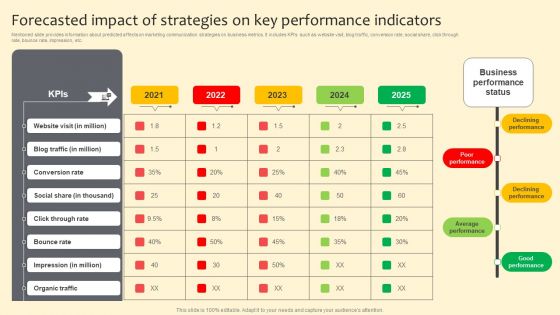
Forecasted Impact Of Strategies On Key Performance Indicators Slides PDF
Mentioned slide provides information about predicted affects on marketing communication strategies on business metrics. It includes KPIs such as website visit, blog traffic, conversion rate, social share, click through rate, bounce rate, impression, etc. Boost your pitch with our creative Forecasted Impact Of Strategies On Key Performance Indicators Slides PDF. Deliver an awe inspiring pitch that will mesmerize everyone. Using these presentation templates you will surely catch everyones attention. You can browse the ppts collection on our website. We have researchers who are experts at creating the right content for the templates. So you do not have to invest time in any additional work. Just grab the template now and use them.

Summary Financial Accounting Statement Profit And Loss Analysis Dashboard Elements PDF
This graph or chart is linked to excel, and changes automatically based on data. Just left click on it and select Edit Data. Deliver an awe inspiring pitch with this creative Summary Financial Accounting Statement Profit And Loss Analysis Dashboard Elements PDF bundle. Topics like P And L Structure Dynamics, Dupont Rations, Debt Coverage Ratios, Creditworthiness Assessment can be discussed with this completely editable template. It is available for immediate download depending on the needs and requirements of the user.
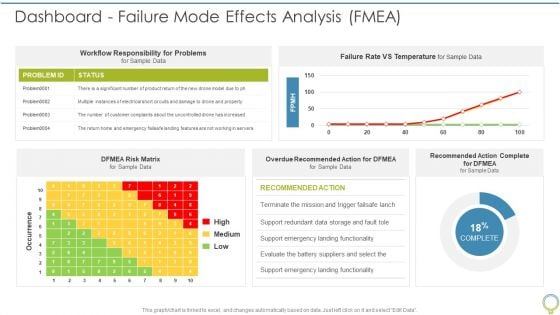
FMEA To Determine Potential Dashboard Failure Mode Effects Analysis FMEA Brochure PDF
This graph or chart is linked to excel, and changes automatically based on data. Just left click on it and select Edit Data. Deliver an awe inspiring pitch with this creative FMEA To Determine Potential Dashboard Failure Mode Effects Analysis FMEA Brochure PDF bundle. Topics like Workflow Responsibility, High Medium, Recommended Action can be discussed with this completely editable template. It is available for immediate download depending on the needs and requirements of the user.
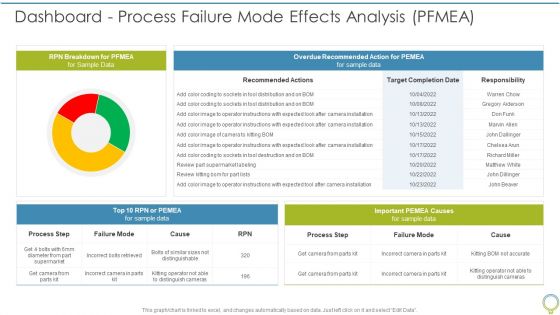
FMEA To Determine Potential Dashboard Process Failure Mode Effects Analysis PFMEA Elements PDF
This graph or chart is linked to excel, and changes automatically based on data. Just left click on it and select Edit Data. Deliver and pitch your topic in the best possible manner with this FMEA To Determine Potential Dashboard Process Failure Mode Effects Analysis PFMEA Elements PDF. Use them to share invaluable insights on RPN Breakdown, Overdue Recommended, Process Step and impress your audience. This template can be altered and modified as per your expectations. So, grab it now.
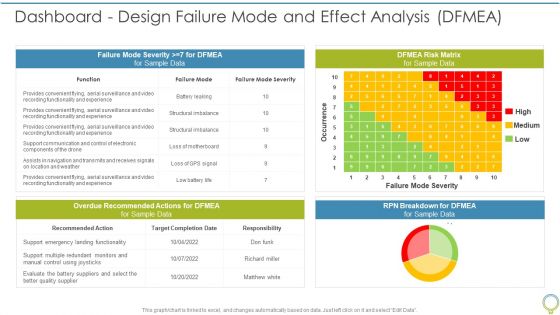
FMEA To Determine Potential Dashboard Design Failure Mode And Effect Analysis DFMEA Ppt Show Styles PDF
This graph or chart is linked to excel, and changes automatically based on data. Just left click on it and select Edit Data. Deliver an awe inspiring pitch with this creative FMEA To Determine Potential Dashboard Design Failure Mode And Effect Analysis DFMEA Ppt Show Styles PDF bundle. Topics like Target Completion, Recommended Action, RPN Breakdown can be discussed with this completely editable template. It is available for immediate download depending on the needs and requirements of the user.
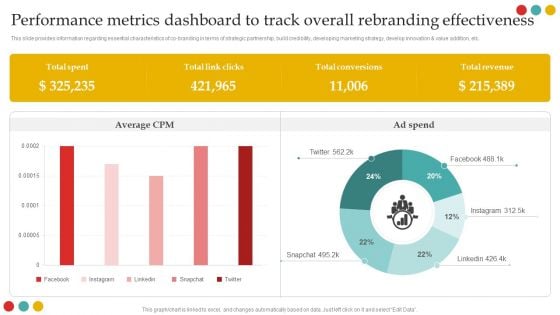
Successful Rebranding Guide Performance Metrics Dashboard To Track Overall Rebranding Effectiveness Guidelines PDF
This slide provides information regarding essential characteristics of co-branding in terms of strategic partnership, build credibility, developing marketing strategy, develop innovation value addition, etc.Want to ace your presentation in front of a live audience Our Successful Rebranding Guide Performance Metrics Dashboard To Track Overall Rebranding Effectiveness Guidelines PDF can help you do that by engaging all the users towards you. Slidegeeks experts have put their efforts and expertise into creating these impeccable powerpoint presentations so that you can communicate your ideas clearly. Moreover, all the templates are customizable, and easy-to-edit and downloadable. Use these for both personal and commercial use.
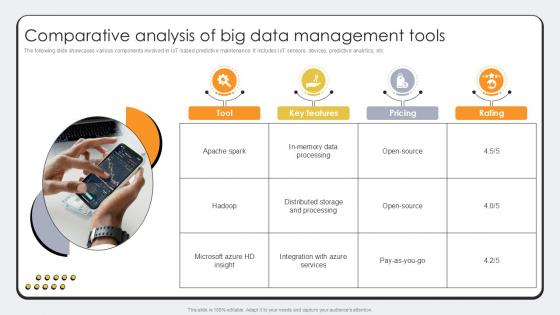
Comparative Analysis Of Big Data Revolutionizing Production IoT Ppt Slide
The following slide showcases various components involved in IoT-based predictive maintenance. It includes IoT sensors, devices, predictive analytics, etc. Slidegeeks is here to make your presentations a breeze with Comparative Analysis Of Big Data Revolutionizing Production IoT Ppt Slide With our easy-to-use and customizable templates, you can focus on delivering your ideas rather than worrying about formatting. With a variety of designs to choose from, you are sure to find one that suits your needs. And with animations and unique photos, illustrations, and fonts, you can make your presentation pop. So whether you are giving a sales pitch or presenting to the board, make sure to check out Slidegeeks first The following slide showcases various components involved in IoT-based predictive maintenance. It includes IoT sensors, devices, predictive analytics, etc.
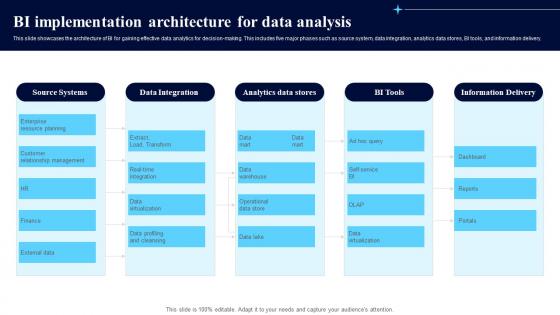
BI Implementation Architecture For Data Analysis Slides Pdf
This slide showcases the architecture of BI for gaining effective data analytics for decision-making. This includes five major phases such as source system, data integration, analytics data stores, BI tools, and information delivery. Showcasing this set of slides titled BI Implementation Architecture For Data Analysis Slides Pdf. The topics addressed in these templates are Source Systems, Data Integration, Analytics Data Stores. All the content presented in this PPT design is completely editable. Download it and make adjustments in color, background, font etc. as per your unique business setting. This slide showcases the architecture of BI for gaining effective data analytics for decision-making. This includes five major phases such as source system, data integration, analytics data stores, BI tools, and information delivery.
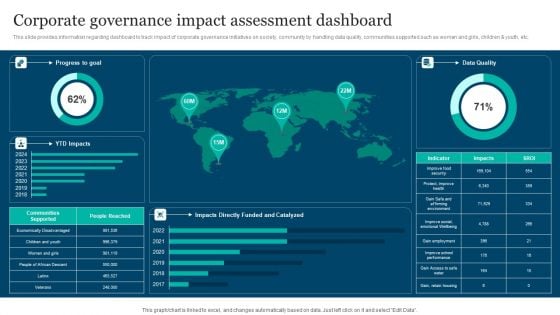
Responsible Technology Playbook Corporate Governance Impact Assessment Dashboard Slides PDF
This slide provides information regarding dashboard to track impact of corporate governance initiatives on society, community by handling data quality, communities supported such as women and girls, children and youth, etc. The best PPT templates are a great way to save time, energy, and resources. Slidegeeks have 100 percent editable powerpoint slides making them incredibly versatile. With these quality presentation templates, you can create a captivating and memorable presentation by combining visually appealing slides and effectively communicating your message. Download Responsible Technology Playbook Corporate Governance Impact Assessment Dashboard Slides PDF from Slidegeeks and deliver a wonderful presentation.
Financial Services Advisory Business Plan Insurance Agency Activities Tracking Dashboard Introduction PDF
This slide provides glimpse about insurance agency activities tracking dashboard which help management in monitoring activities. Deliver an awe inspiring pitch with this creative Financial Services Advisory Business Plan Insurance Agency Activities Tracking Dashboard Introduction PDF bundle. Topics like Claim Reviews, Claim Renewals, Activities, Vehicle Insurance, Scheduled Reports can be discussed with this completely editable template. It is available for immediate download depending on the needs and requirements of the user.
Constructing Insurance Company Strategic Business Approach Insurance Agency Activities Tracking Dashboard Template PDF
This slide provides glimpse about insurance agency activities tracking dashboard which help management in monitoring activities. Deliver an awe inspiring pitch with this creative Constructing Insurance Company Strategic Business Approach Insurance Agency Activities Tracking Dashboard Template PDF bundle. Topics like Pending Activities, Scheduled Reports, Latest Customers can be discussed with this completely editable template. It is available for immediate download depending on the needs and requirements of the user.

Table Of Prescriptive Model Deployment Timeline Data Analytics SS V
This slide provides a deployment table of prescriptive model aimed at highlighting movement of models through various phases. The basis of deployment are stage, start and end date, manager name with resources utilized.The Table Of Prescriptive Model Deployment Timeline Data Analytics SS V is a compilation of the most recent design trends as a series of slides. It is suitable for any subject or industry presentation, containing attractive visuals and photo spots for businesses to clearly express their messages. This template contains a variety of slides for the user to input data, such as structures to contrast two elements, bullet points, and slides for written information. Slidegeeks is prepared to create an impression. This slide provides a deployment table of prescriptive model aimed at highlighting movement of models through various phases. The basis of deployment are stage, start and end date, manager name with resources utilized.
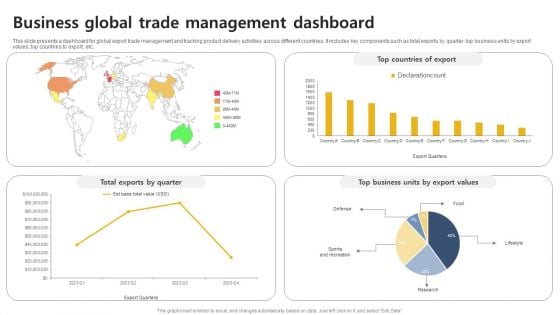
Business Global Trade Management Dashboard Inspiration PDF
This slide presents a dashboard for global export trade management and tracking product delivery activities across different countries. It includes key components such as total exports by quarter, top business units by export values, top countries to export, etc. Showcasing this set of slides titled Business Global Trade Management Dashboard Inspiration PDF. The topics addressed in these templates are Business Global Trade, Management Dashboard. All the content presented in this PPT design is completely editable. Download it and make adjustments in color, background, font etc. as per your unique business setting.
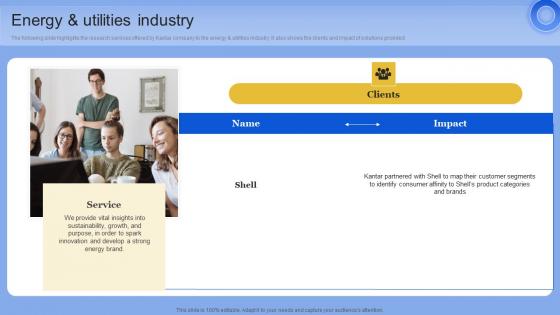
Energy And Utilities Industry Data Analytics Company Outline Slides PDF
The following slide highlights the research services offered by Kantar company to the energy and utilities industry. It also shows the clients and impact of solutions provided. Slidegeeks is here to make your presentations a breeze with Energy And Utilities Industry Data Analytics Company Outline Slides PDF With our easy-to-use and customizable templates, you can focus on delivering your ideas rather than worrying about formatting. With a variety of designs to choose from, you are sure to find one that suits your needs. And with animations and unique photos, illustrations, and fonts, you can make your presentation pop. So whether you are giving a sales pitch or presenting to the board, make sure to check out Slidegeeks first The following slide highlights the research services offered by Kantar company to the energy and utilities industry. It also shows the clients and impact of solutions provided

Dashboard To Measure Performance Of Social Media Retail Business Growth Marketing Techniques Ideas PDF
This following slide displays the key metrics that can help an organization to measure effectiveness of social media strategies. These can be leads generated, leads by region, web traffic targets etc If you are looking for a format to display your unique thoughts, then the professionally designed Dashboard To Measure Performance Of Social Media Retail Business Growth Marketing Techniques Ideas PDF is the one for you. You can use it as a Google Slides template or a PowerPoint template. Incorporate impressive visuals, symbols, images, and other charts. Modify or reorganize the text boxes as you desire. Experiment with shade schemes and font pairings. Alter, share or cooperate with other people on your work. Download Dashboard To Measure Performance Of Social Media Retail Business Growth Marketing Techniques Ideas PDF and find out how to give a successful presentation. Present a perfect display to your team and make your presentation unforgettable.
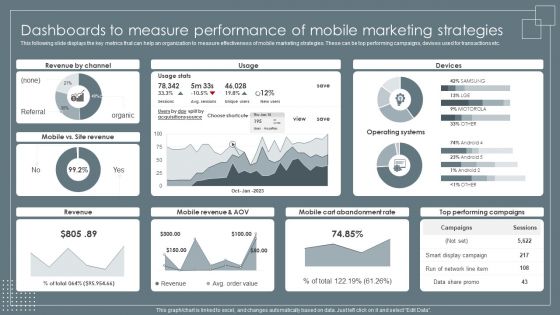
Dashboards To Measure Performance Of Mobile Retail Business Growth Marketing Techniques Professional PDF
This following slide displays the key metrics that can help an organization to measure effectiveness of mobile marketing strategies. These can be top performing campaigns, devises used for transactions etc. Crafting an eye catching presentation has never been more straightforward. Let your presentation shine with this tasteful yet straightforward Dashboards To Measure Performance Of Mobile Retail Business Growth Marketing Techniques Professional PDF template. It offers a minimalistic and classy look that is great for making a statement. The colors have been employed intelligently to add a bit of playfulness while still remaining professional. Construct the ideal Dashboards To Measure Performance Of Mobile Retail Business Growth Marketing Techniques Professional PDF that effortlessly grabs the attention of your audience. Begin now and be certain to wow your customers.
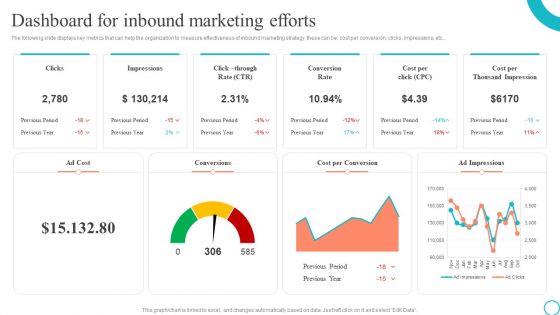
Dashboard For Inbound Marketing Efforts Marketing Tactics To Enhance Business Graphics PDF
The following slide displays key metrics that can help the organization to measure effectiveness of inbound marketing strategy, these can be cost per conversion, clicks, impressions, etc. If you are looking for a format to display your unique thoughts, then the professionally designed Dashboard For Inbound Marketing Efforts Marketing Tactics To Enhance Business Graphics PDF is the one for you. You can use it as a Google Slides template or a PowerPoint template. Incorporate impressive visuals, symbols, images, and other charts. Modify or reorganize the text boxes as you desire. Experiment with shade schemes and font pairings. Alter, share or cooperate with other people on your work. Download Dashboard For Inbound Marketing Efforts Marketing Tactics To Enhance Business Graphics PDF and find out how to give a successful presentation. Present a perfect display to your team and make your presentation unforgettable.
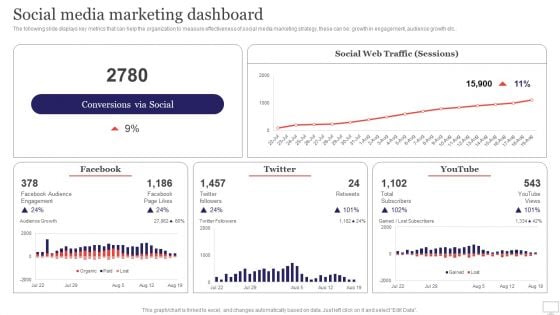
Target Audience Strategy For B2B And B2C Business Social Media Marketing Dashboard Designs PDF
The following slide displays key metrics that can help the organization to measure effectiveness of social media marketing strategy, these can be growth in engagement, audience growth etc.. Do you have an important presentation coming up Are you looking for something that will make your presentation stand out from the rest Look no further than Target Audience Strategy For B2B And B2C Business Social Media Marketing Dashboard Designs PDF. With our professional designs, you can trust that your presentation will pop and make delivering it a smooth process. And with Slidegeeks, you can trust that your presentation will be unique and memorable. So why wait Grab Target Audience Strategy For B2B And B2C Business Social Media Marketing Dashboard Designs PDF today and make your presentation stand out from the rest
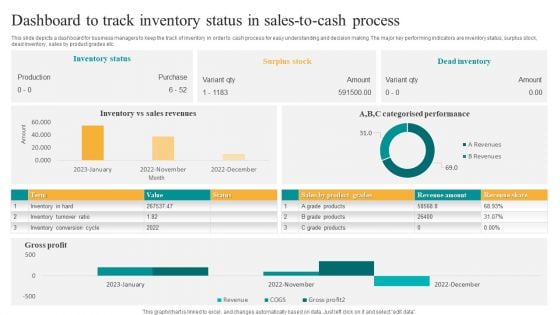
Dashboard To Track Inventory Status In Sales To Cash Process Themes PDF
This slide depicts a dashboard for business managers to keep the track of inventory in order to cash process for easy understanding and decision making. The major key performing indicators are inventory status, surplus stock, dead inventory, sales by product grades etc. Showcasing this set of slides titled Dashboard To Track Inventory Status In Sales To Cash Process Themes PDF. The topics addressed in these templates are Inventory Status, Surplus Stock, Dead Inventory. All the content presented in this PPT design is completely editable. Download it and make adjustments in color, background, font etc. as per your unique business setting.

Identify The Change Ppt PowerPoint Presentation Slides Pictures
This is a identify the change ppt powerpoint presentation slides pictures. This is a five stage process. The stages in this process are forces for change, vision for change, gap analysis, organization change readiness.

KPIS Affected Post Recruitment Technology Cloud Recruiting Technologies PPT Example
This slide showcases key performance indicators impacted after utilization of recruitment technology. It provides details about candidate quality, turnover rate, turnover cost, average hiring time, absences, hiring time, staff growth rate, etc. This modern and well-arranged KPIS Affected Post Recruitment Technology Cloud Recruiting Technologies PPT Example provides lots of creative possibilities. It is very simple to customize and edit with the Powerpoint Software. Just drag and drop your pictures into the shapes. All facets of this template can be edited with Powerpoint, no extra software is necessary. Add your own material, put your images in the places assigned for them, adjust the colors, and then you can show your slides to the world, with an animated slide included. This slide showcases key performance indicators impacted after utilization of recruitment technology. It provides details about candidate quality, turnover rate, turnover cost, average hiring time, absences, hiring time, staff growth rate, etc.

KPIS Affected Post Recruitment Technology Utilization PPT Example
This slide showcases key performance indicators impacted after utilization of recruitment technology. It provides details about candidate quality, turnover rate, turnover cost, average hiring time, absences, hiring time, staff growth rate, etc. This modern and well-arranged KPIS Affected Post Recruitment Technology Utilization PPT Example provides lots of creative possibilities. It is very simple to customize and edit with the Powerpoint Software. Just drag and drop your pictures into the shapes. All facets of this template can be edited with Powerpoint, no extra software is necessary. Add your own material, put your images in the places assigned for them, adjust the colors, and then you can show your slides to the world, with an animated slide included. This slide showcases key performance indicators impacted after utilization of recruitment technology. It provides details about candidate quality, turnover rate, turnover cost, average hiring time, absences, hiring time, staff growth rate, etc.

Tips To Improve Data Reporting Procedure Structure PDF
This slide mentions the steps involved in improving financial reporting systems in organizations. It includes normalizing data, organizing information, single sourcing data, collaboration and reviewing. Persuade your audience using this Tips To Improve Data Reporting Procedure Structure PDF. This PPT design covers five stages, thus making it a great tool to use. It also caters to a variety of topics including Organize Information, Single Source Data, Collaboration. Download this PPT design now to present a convincing pitch that not only emphasizes the topic but also showcases your presentation skills.
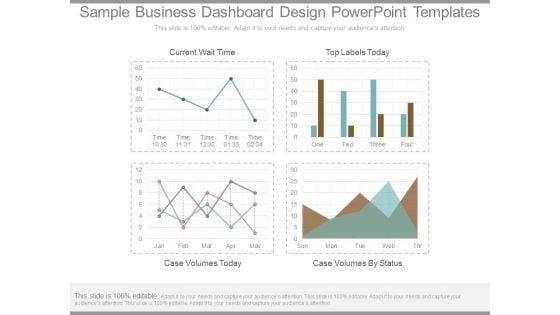
Sample Business Dashboard Design Powerpoint Templates
This is a sample business dashboard design powerpoint templates. This is a four stage process. The stages in this process are current wait time, top labels today, case volumes today, case volumes by status.
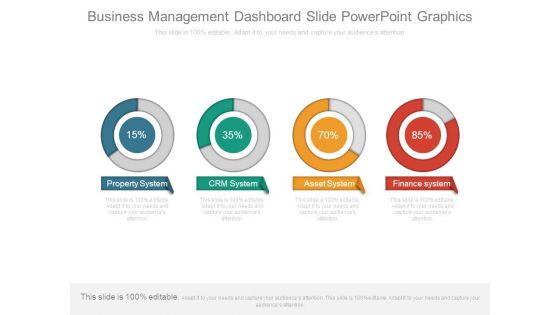
Business Management Dashboard Slide Powerpoint Graphics
This is a business management dashboard slide powerpoint graphics. This is a four stage process. The stages in this process are property system, crm system, asset system, finance system.
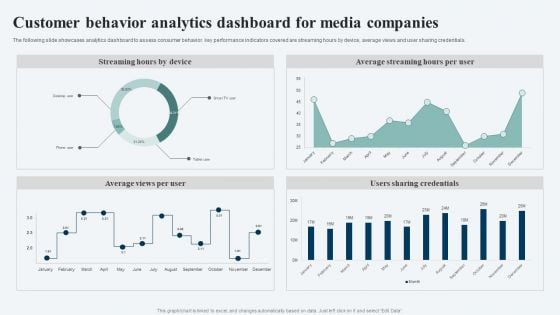
Customer Behavior Analytics Dashboard For Media Companies Ppt Ideas Visuals PDF
The following slide showcases analytics dashboard to assess consumer behavior. key performance indicators covered are streaming hours by device, average views and user sharing credentials. Showcasing this set of slides titled Customer Behavior Analytics Dashboard For Media Companies Ppt Ideas Visuals PDF. The topics addressed in these templates are Streaming Hours Device, Average Streaming Hours, Per User, Users Sharing Credentials. All the content presented in this PPT design is completely editable. Download it and make adjustments in color, background, font etc. as per your unique business setting.

HR KPI Dashboard With Staff Payroll Details Ppt PowerPoint Presentation File Layout Ideas PDF
This slide represents the key performance indicator dashboard with salary details of employee working in an organisation. It includes turnover rate, pie chart of employment contract and status, bar graph based on employee gender. Showcasing this set of slides titled HR KPI Dashboard With Staff Payroll Details Ppt PowerPoint Presentation File Layout Ideas PDF. The topics addressed in these templates are Turnover Rate, Absenteeism Rate, Permanent Rate. All the content presented in this PPT design is completely editable. Download it and make adjustments in color, background, font etc. as per your unique business setting.
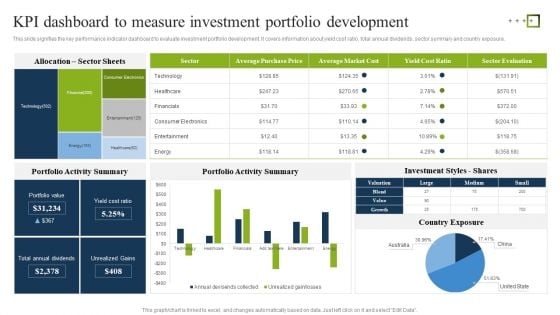
KPI Dashboard To Measure Investment Portfolio Development Ppt Inspiration Gallery PDF
This slide signifies the key performance indicator dashboard to evaluate investment portfolio development. It covers information about yield cost ratio, total annual dividends, sector summary and country exposure. Showcasing this set of slides titled KPI Dashboard To Measure Investment Portfolio Development Ppt Inspiration Gallery PDF. The topics addressed in these templates are Portfolio Activity Summary, Investment Styles Shares, Country Exposure. All the content presented in this PPT design is completely editable. Download it and make adjustments in color, background, font etc. as per your unique business setting.
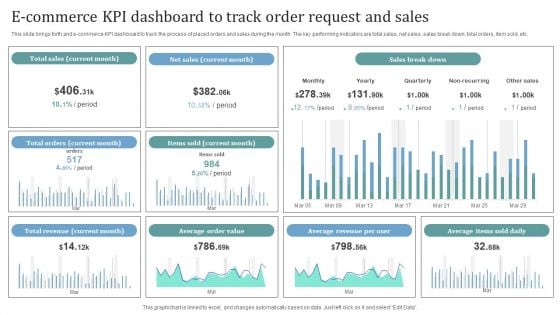
E Commerce KPI Dashboard To Track Order Request And Sales Introduction PDF
This slide brings forth and e commerce KPI dashboard to track the process of placed orders and sales during the month. The key performing indicators are total sales, net sales, sales break down, total orders, item sold, etc. Showcasing this set of slides titled E Commerce KPI Dashboard To Track Order Request And Sales Introduction PDF. The topics addressed in these templates are Total Sales, Net Sales, Sales Break Down. All the content presented in this PPT design is completely editable. Download it and make adjustments in color, background, font etc. as per your unique business setting.
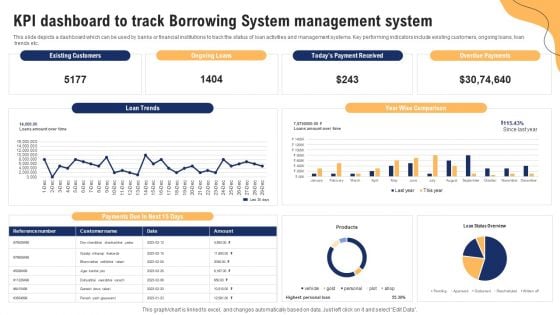
KPI Dashboard To Track Borrowing System Management System Ppt Visual Aids Portfolio PDF
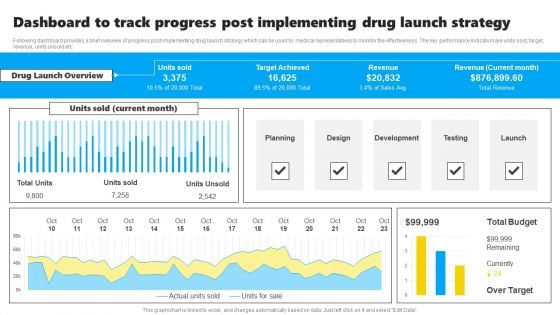
Dashboard To Track Progress Post Implementing Drug Launch Strategy Slides PDF
Following dashboard provides a brief overview of progress post implementing drug launch strategy which can be used by medical representatives to monitor the effectiveness. The key performance indicators are units sold, target, revenue, units unsold etc. Showcasing this set of slides titled Dashboard To Track Progress Post Implementing Drug Launch Strategy Slides PDF. The topics addressed in these templates are Planning, Design, Development, Testing, Launch. All the content presented in this PPT design is completely editable. Download it and make adjustments in color, background, font etc. as per your unique business setting.
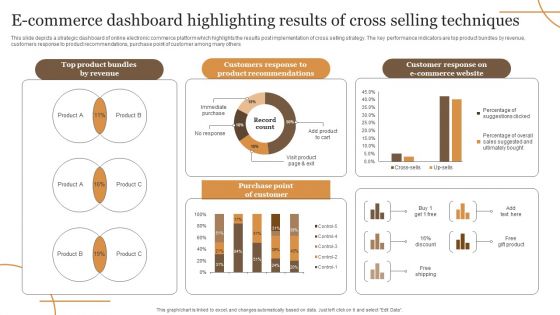
E Commerce Dashboard Highlighting Results Of Cross Selling Techniques Elements PDF
This slide depicts a strategic dashboard of online electronic commerce platform which highlights the results post implementation of cross selling strategy. The key performance indicators are top product bundles by revenue, customers response to product recommendations, purchase point of customer among many others. Showcasing this set of slides titled E Commerce Dashboard Highlighting Results Of Cross Selling Techniques Elements PDF. The topics addressed in these templates are Revenue, E Commerce Website, Purchase. All the content presented in this PPT design is completely editable. Download it and make adjustments in color, background, font etc. as per your unique business setting.
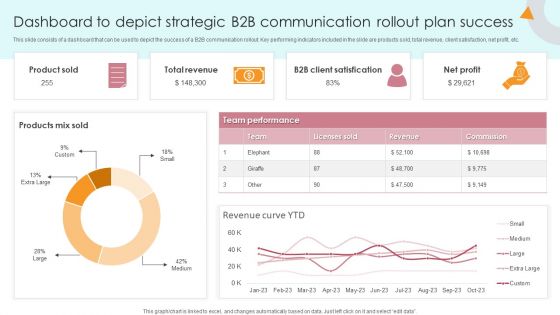
Dashboard To Depict Strategic B2B Communication Rollout Plan Success Portrait PDF
This slide consists of a dashboard that can be used to depict the success of a B2B communication rollout. Key performing indicators included in the slide are products sold, total revenue, client satisfaction, net profit, etc. Showcasing this set of slides titled Dashboard To Depict Strategic B2B Communication Rollout Plan Success Portrait PDF. The topics addressed in these templates are Product Sold, Total Revenue, B2b Client Satisfication. All the content presented in this PPT design is completely editable. Download it and make adjustments in color, background, font etc. as per your unique business setting.
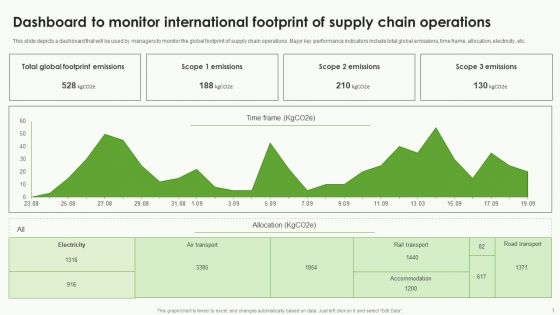
Dashboard To Monitor International Footprint Of Supply Chain Operations Brochure PDF
This slide depicts a dashboard that will be used by managers to monitor the global footprint of supply chain operations. Major key performance indicators include total global emissions, time frame, allocation, electricity, etc. Showcasing this set of slides titled Dashboard To Monitor International Footprint Of Supply Chain Operations Brochure PDF. The topics addressed in these templates are Electricity, Footprint Emissions, Allocation. All the content presented in this PPT design is completely editable. Download it and make adjustments in color, background, font etc. as per your unique business setting.
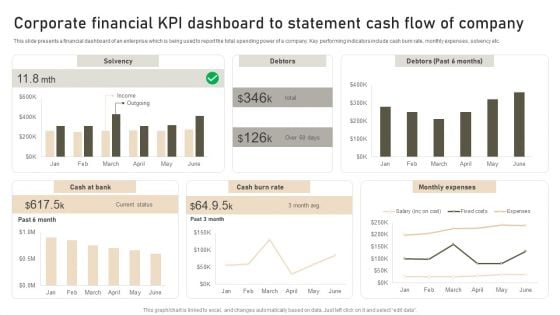
Corporate Financial KPI Dashboard To Statement Cash Flow Of Company Diagrams PDF
This slide presents a financial dashboard of an enterprise which is being used to report the total spending power of a company. Key performing indicators include cash burn rate, monthly expenses, solvency etc. Showcasing this set of slides titled Corporate Financial KPI Dashboard To Statement Cash Flow Of Company Diagrams PDF. The topics addressed in these templates are Solvency, Debtors, Monthly Expenses. All the content presented in this PPT design is completely editable. Download it and make adjustments in color, background, font etc. as per your unique business setting.
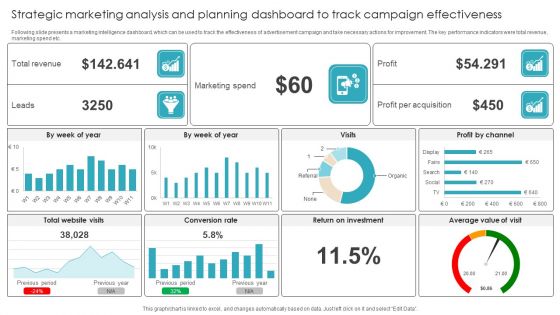
Strategic Marketing Analysis And Planning Dashboard To Track Campaign Effectiveness Summary PDF
Following slide presents a marketing intelligence dashboard, which can be used to track the effectiveness of advertisement campaign and take necessary actions for improvement. The key performance indicators were total revenue, marketing spend etc. Showcasing this set of slides titled Strategic Marketing Analysis And Planning Dashboard To Track Campaign Effectiveness Summary PDF. The topics addressed in these templates are Marketing Spend, Conversion Rate, Return Investment. All the content presented in this PPT design is completely editable. Download it and make adjustments in color, background, font etc. as per your unique business setting.
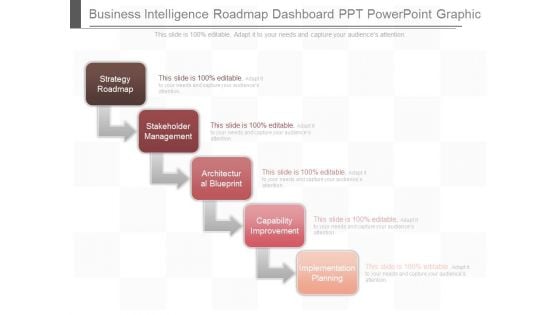
Business Intelligence Roadmap Dashboard Ppt Powerpoint Graphic
This is a business intelligence roadmap dashboard ppt powerpoint graphic. This is a five stage process. The stages in this process are strategy roadmap, stakeholder management, architectural blueprint, capability improvement, implementation planning.
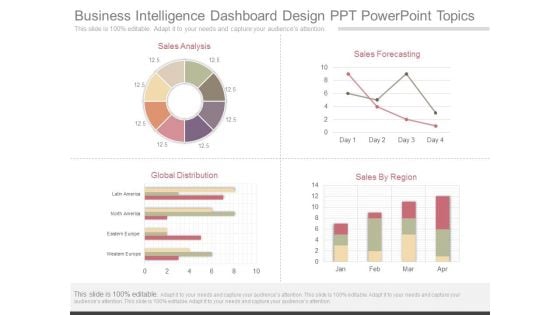
Business Intelligence Dashboard Design Ppt Powerpoint Topics
This is a business intelligence dashboard design ppt powerpoint topics. This is a four stage process. The stages in this process are sales analysis, sales forecasting, global distribution, sales by region, latin america, north america, eastern europe, western europe.
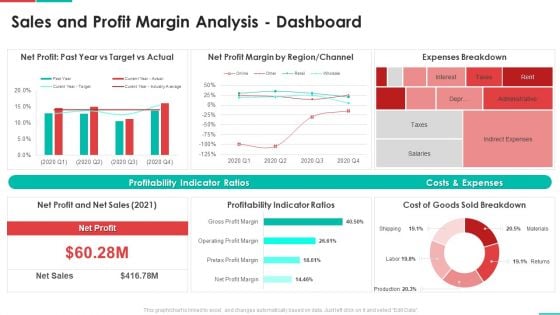
Roadmap For Financial Accounting Transformation Sales And Profit Margin Analysis Dashboard Pictures PDF
Deliver an awe inspiring pitch with this creative roadmap for financial accounting transformation sales and profit margin analysis dashboard pictures pdf bundle. Topics like profitability indicator ratios, costs and expenses, expenses breakdown can be discussed with this completely editable template. It is available for immediate download depending on the needs and requirements of the user.

Dashboard To Track Essential Activities Associated With IT Department Pictures PDF
This slide provides information regarding dashboard to monitor critical activities related to IT in terms of incident tracker, outage report, IT spend per employee, application trends, etc. Are you in need of a template that can accommodate all of your creative concepts This one is crafted professionally and can be altered to fit any style. Use it with Google Slides or PowerPoint. Include striking photographs, symbols, depictions, and other visuals. Fill, move around, or remove text boxes as desired. Test out color palettes and font mixtures. Edit and save your work, or work with colleagues. Download Dashboard To Track Essential Activities Associated With IT Department Pictures PDF and observe how to make your presentation outstanding. Give an impeccable presentation to your group and make your presentation unforgettable.
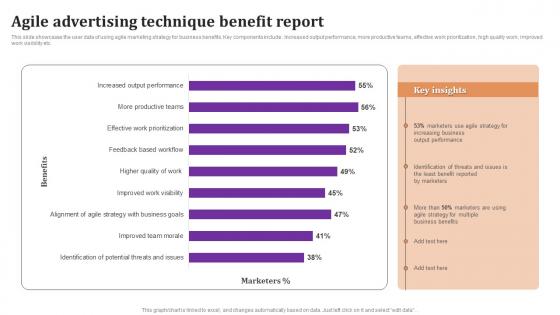
Agile Advertising Technique Benefit Report Professional Pdf
This slide showcases the user data of using agile marketing strategy for business benefits. Key components include Increased output performance, more productive teams, effective work prioritization, high quality work, improved work visibility etc. Showcasing this set of slides titled Agile Advertising Technique Benefit Report Professional Pdf The topics addressed in these templates are Agile Advertising Technique, Benefit Report All the content presented in this PPT design is completely editable. Download it and make adjustments in color, background, font etc. as per your unique business setting. This slide showcases the user data of using agile marketing strategy for business benefits. Key components include Increased output performance, more productive teams, effective work prioritization, high quality work, improved work visibility etc.
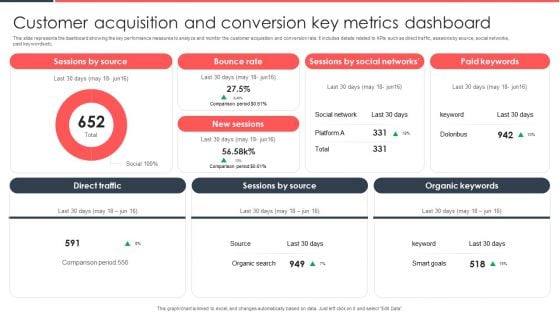
Implementing Management System To Enhance Ecommerce Processes Customer Acquisition And Conversion Key Metrics Pictures PDF
This slide represents the dashboard showing the key performance measures to analyze and monitor the customer acquisition and conversion rate. It includes details related to KPIs such as direct traffic, sessions by source, social networks, paid keywords etc. Presenting this PowerPoint presentation, titled Implementing Management System To Enhance Ecommerce Processes Customer Acquisition And Conversion Key Metrics Pictures PDF, with topics curated by our researchers after extensive research. This editable presentation is available for immediate download and provides attractive features when used. Download now and captivate your audience. Presenting this Implementing Management System To Enhance Ecommerce Processes Customer Acquisition And Conversion Key Metrics Pictures PDF. Our researchers have carefully researched and created these slides with all aspects taken into consideration. This is a completely customizable Implementing Management System To Enhance Ecommerce Processes Customer Acquisition And Conversion Key Metrics Pictures PDF that is available for immediate downloading. Download now and make an impact on your audience. Highlight the attractive features available with our PPTs.
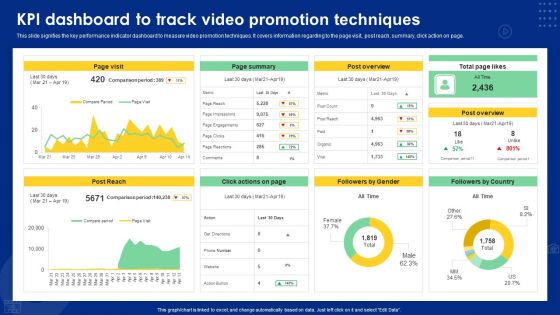
Kpi Dashboard To Track Video Promotion Techniques Ppt Summary Guide PDF
This slide signifies the key performance indicator dashboard to measure video promotion techniques. It covers information regarding to the page visit, post reach, summary, click action on page. Pitch your topic with ease and precision using this Kpi Dashboard To Track Video Promotion Techniques Ppt Summary Guide PDF. This layout presents information on Page Visit, Page Summary, Post Overview. It is also available for immediate download and adjustment. So, changes can be made in the color, design, graphics or any other component to create a unique layout.


 Continue with Email

 Home
Home


