Snapshot
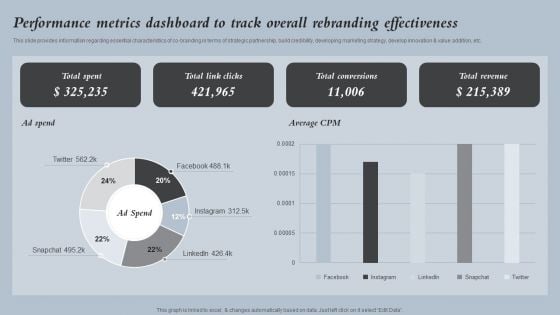
Performance Metrics Dashboard To Track Overall Strategies For Rebranding Without Losing Ideas PDF
This slide provides information regarding essential characteristics of co branding in terms of strategic partnership, build credibility, developing marketing strategy, develop innovation and value addition, etc. Whether you have daily or monthly meetings, a brilliant presentation is necessary. Performance Metrics Dashboard To Track Overall Strategies For Rebranding Without Losing Ideas PDF can be your best option for delivering a presentation. Represent everything in detail using Performance Metrics Dashboard To Track Overall Strategies For Rebranding Without Losing Ideas PDF and make yourself stand out in meetings. The template is versatile and follows a structure that will cater to your requirements. All the templates prepared by Slidegeeks are easy to download and edit. Our research experts have taken care of the corporate themes as well. So, give it a try and see the results.
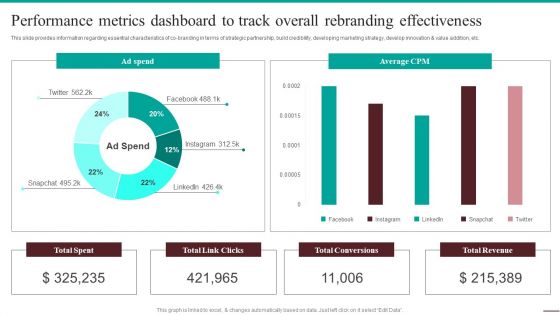
Guide For Systematic Performance Metrics Dashboard To Track Overall Rebranding Background PDF
This slide provides information regarding essential characteristics of co-branding in terms of strategic partnership, build credibility, developing marketing strategy, develop innovation and value addition, etc. Formulating a presentation can take up a lot of effort and time, so the content and message should always be the primary focus. The visuals of the PowerPoint can enhance the presenters message, so our Guide For Systematic Performance Metrics Dashboard To Track Overall Rebranding Background PDF was created to help save time. Instead of worrying about the design, the presenter can concentrate on the message while our designers work on creating the ideal templates for whatever situation is needed. Slidegeeks has experts for everything from amazing designs to valuable content, we have put everything into Guide For Systematic Performance Metrics Dashboard To Track Overall Rebranding Background PDF.
Marketing Success Metrics KPI Dashboard For Tracking Seo Analytics Background PDF
This slide covers the KPI dashboard for analyzing SEO metrics such as authority score, organic traffic, organic keywords, paid keywords, ref. Domains, site audit, link-building tool, organic traffic, on-page SEO checker, backlink audit, etc. This Marketing Success Metrics KPI Dashboard For Tracking Seo Analytics Background PDF from Slidegeeks makes it easy to present information on your topic with precision. It provides customization options, so you can make changes to the colors, design, graphics, or any other component to create a unique layout. It is also available for immediate download, so you can begin using it right away. Slidegeeks has done good research to ensure that you have everything you need to make your presentation stand out. Make a name out there for a brilliant performance.
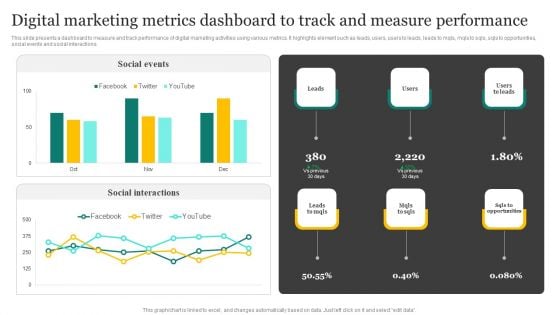
Strategic Promotion Plan Development Stages Digital Marketing Metrics Dashboard To Track Structure PDF
This slide presents a dashboard to measure and track performance of digital marketing activities using various metrics. It highlights element such as leads, users, users to leads, leads to mqls, mqls to sqls, sqls to opportunities, social events and social interactions. Are you in need of a template that can accommodate all of your creative concepts This one is crafted professionally and can be altered to fit any style. Use it with Google Slides or PowerPoint. Include striking photographs, symbols, depictions, and other visuals. Fill, move around, or remove text boxes as desired. Test out color palettes and font mixtures. Edit and save your work, or work with colleagues. Download Strategic Promotion Plan Development Stages Digital Marketing Metrics Dashboard To Track Structure PDF and observe how to make your presentation outstanding. Give an impeccable presentation to your group and make your presentation unforgettable.
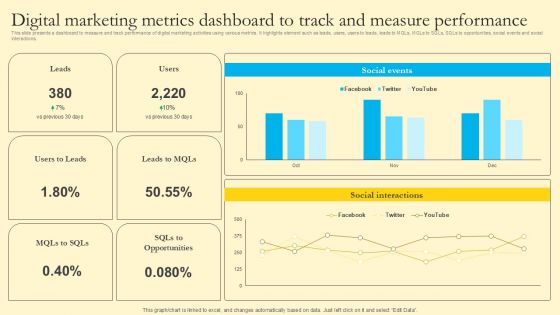
Comprehensive Guide For Sales And Advertising Processes Digital Marketing Metrics Dashboard To Track Measure Clipart PDF
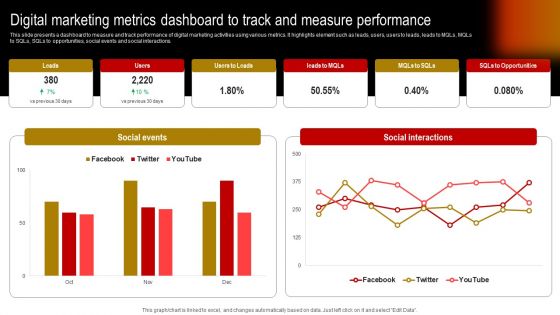
Digital Marketing Metrics Dashboard To Track And Measure Performance Graphics PDF
This slide presents a dashboard to measure and track performance of digital marketing activities using various metrics. It highlights element such as leads, users, users to leads, leads to MQLs, MQLs to SQLs, SQLs to opportunities, social events and social interactions. Want to ace your presentation in front of a live audience Our Digital Marketing Metrics Dashboard To Track And Measure Performance Graphics PDF can help you do that by engaging all the users towards you. Slidegeeks experts have put their efforts and expertise into creating these impeccable powerpoint presentations so that you can communicate your ideas clearly. Moreover, all the templates are customizable, and easy to edit and downloadable. Use these for both personal and commercial use.
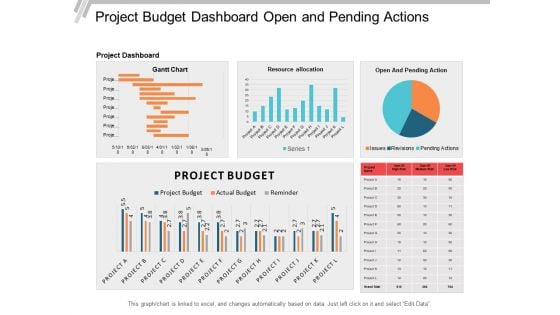
Project Budget Dashboard Open And Pending Actions Ppt PowerPoint Presentation File Templates
This is a project budget dashboard open and pending actions ppt powerpoint presentation file templates. This is a three stage process. The stages in this process are business analytics, ba, organizations data.
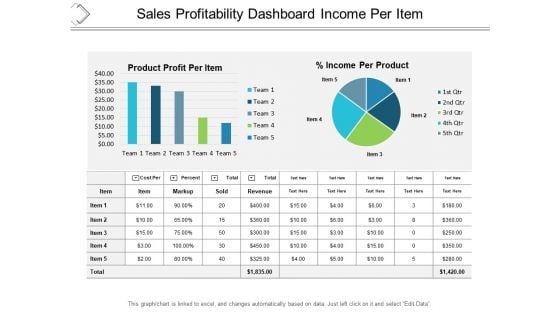
Sales Profitability Dashboard Income Per Item Ppt PowerPoint Presentation Professional Graphic Images
This is a sales profitability dashboard income per item ppt powerpoint presentation professional graphic images. This is a five stage process. The stages in this process are business analytics, ba, organizations data.
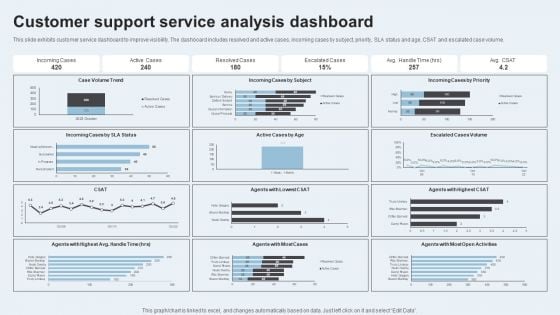
Action Plan To Enhance Client Service Customer Support Service Analysis Dashboard Graphics PDF
This slide exhibits customer service dashboard to improve visibility. The dashboard includes resolved and active cases, incoming cases by subject, priority, SLA status and age, CSAT and escalated case volume. The Action Plan To Enhance Client Service Customer Support Service Analysis Dashboard Graphics PDF is a compilation of the most recent design trends as a series of slides. It is suitable for any subject or industry presentation, containing attractive visuals and photo spots for businesses to clearly express their messages. This template contains a variety of slides for the user to input data, such as structures to contrast two elements, bullet points, and slides for written information. Slidegeeks is prepared to create an impression.
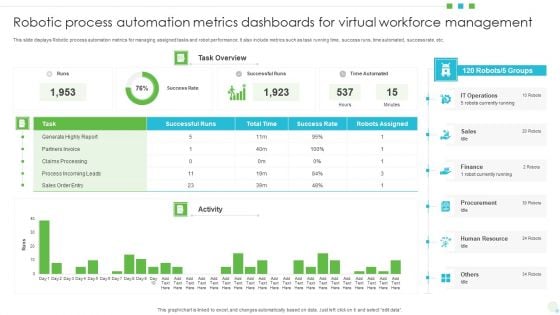
Robotic Process Automation Metrics Dashboards For Virtual Workforce Management Background PDF
This slide displays Robotic process automation metrics for managing assigned tasks and robot performance. It also include metrics such as task running time, success runs, time automated, success rate, etc. Showcasing this set of slides titled Robotic Process Automation Metrics Dashboards For Virtual Workforce Management Background PDF. The topics addressed in these templates are Finance, Sales, Human Resource. All the content presented in this PPT design is completely editable. Download it and make adjustments in color, background, font etc. as per your unique business setting.
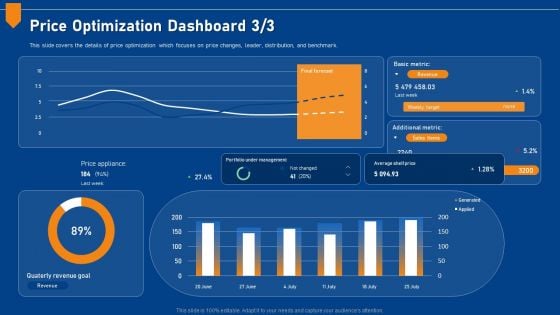
Evaluating Price Efficiency In Organization Price Optimization Dashboard Metric Designs PDF
This slide covers the details of price optimization which focuses on price changes, leader, distribution, and benchmark. Deliver and pitch your topic in the best possible manner with this evaluating price efficiency in organization price optimization dashboard metric designs pdf. Use them to share invaluable insights on portfolio, management, price, revenue, target and impress your audience. This template can be altered and modified as per your expectations. So, grab it now.
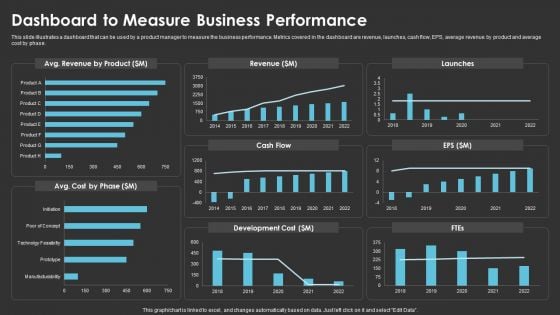
Method To Introduce New Product Offerings In The Industry Dashboard To Measure Business Performance Pictures PDF
This slide illustrates a dashboard that can be used by a product manager to measure the business performance. Metrics covered in the dashboard are revenue, launches, cash flow, EPS, average revenue by product and average cost by phase. Deliver and pitch your topic in the best possible manner with this Method To Introduce New Product Offerings In The Industry Dashboard To Measure Business Performance Pictures PDF. Use them to share invaluable insights on Revenue, Cash Flow, Development Cost and impress your audience. This template can be altered and modified as per your expectations. So, grab it now.
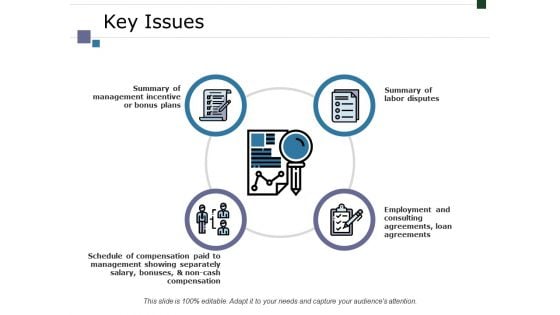
Key Issues Ppt PowerPoint Presentation Infographic Template Example 2015
This is a key issues ppt powerpoint presentation infographic template example 2015. This is a four stage process. The stages in this process are business, summary of management incentive or bonus plans, summary of labor disputes, employment and consulting agreements, loan agreements, management.
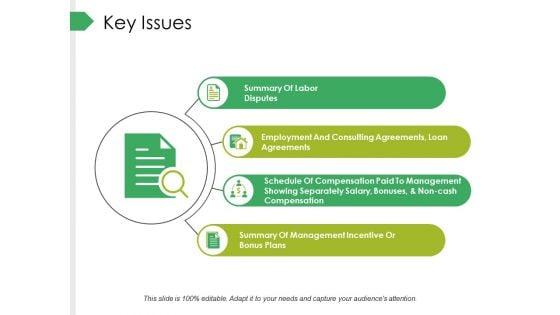
Key Issues Ppt PowerPoint Presentation Professional Design Inspiration
This is a key issues ppt powerpoint presentation professional design inspiration. This is a four stage process. The stages in this process are business, summary of labor disputes, summary of management incentive or bonus plans, employment and consulting agreements, loan agreements, marketing.
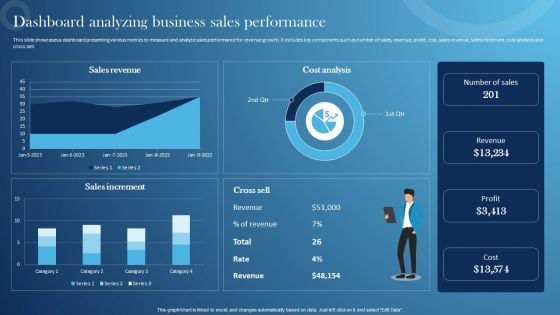
Inspecting Sales Optimization Areas Dashboard Analyzing Business Sales Performance Slides PDF
This slide showcases a dashboard presenting various metrics to measure and analyze sales performance for revenue growth. It includes key components such as number of sales, revenue, profit, cost, sales revenue, sales increment, cost analysis and cross sell. Create an editable Inspecting Sales Optimization Areas Dashboard Analyzing Business Sales Performance Slides PDF that communicates your idea and engages your audience. Whether youre presenting a business or an educational presentation, pre-designed presentation templates help save time. Inspecting Sales Optimization Areas Dashboard Analyzing Business Sales Performance Slides PDF is highly customizable and very easy to edit, covering many different styles from creative to business presentations. Slidegeeks has creative team members who have crafted amazing templates. So, go and get them without any delay.
4 Key Market Drivers Of Economic Growth Ppt PowerPoint Presentation Templates
This is a 4 key market drivers of economic growth ppt powerpoint presentation templates. This is a four stage process. The stages in this process are key market driver.
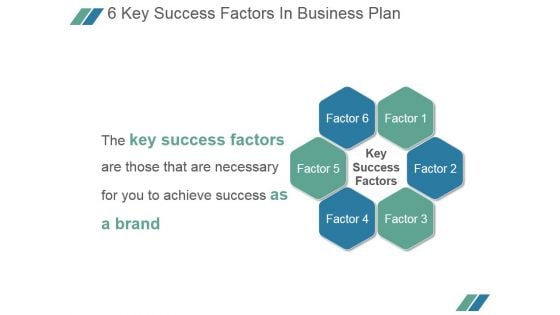
6 Key Success Factors In Business Plan Ppt PowerPoint Presentation Microsoft
This is a 6 key success factors in business plan ppt powerpoint presentation microsoft. This is a six stage process. The stages in this process are key success factors, factor.
KPI Dashboard For Tracking Commercial Banking And Financial Activities Download PDF
This slide depicts a dashboard for tracking the banking and financial activities of a business enterprise to measure the income and expenses. The key performing indicators are business accounts, paid, pending and cancelled transactions etc. Pitch your topic with ease and precision using this KPI Dashboard For Tracking Commercial Banking And Financial Activities Download PDF. This layout presents information on KPI Dashboard, Tracking Commercial Banking, Financial Activities. It is also available for immediate download and adjustment. So, changes can be made in the color, design, graphics or any other component to create a unique layout.

IT Security Risk Management Approach Introduction Risk Management KPI Dashboard With Loss Events Brochure PDF
Following slide illustrates a risk management KPI dashboard. KPIs covered are top ten risks, loss events, actions, key risk indicators and compliance. Deliver an awe inspiring pitch with this creative IT Security Risk Management Approach Introduction Risk Management KPI Dashboard With Loss Events Brochure PDF bundle. Topics like Key Risk Indicators, Risk Management can be discussed with this completely editable template. It is available for immediate download depending on the needs and requirements of the user.
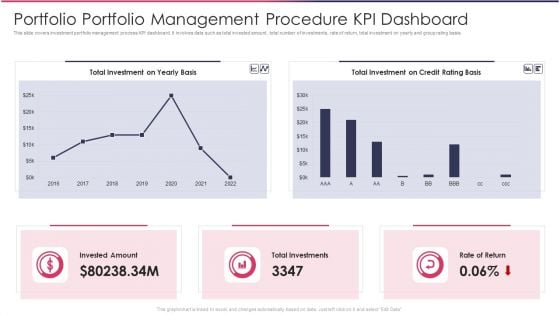
Portfolio Portfolio Management Procedure KPI Dashboard Demonstration PDF
This slide covers investment portfolio management process KPI dashboard. It involves data such as total invested amount, total number of investments, rate of return, total investment on yearly and group rating basis.Showcasing this set of slides titled Portfolio Portfolio Management Procedure KPI Dashboard Demonstration PDF The topics addressed in these templates are Total Investment, Credit Basis, Total Investments All the content presented in this PPT design is completely editable. Download it and make adjustments in color, background, font etc. as per your unique business setting.
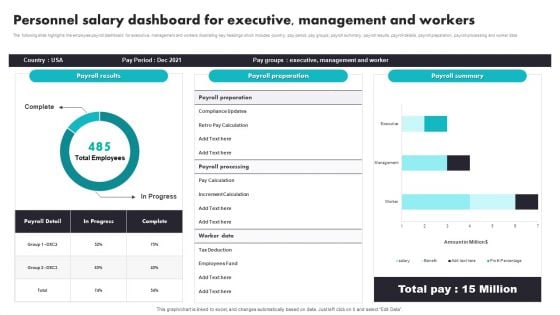
Personnel Salary Dashboard For Executive Management And Workers Rules PDF
The following slide highlights the employee payroll dashboard for executive, management and workers illustrating key headings which includes country, pay period, pay groups, payroll summary, payroll results, payroll details, payroll preparation, payroll processing and worker data. Showcasing this set of slides titled Personnel Salary Dashboard For Executive Management And Workers Rules PDF. The topics addressed in these templates are Management, Executive, Employees Fund. All the content presented in this PPT design is completely editable. Download it and make adjustments in color, background, font etc. as per your unique business setting.
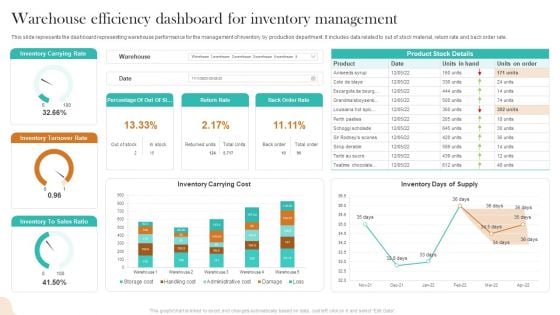
Warehouse Efficiency Dashboard For Inventory Management Infographics PDF
This slide represents the dashboard representing warehouse performance for the management of inventory by production department. It includes data related to out of stock material, return rate and back order rate. Showcasing this set of slides titled Warehouse Efficiency Dashboard For Inventory Management Infographics PDF. The topics addressed in these templates are Inventory Carrying Rate, Inventory Turnover Rate, Inventory Carrying Cost. All the content presented in this PPT design is completely editable. Download it and make adjustments in color, background, font etc. as per your unique business setting.
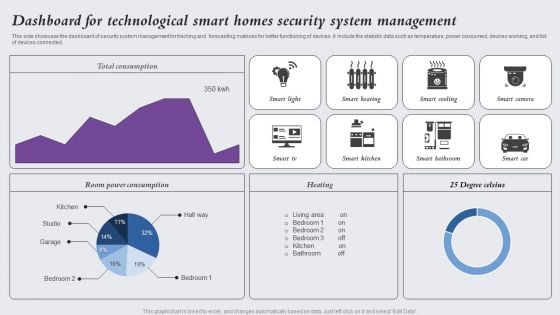
Dashboard For Technological Smart Homes Security System Management Designs PDF
This side showcase the dashboard of security system management for tracking and forecasting matrices for better functioning of devices. It include the statistic data such as temperature, power consumed, devices working, and list of devices connected. Showcasing this set of slides titled Dashboard For Technological Smart Homes Security System Management Designs PDF. The topics addressed in these templates are Smart Light, Smart Heating, Smart Cooling. All the content presented in this PPT design is completely editable. Download it and make adjustments in color, background, font etc. as per your unique business setting.
KPI Metrics Dashboard To Evaluate Facebook Video Campaign Performance Icons PDF
The following slide outlines a comprehensive KPI dashboard which can be used to analyze the performance of facebook video campaign. It provides information about page video views, page video views organic etc. Retrieve professionally designed KPI Metrics Dashboard To Evaluate Facebook Video Campaign Performance Icons PDF to effectively convey your message and captivate your listeners. Save time by selecting pre-made slideshows that are appropriate for various topics, from business to educational purposes. These themes come in many different styles, from creative to corporate, and all of them are easily adjustable and can be edited quickly. Access them as PowerPoint templates or as Google Slides themes. You do not have to go on a hunt for the perfect presentation because Slidegeeks got you covered from everywhere.
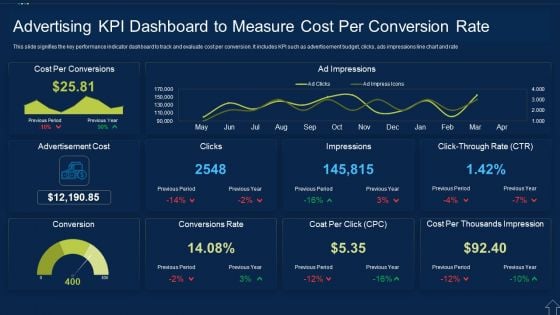
Advertising KPI Dashboard To Measure Cost Per Conversion Rate Themes PDF
This slide signifies the key performance indicator dashboard to track and evaluate cost per conversion. It includes KPI such as advertisement budget, clicks, ads impressions line chart and rate Showcasing this set of slides titled Advertising KPI Dashboard To Measure Cost Per Conversion Rate Themes PDF The topics addressed in these templates are Advertising Kpi Dashboard To Measure Cost Per Conversion Rate All the content presented in this PPT design is completely editable. Download it and make adjustments in color, background, font etc. as per your unique business setting.
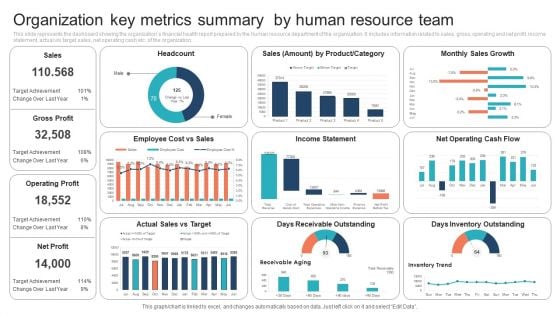
Organization Key Metrics Summary By Human Resource Team Information PDF
This slide represents the dashboard showing the organizations financial health report prepared by the human resource department of the organization. It includes information related to sales, gross, operating and net profit, income statement, actual vs target sales, net operating cash etc. of the organization.Showcasing this set of slides titled Organization Key Metrics Summary By Human Resource Team Information PDF. The topics addressed in these templates are Organization Key Metrics Summary, Human Resource Team. All the content presented in this PPT design is completely editable. Download it and make adjustments in color, background, font etc. as per your unique business setting.

Paid Advertising Techniques To Enhance Business Sales KPI Dashboard To Track Paid Social Media Microsoft PDF
This slide covers a dashboard that organizations can use to track the paid social media plan results. The template provides information about key metrics such as social media status, engaged users, page impressions, page likes, etc. Here you can discover an assortment of the finest PowerPoint and Google Slides templates. With these templates, you can create presentations for a variety of purposes while simultaneously providing your audience with an eye catching visual experience. Download Paid Advertising Techniques To Enhance Business Sales KPI Dashboard To Track Paid Social Media Microsoft PDF to deliver an impeccable presentation. These templates will make your job of preparing presentations much quicker, yet still, maintain a high level of quality. Slidegeeks has experienced researchers who prepare these templates and write high quality content for you. Later on, you can personalize the content by editing the Paid Advertising Techniques To Enhance Business Sales KPI Dashboard To Track Paid Social Media Microsoft PDF.
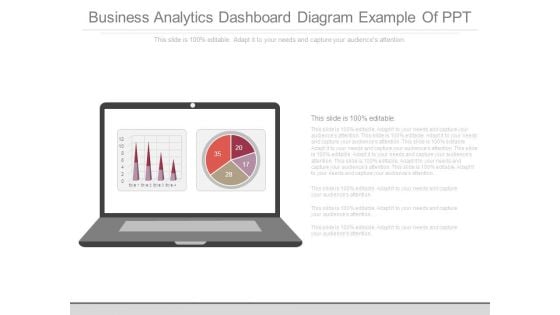
Business Analytics Dashboard Diagram Example Of Ppt
This is a business analytics dashboard diagram example of ppt. This is a one stage process. The stages in this process are business, management, strategy, pie, presentation.
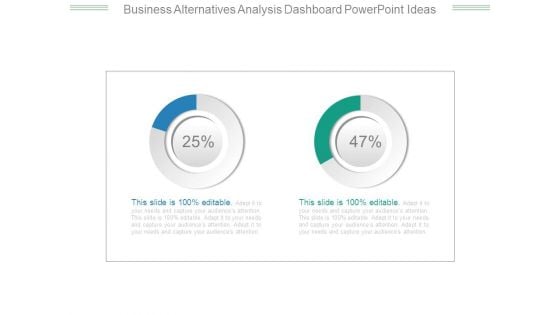
Business Alternatives Analysis Dashboard Powerpoint Ideas
This is a business alternatives analysis dashboard powerpoint ideas. This is a two stage process. The stages in this process are strategy, marketing, business, finance, donut.
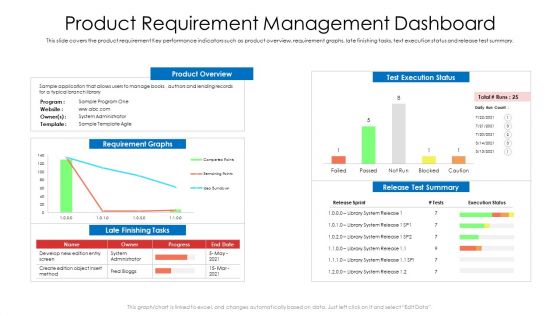
Product Requirement Management Dashboard Ppt Portfolio Clipart PDF
This slide covers the product requirement Key performance indicators such as product overview, requirement graphs, late finishing tasks, text execution status and release test summary. Deliver an awe-inspiring pitch with this creative product requirement management dashboard ppt portfolio clipart pdf bundle. Topics like product overview, requirement graphs, develop can be discussed with this completely editable template. It is available for immediate download depending on the needs and requirements of the user.
Managing Technical And Non Various Kpis For Tracking Business Performance
Mentioned slide provide insights into various key performance indicators to determine business performance. It includes KPIs such as business financials, website traffic, customer case, customer engagement, conversion rate, customer retention, customer bounce rate, employee turnover, etc. Make sure to capture your audiences attention in your business displays with our gratis customizable Managing Technical And Non Various Kpis For Tracking Business Performance. These are great for business strategies, office conferences, capital raising or task suggestions. If you desire to acquire more customers for your tech business and ensure they stay satisfied, create your own sales presentation with these plain slides. Mentioned slide provide insights into various key performance indicators to determine business performance. It includes KPIs such as business financials, website traffic, customer case, customer engagement, conversion rate, customer retention, customer bounce rate, employee turnover, etc.
Comprehensive Guide For Website Various Kpis For Tracking Business Performance
Mentioned slide provide insights into various key performance indicators to determine business performance. It includes KPIs such as business financials, website traffic, customer case, customer engagement, conversion rate, customer retention, customer bounce rate, employee turnover, etc. Make sure to capture your audiences attention in your business displays with our gratis customizable Comprehensive Guide For Website Various Kpis For Tracking Business Performance. These are great for business strategies, office conferences, capital raising or task suggestions. If you desire to acquire more customers for your tech business and ensure they stay satisfied, create your own sales presentation with these plain slides. Mentioned slide provide insights into various key performance indicators to determine business performance. It includes KPIs such as business financials, website traffic, customer case, customer engagement, conversion rate, customer retention, customer bounce rate, employee turnover, etc.
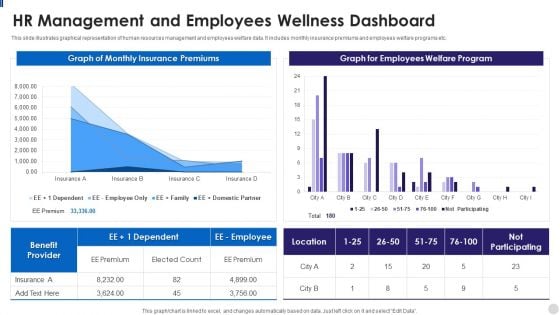
HR Management And Employees Wellness Dashboard Slides PDF
This slide illustrates graphical representation of human resources management and employees welfare data. It includes monthly insurance premiums and employees welfare programs etc. Showcasing this set of slides titled HR Management And Employees Wellness Dashboard Slides PDF. The topics addressed in these templates are Premium, Benefit, Insurance. All the content presented in this PPT design is completely editable. Download it and make adjustments in color, background, font etc. as per your unique business setting.

Project Evaluation And Estimated Results Dashboard Ideas PDF
This slide illustrates graphical representation and facts and figures relating to project management data. It includes budget by employee, overdue tasks, workload charts etc. Showcasing this set of slides titled Project Evaluation And Estimated Results Dashboard Ideas PDF. The topics addressed in these templates are Overdue Tasks, Project Budget, Project Evaluation. All the content presented in this PPT design is completely editable. Download it and make adjustments in color, background, font etc. as per your unique business setting.
Continuous IT Project Tracking In Devops Dashboard Infographics PDF
This slide illustrates facts and data figures related to software project monitoring with DevOps. It includes lines of code, code elements, quality gates, rules, issues, etc. Showcasing this set of slides titled Continuous IT Project Tracking In Devops Dashboard Infographics PDF. The topics addressed in these templates are Most Recent, Baseline Build, Code Elements. All the content presented in this PPT design is completely editable. Download it and make adjustments in color, background, font etc. as per your unique business setting.
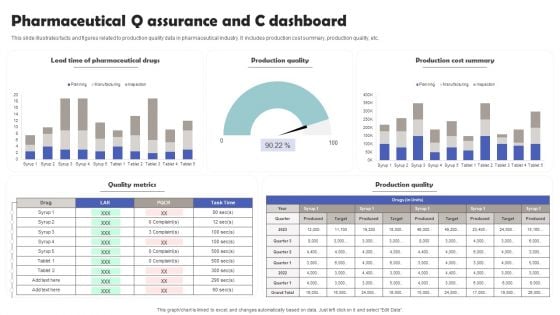
Pharmaceutical Q Assurance And C Dashboard Template PDF
This slide illustrates facts and figures related to production quality data in pharmaceutical industry. It includes production cost summary, production quality, etc. Showcasing this set of slides titled Pharmaceutical Q Assurance And C Dashboard Template PDF. The topics addressed in these templates are Pharmaceutical Drugs, Production Quality, Production Cost Summary. All the content presented in this PPT design is completely editable. Download it and make adjustments in color, background, font etc. as per your unique business setting.
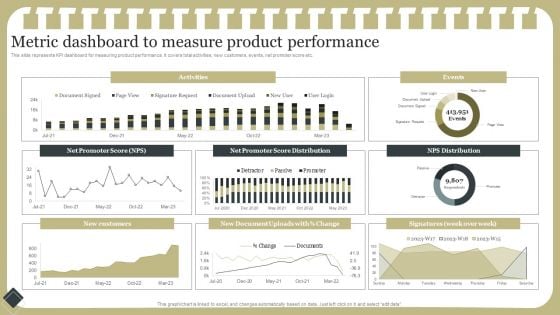
Effective Product Development Strategy Metric Dashboard To Measure Product Performance Information PDF
This slide represents KPI dashboard for measuring product performance. It covers total activities, new customers, events, net promoter score etc.Coming up with a presentation necessitates that the majority of the effort goes into the content and the message you intend to convey. The visuals of a PowerPoint presentation can only be effective if it supplements and supports the story that is being told. Keeping this in mind our experts created Effective Product Development Strategy Metric Dashboard To Measure Product Performance Information PDF to reduce the time that goes into designing the presentation. This way, you can concentrate on the message while our designers take care of providing you with the right template for the situation.
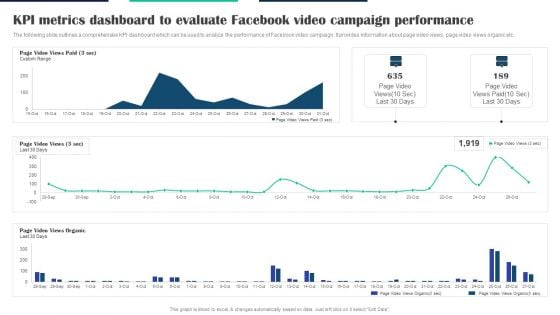
Executing Video Promotional KPI Metrics Dashboard To Evaluate Facebook Video Campaign Summary PDF
The following slide outlines a comprehensive KPI dashboard which can be used to analyze the performance of Facebook video campaign. It provides information about page video views, page video views organic etc. Coming up with a presentation necessitates that the majority of the effort goes into the content and the message you intend to convey. The visuals of a PowerPoint presentation can only be effective if it supplements and supports the story that is being told. Keeping this in mind our experts created Executing Video Promotional KPI Metrics Dashboard To Evaluate Facebook Video Campaign Summary PDF to reduce the time that goes into designing the presentation. This way, you can concentrate on the message while our designers take care of providing you with the right template for the situation.
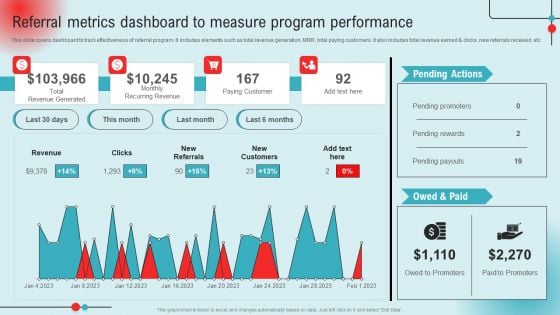
Referral Metrics Dashboard To Measure Program Performance Ppt PowerPoint Presentation Diagram Lists PDF
This slide covers dashboard to track effectiveness of referral program. It includes elements such as total revenue generation, MRR, total paying customers. It also includes total revenue earned and clicks, new referrals received, etc. This Referral Metrics Dashboard To Measure Program Performance Ppt PowerPoint Presentation Diagram Lists PDF from Slidegeeks makes it easy to present information on your topic with precision. It provides customization options, so you can make changes to the colors, design, graphics, or any other component to create a unique layout. It is also available for immediate download, so you can begin using it right away. Slidegeeks has done good research to ensure that you have everything you need to make your presentation stand out. Make a name out there for a brilliant performance.
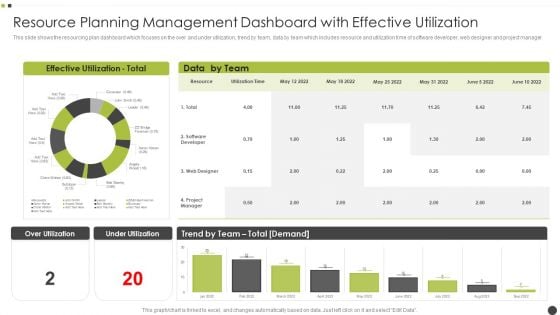
Resource Planning Management Dashboard With Effective Utilization Mockup PDF
This slide shows the resourcing plan dashboard which focuses on the over and under utilization, trend by team, data by team which includes resource and utilization time of software developer, web designer and project manager. Pitch your topic with ease and precision using this Resource Planning Management Dashboard With Effective Utilization Mockup PDF. This layout presents information on Web Designer, Software Developer, Team. It is also available for immediate download and adjustment. So, changes can be made in the color, design, graphics or any other component to create a unique layout.
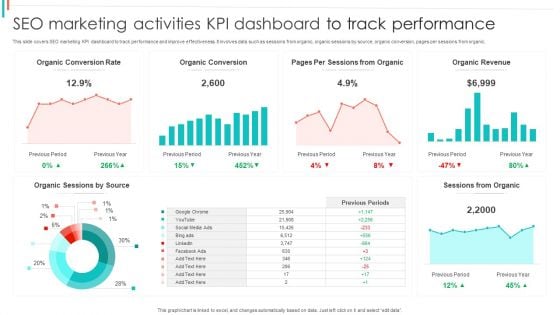
SEO Marketing Activities KPI Dashboard To Track Performance Brochure PDF
This slide covers SEO marketing KPI dashboard to track performance and improve effectiveness. It involves data such as sessions from organic, organic sessions by source, organic conversion, pages per sessions from organic.Pitch your topic with ease and precision using this SEO Marketing Activities KPI Dashboard To Track Performance Brochure PDF. This layout presents information on Organic Conversion, Sessions Organic, Organic Revenue. It is also available for immediate download and adjustment. So, changes can be made in the color, design, graphics or any other component to create a unique layout.

Manufactured Products Sales Performance Monitoring Dashboard Information PDF
This slide shows the dashboard the data related to the sales performance of the products manufactured by the organization in order to effectively measure and monitor the performance of the sales team. It shows details related to revenue generated and units sold etc.Pitch your topic with ease and precision using this Manufactured Products Sales Performance Monitoring Dashboard Information PDF. This layout presents information on Monthly Revenue, Manufactured Products, Sales Performance Monitoring. It is also available for immediate download and adjustment. So, changes can be made in the color, design, graphics or any other component to create a unique layout.
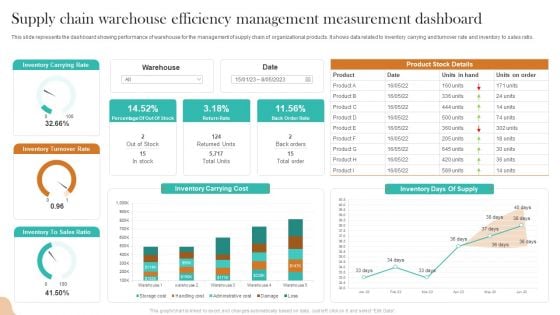
Supply Chain Warehouse Efficiency Management Measurement Dashboard Inspiration PDF
This slide represents the dashboard showing performance of warehouse for the management of supply chain of organizational products. It shows data related to inventory carrying and turnover rate and inventory to sales ratio. Pitch your topic with ease and precision using this Supply Chain Warehouse Efficiency Management Measurement Dashboard Inspiration PDF. This layout presents information on Inventory Carrying Rate, Inventory Turnover Rate, Inventory Carrying Cost. It is also available for immediate download and adjustment. So, changes can be made in the color, design, graphics or any other component to create a unique layout.
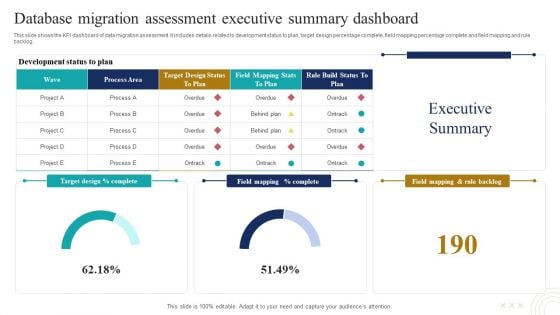
Database Migration Assessment Executive Summary Dashboard Mockup PDF
This slide shows the KPI dashboard of data migration assessment. It includes details related to development status to plan, target design percentage complete, field mapping percentage complete and field mapping and rule backlog. Pitch your topic with ease and precision using this Database Migration Assessment Executive Summary Dashboard Mockup PDF. This layout presents information on Wave, Process Area, Rule Build Status Plan. It is also available for immediate download and adjustment. So, changes can be made in the color, design, graphics or any other component to create a unique layout
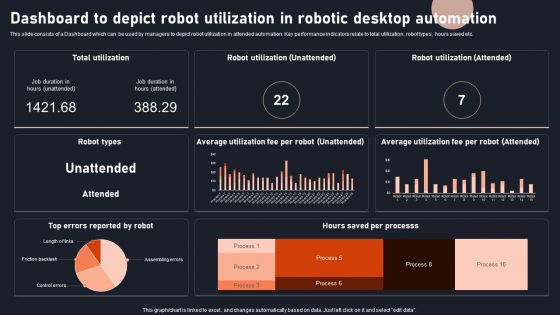
Dashboard To Depict Robot Utilization In Robotic Desktop Automation Download PDF
This slide consists of a Dashboard which can be used by managers to depict robot utilization in attended automation. Key performance indicators relate to total utilization, robot types, hours saved etc. Pitch your topic with ease and precision using this Dashboard To Depict Robot Utilization In Robotic Desktop Automation Download PDF. This layout presents information on Dashboard, Depict Robot Utilization, Robotic Desktop Automation. It is also available for immediate download and adjustment. So, changes can be made in the color, design, graphics or any other component to create a unique layout.
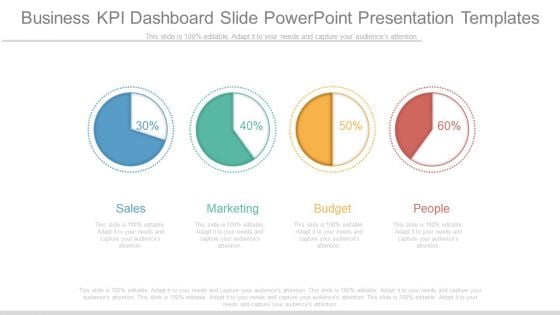
Business Kpi Dashboard Slide Powerpoint Presentation Templates
This is a business kpi dashboard slide powerpoint presentation templates. This is a four stage process. The stages in this process are sales, marketing, budget, people.

Implementing Succession Planning HR Performance Management Dashboard Microsoft PDF
This graph or chart is linked to excel, and changes automatically based on data. Just left click on it and select Edit Data. Find highly impressive Implementing Succession Planning HR Performance Management Dashboard Microsoft PDF on Slidegeeks to deliver a meaningful presentation. You can save an ample amount of time using these presentation templates. No need to worry to prepare everything from scratch because Slidegeeks experts have already done a huge research and work for you. You need to download Implementing Succession Planning HR Performance Management Dashboard Microsoft PDF for your upcoming presentation. All the presentation templates are 100 percent editable and you can change the color and personalize the content accordingly. Download now.
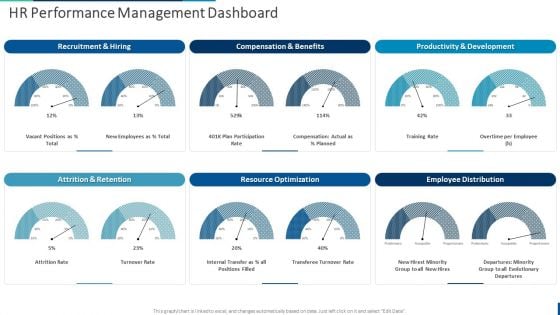
Internal Employee Succession HR Performance Management Dashboard Guidelines PDF
This graph or chart is linked to excel, and changes automatically based on data. Just left click on it and select Edit Data. Find highly impressive Internal Employee Succession HR Performance Management Dashboard Guidelines PDF on Slidegeeks to deliver a meaningful presentation. You can save an ample amount of time using these presentation templates. No need to worry to prepare everything from scratch because Slidegeeks experts have already done a huge research and work for you. You need to download Internal Employee Succession HR Performance Management Dashboard Guidelines PDF for your upcoming presentation. All the presentation templates are 100 percent editable and you can change the color and personalize the content accordingly. Download now

Developing Appealing Persona Customer Satisfaction Kpi Dashboard Microsoft PDF
This graph or chart is linked to excel, and changes automatically based on data. Just left click on it and select Edit Data. Do you have an important presentation coming up Are you looking for something that will make your presentation stand out from the rest Look no further than Developing Appealing Persona Customer Satisfaction Kpi Dashboard Microsoft PDF. With our professional designs, you can trust that your presentation will pop and make delivering it a smooth process. And with Slidegeeks, you can trust that your presentation will be unique and memorable. So why wait Grab Developing Appealing Persona Customer Satisfaction Kpi Dashboard Microsoft PDF today and make your presentation stand out from the rest
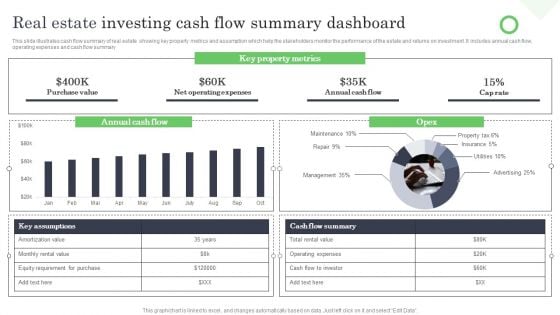
Real Estate Investing Cash Flow Summary Dashboard Ppt Model Design Ideas PDF
This slide illustrates cash flow summary of real estate showing key property metrics and assumption which help the stakeholders monitor the performance of the estate and returns on investment. It includes annual cash flow, operating expenses and cash flow summary. Showcasing this set of slides titled Real Estate Investing Cash Flow Summary Dashboard Ppt Model Design Ideas PDF. The topics addressed in these templates are Key Property Metrics, Cap Rate, Annual Cash Flow, Net Operating Expenses. All the content presented in this PPT design is completely editable. Download it and make adjustments in color, background, font etc. as per your unique business setting.
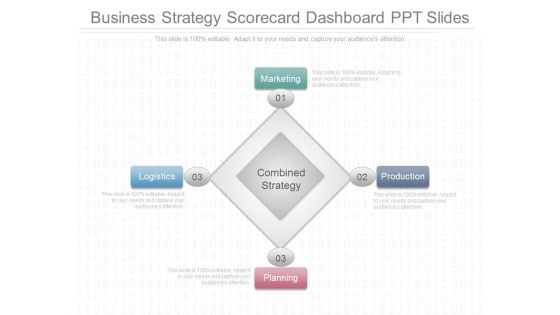
Business Strategy Scorecard Dashboard Ppt Slides
This is a business strategy scorecard dashboard ppt slides. This is a five stage process. The stages in this process are marketing, logistics, production, planning, combined strategy.
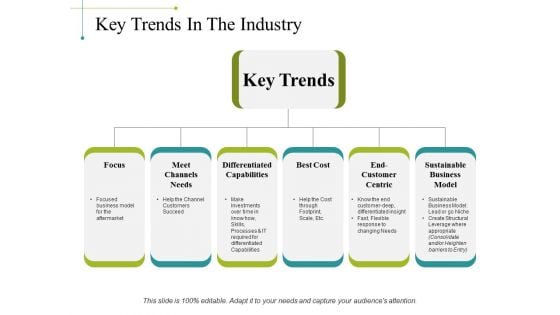
Key Trends In The Industry Ppt PowerPoint Presentation Portfolio Design Inspiration
This is a key trends in the industry ppt powerpoint presentation portfolio design inspiration. This is a six stage process. The stages in this process are focus, meet channels needs, differentiated capabilities, best cost, sustainable business model.
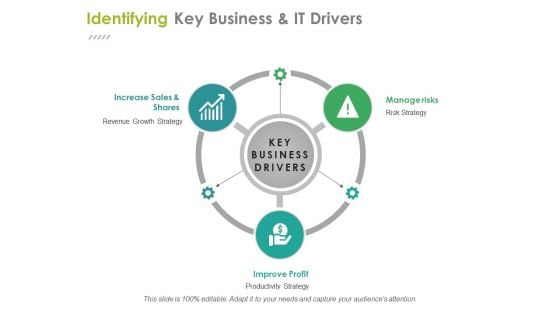
Identifying Key Business And It Drivers Ppt PowerPoint Presentation Ideas Files
This is a identifying key business and it drivers ppt powerpoint presentation ideas files. This is a three stage process. The stages in this process are increase sales and shares, improve profit, manage risks, business, management.
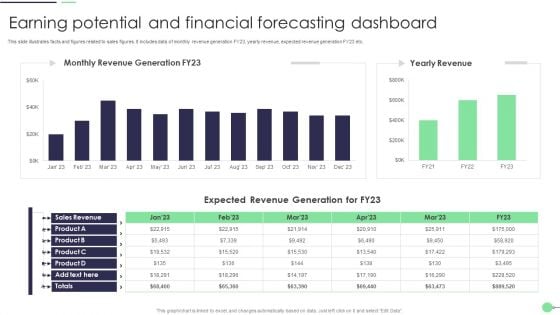
Earning Potential And Financial Forecasting Dashboard Summary PDF
This slide illustrates facts and figures related to sales figures. It includes data of monthly revenue generation FY23, yearly revenue, expected revenue generation FY23 etc. Pitch your topic with ease and precision using this Earning Potential And Financial Forecasting Dashboard Summary PDF. This layout presents information on Sales Revenue, Expected Revenue, Product. It is also available for immediate download and adjustment. So, changes can be made in the color, design, graphics or any other component to create a unique layout.
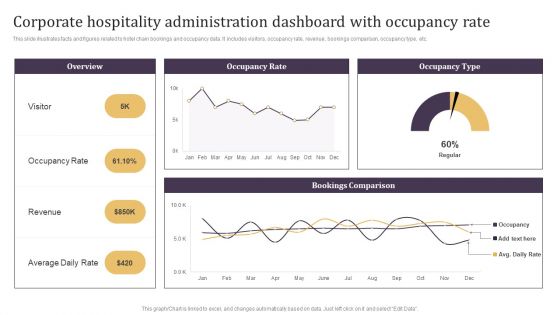
Corporate Hospitality Administration Dashboard With Occupancy Rate Guidelines PDF
This slide illustrates facts and figures related to hotel chain bookings and occupancy data. It includes visitors, occupancy rate, revenue, bookings comparison, occupancy type, etc.Pitch your topic with ease and precision using this Corporate Hospitality Administration Dashboard With Occupancy Rate Guidelines PDF. This layout presents information on Occupancy Rate, Average Daily Rate, Bookings Comparison. It is also available for immediate download and adjustment. So, changes can be made in the color, design, graphics or any other component to create a unique layout.
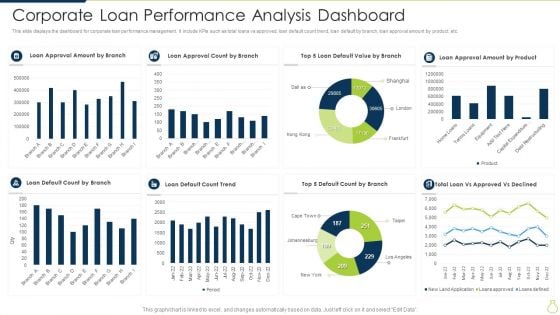
Corporate Loan Performance Analysis Dashboard Slides PDF
This slide displays the dashboard for corporate loan performance management. It include KPIs such as total loans vs approved, loan default count trend, loan default by branch, loan approval amount by product, etc. Showcasing this set of slides titled Corporate Loan Performance Analysis Dashboard Slides PDF. The topics addressed in these templates are Loan Default Count Trend, Loan Approval Count By Branch, Loan Approval Amount By Product. All the content presented in this PPT design is completely editable. Download it and make adjustments in color, background, font etc. as per your unique business setting.
Company Financials Performance Tracking Dashboard Brochure PDF
This slide illustrates KPI dashboard that can be used by organizations to track their financial performance on company basis. Kpis covered in the slide are contract status, revenue, cost of goods, overdue and task status. Showcasing this set of slides titled Company Financials Performance Tracking Dashboard Brochure PDF. The topics addressed in these templates are Report Shortcut, Revenue Cost, Overdue Task. All the content presented in this PPT design is completely editable. Download it and make adjustments in color, background, font etc. as per your unique business setting.
Investment Project Prioritization KPI Dashboard Icons PDF
This slide covers project management dashboard for ranking and filtering capital projects. It also include KPIs such as top projects by NPV, top projects by IRR, investor amount, return amount, etc. Showcasing this set of slides titled Investment Project Prioritization KPI Dashboard Icons PDF. The topics addressed in these templates are Project Performance, Top Project NPV, Top Project IRR. All the content presented in this PPT design is completely editable. Download it and make adjustments in color, background, font etc. as per your unique business setting.
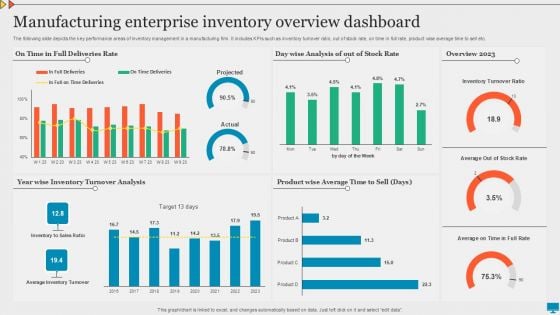
Manufacturing Enterprise Inventory Overview Dashboard Graphics PDF
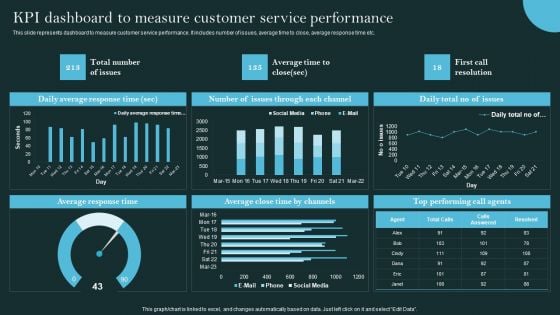
Revolutionizing Customer Support Through Digital Transformation KPI Dashboard To Measure Customer Elements PDF
This slide represents dashboard to measure customer service performance. It includes number of issues, average time to close, average response time etc. Take your projects to the next level with our ultimate collection of Revolutionizing Customer Support Through Digital Transformation KPI Dashboard To Measure Customer Elements PDF. Slidegeeks has designed a range of layouts that are perfect for representing task or activity duration, keeping track of all your deadlines at a glance. Tailor these designs to your exact needs and give them a truly corporate look with your own brand colors they will make your projects stand out from the rest.


 Continue with Email

 Home
Home


