Snapshot
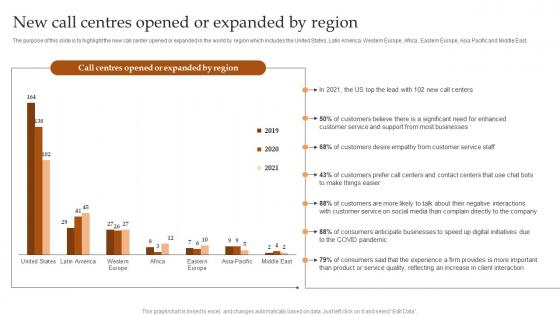
New Call Centres Opened Or Expanded By Region IT And Tech Support Business Portrait Pdf
The purpose of this slide is to highlight the new call center opened or expanded in the world by region which includes the United States, Latin America, Western Europe, Africa, Eastern Europe, Asia Pacific and Middle East. Take your projects to the next level with our ultimate collection of New Call Centres Opened Or Expanded By Region IT And Tech Support Business Portrait Pdf Slidegeeks has designed a range of layouts that are perfect for representing task or activity duration, keeping track of all your deadlines at a glance. Tailor these designs to your exact needs and give them a truly corporate look with your own brand colors they well make your projects stand out from the rest. The purpose of this slide is to highlight the new call center opened or expanded in the world by region which includes the United States, Latin America, Western Europe, Africa, Eastern Europe, Asia Pacific and Middle East.
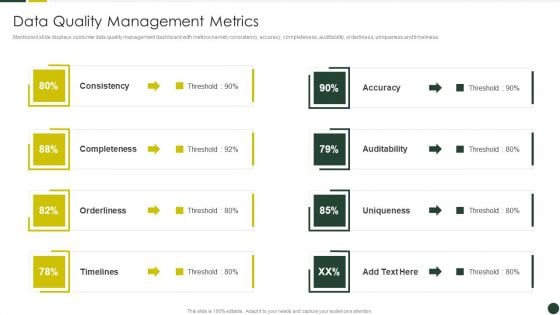
Quality Management Plan Templates Set 2 Data Quality Management Metrics Structure PDF
Mentioned slide displays customer data quality management dashboard with metrics namely consistency, accuracy, completeness, auditability, orderliness, uniqueness and timeliness. Deliver an awe inspiring pitch with this creative Quality Management Plan Templates Set 2 Data Quality Management Metrics Structure PDF bundle. Topics like Consistency, Completeness, Orderliness can be discussed with this completely editable template. It is available for immediate download depending on the needs and requirements of the user.
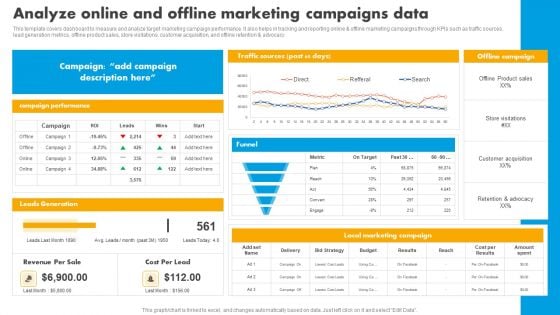
Analyze Online And Offline Marketing Campaigns Data Graphics PDF
This template covers dashboard to measure and analyze target marketing campaign performance. It also helps in tracking and reporting online and offline marketing campaigns through KPIs such as traffic sources, lead generation metrics, offline product sales, store visitations, customer acquisition, and offline retention and advocacy. If you are looking for a format to display your unique thoughts, then the professionally designed Analyze Online And Offline Marketing Campaigns Data Graphics PDF is the one for you. You can use it as a Google Slides template or a PowerPoint template. Incorporate impressive visuals, symbols, images, and other charts. Modify or reorganize the text boxes as you desire. Experiment with shade schemes and font pairings. Alter, share or cooperate with other people on your work. Download Analyze Online And Offline Marketing Campaigns Data Graphics PDF and find out how to give a successful presentation. Present a perfect display to your team and make your presentation unforgettable.
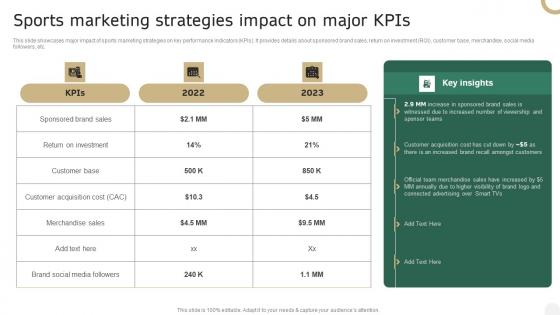
Sports Marketing Strategies Impact On Major Kpis In Depth Campaigning Guide Infographics PDF
This slide showcases major impact of sports marketing strategies on key performance indicators KPIs. It provides details about sponsored brand sales, return on investment ROI, customer base, merchandise, social media followers, etc. Present like a pro with Sports Marketing Strategies Impact On Major Kpis In Depth Campaigning Guide Infographics PDF Create beautiful presentations together with your team, using our easy-to-use presentation slides. Share your ideas in real-time and make changes on the fly by downloading our templates. So whether you are in the office, on the go, or in a remote location, you can stay in sync with your team and present your ideas with confidence. With Slidegeeks presentation got a whole lot easier. Grab these presentations today. This slide showcases major impact of sports marketing strategies on key performance indicators KPIs. It provides details about sponsored brand sales, return on investment ROI, customer base, merchandise, social media followers, etc.
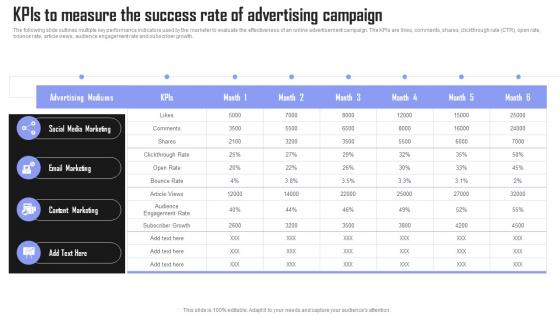
KPIs To Measure Success Rate Brand Building Techniques To Gain Competitive Edge Background Pdf
The following slide outlines multiple key performance indicators used by the marketer to evaluate the effectiveness of an online advertisement campaign. The KPIs are likes, comments, shares, clickthrough rate CTR, open rate, bounce rate, article views, audience engagement rate and subscriber growth. The best PPT templates are a great way to save time, energy, and resources. Slidegeeks have 100 percent editable powerpoint slides making them incredibly versatile. With these quality presentation templates, you can create a captivating and memorable presentation by combining visually appealing slides and effectively communicating your message. Download KPIs To Measure Success Rate Brand Building Techniques To Gain Competitive Edge Background Pdf from Slidegeeks and deliver a wonderful presentation. The following slide outlines multiple key performance indicators used by the marketer to evaluate the effectiveness of an online advertisement campaign. The KPIs are likes, comments, shares, clickthrough rate CTR, open rate, bounce rate, article views, audience engagement rate and subscriber growth.
Brand Positioning Through Successful Content Marketing Dashboard For Effective Tracking Infographics PDF
Purpose of the following slide is to show key metrics that can help the organization to track their content marketing efforts, these metrics are ad cost, visits, cost per click etc. Create an editable Brand Positioning Through Successful Content Marketing Dashboard For Effective Tracking Infographics PDF that communicates your idea and engages your audience. Whether you are presenting a business or an educational presentation, pre designed presentation templates help save time. Brand Positioning Through Successful Content Marketing Dashboard For Effective Tracking Infographics PDF is highly customizable and very easy to edit, covering many different styles from creative to business presentations. Slidegeeks has creative team members who have crafted amazing templates. So, go and get them without any delay.
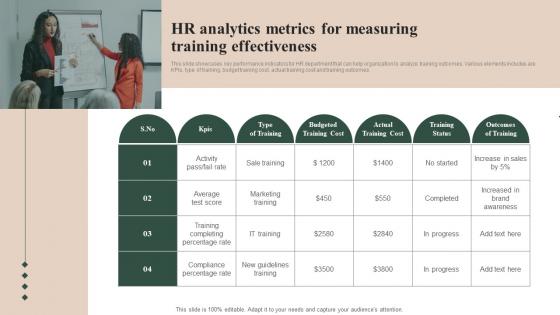
HR Analytics Metrics For Measuring Training Effectiveness Infographics Pdf
This slide showcases key performance indicators for HR department that can help organization to analyze training outcomes. Various elements includes are KPIs, type of training, budget training cost, actual training cost and training outcomes Showcasing this set of slides titled HR Analytics Metrics For Measuring Training Effectiveness Infographics Pdf The topics addressed in these templates are Percentage Rate, Training Completing, Marketing Training All the content presented in this PPT design is completely editable. Download it and make adjustments in color, background, font etc. as per your unique business setting. This slide showcases key performance indicators for HR department that can help organization to analyze training outcomes. Various elements includes are KPIs, type of training, budget training cost, actual training cost and training outcomes.

Customer Engagement Methods For Online Platforms Dashboards To Measure Performance Elements PDF
This following slide displays the key metrics that can help an organization to measure effectiveness of google shopping strategies. These can be keyword quality score, clicks and conversions etc. Slidegeeks is here to make your presentations a breeze with Customer Engagement Methods For Online Platforms Dashboards To Measure Performance Elements PDF With our easy to use and customizable templates, you can focus on delivering your ideas rather than worrying about formatting. With a variety of designs to choose from, youre sure to find one that suits your needs. And with animations and unique photos, illustrations, and fonts, you can make your presentation pop. So whether youre giving a sales pitch or presenting to the board, make sure to check out Slidegeeks first.
Techniques To Enhance Customer Engagement Via Digital Platforms Dashboard To Measure Performance Of Social Icons PDF
This following slide displays the key metrics that can help an organization to measure effectiveness of social media strategies. These can be leads generated, leads by region, web traffic targets etc. Slidegeeks is here to make your presentations a breeze with Techniques To Enhance Customer Engagement Via Digital Platforms Dashboard To Measure Performance Of Social Icons PDF With our easy-to-use and customizable templates, you can focus on delivering your ideas rather than worrying about formatting. With a variety of designs to choose from, you are sure to find one that suits your needs. And with animations and unique photos, illustrations, and fonts, you can make your presentation pop. So whether you are giving a sales pitch or presenting to the board, make sure to check out Slidegeeks first.
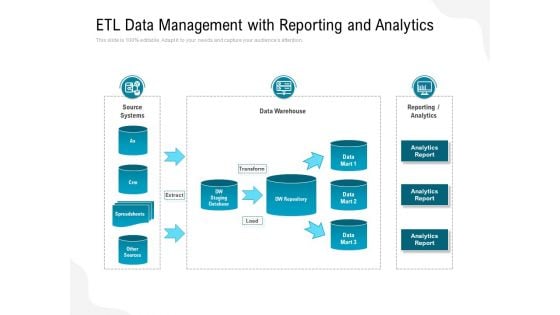
ETL Data Management With Reporting And Analytics Ppt PowerPoint Presentation Gallery Slide Download PDF
Pitch your topic with ease and precision using this etl data management with reporting and analytics ppt powerpoint presentation gallery slide download pdf. This layout presents information on source systems, data warehouse, analytics. It is also available for immediate download and adjustment. So, changes can be made in the color, design, graphics or any other component to create a unique layout.
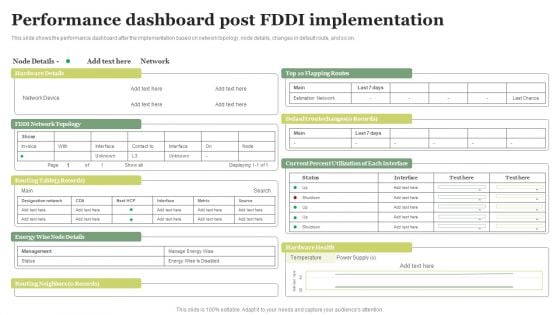
Performance Dashboard Post FDDI Implementation Sample PDF
This slide shows the performance dashboard after the implementation based on network topology, node details, changes in default route, and so on. This modern and well arranged Performance Dashboard Post FDDI Implementation Sample PDF provides lots of creative possibilities. It is very simple to customize and edit with the Powerpoint Software. Just drag and drop your pictures into the shapes. All facets of this template can be edited with Powerpoint no extra software is necessary. Add your own material, put your images in the places assigned for them, adjust the colors, and then you can show your slides to the world, with an animated slide included.
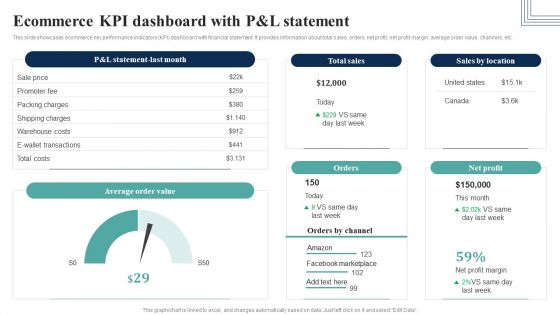
How Electronic Commerce Financial Procedure Can Be Enhanced Ecommerce Kpi Dashboard Slides PDF
This slide showcases ecommerce key performance indicators KPI dashboard with financial statement. It provides information about total sales, orders, net profit, net profit margin, average order value, channels, etc.Create an editable How Electronic Commerce Financial Procedure Can Be Enhanced Ecommerce Kpi Dashboard Slides PDF that communicates your idea and engages your audience. Whether you are presenting a business or an educational presentation, pre-designed presentation templates help save time. How Electronic Commerce Financial Procedure Can Be Enhanced Ecommerce Kpi Dashboard Slides PDF is highly customizable and very easy to edit, covering many different styles from creative to business presentations. Slidegeeks has creative team members who have crafted amazing templates. So, go and get them without any delay.
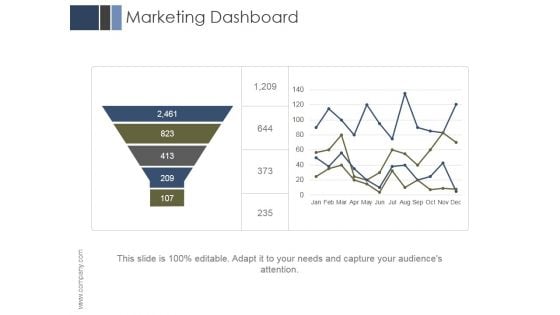
Marketing Dashboard Ppt PowerPoint Presentation Templates
This is a marketing dashboard ppt powerpoint presentation templates. This is a two stage process. The stages in this process are business, marketing, management, finance, dashboard.
Online Marketing Analytics To Enhance Business Growth Website Landing Page KPI Tracking Dashboard Sample PDF
This slide covers a dashboard for analyzing the metrics of the website landing page. It includes KPIs such as conversions, conversion rate, sessions, bounce rate, engagement sickness, etc. If your project calls for a presentation, then Slidegeeks is your go to partner because we have professionally designed, easy to edit templates that are perfect for any presentation. After downloading, you can easily edit Online Marketing Analytics To Enhance Business Growth Website Landing Page KPI Tracking Dashboard Sample PDF and make the changes accordingly. You can rearrange slides or fill them with different images. Check out all the handy templates
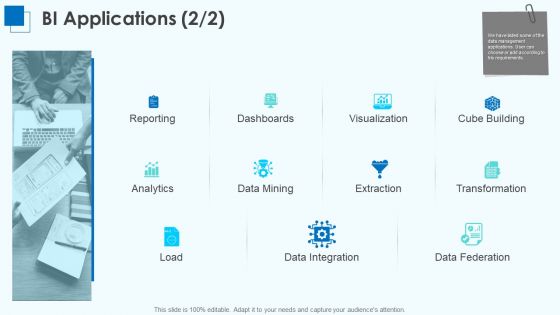
Corporate Intelligence Business Analysis BI Applications Load Ppt Pictures Rules PDF
This is a corporate intelligence business analysis bi applications load ppt pictures rules pdf template with various stages. Focus and dispense information on eleven stages using this creative set, that comes with editable features. It contains large content boxes to add your information on topics like reporting, analytics, data mining, dashboards, visualization. You can also showcase facts, figures, and other relevant content using this PPT layout. Grab it now.
Ppt Hexagon Shapes Sketch Editable PowerPoint Certificate Templates
PPT hexagon shapes sketch editable powerpoint certificate templates-You can divide information into segments for illustrating proportion. This chart is an effective way of displaying information you can edit text, color, shade and style as per you need. This template is designed to attract the attention of your audience-PPT hexagon shapes sketch editable powerpoint certificate templates-Abstract, Background, Design, Digital, Elements, Graphic, Grey, Hexagon, Illustration, Light, Modern, Perspective, Triangles, Shapes, Shiny, Style, Technology, Template, Vector, Vertical, Virtual, Wallpaper, Web Put your estimates on the line. Our Ppt Hexagon Shapes Sketch Editable PowerPoint Certificate Templates will establish their accuracy.
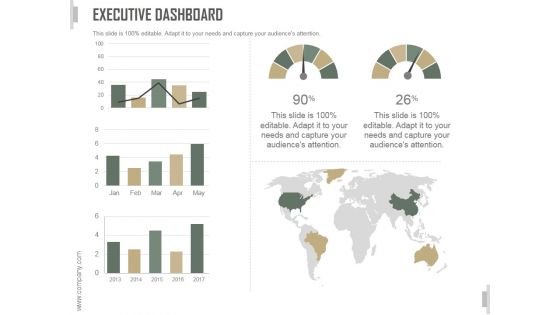
Executive Dashboard Ppt PowerPoint Presentation Examples
This is a executive dashboard ppt powerpoint presentation examples. This is a two stage process. The stages in this process are business, strategy, marketing, dashboard, location, bar chart.
Dashboard Finance Ppt PowerPoint Presentation Icon Aids
This is a dashboard finance ppt powerpoint presentation icon aids. This is a three stage process. The stages in this process are dashboard, finance, analysis, business, investment.
Data Consumption Analytics Report Vector Icon Ppt PowerPoint Presentation Gallery Show PDF
Persuade your audience using this data consumption analytics report vector icon ppt powerpoint presentation gallery show pdf. This PPT design covers three stages, thus making it a great tool to use. It also caters to a variety of topics including data consumption analytics report vector icon. Download this PPT design now to present a convincing pitch that not only emphasizes the topic but also showcases your presentation skills.
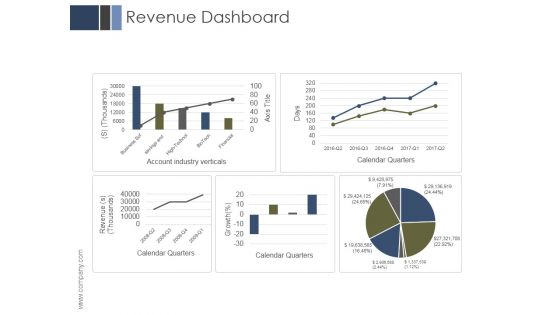
Revenue Dashboard Ppt PowerPoint Presentation Files
This is a revenue dashboard ppt powerpoint presentation files. This is a five stage process. The stages in this process are business, marketing, management, revenue, dashboard.
Content Marketing Dashboard For Effective Tracking B2B Electronic Commerce Startup Information PDF
Purpose of the following slide is to show key metrics that can help the organization to track their content marketing efforts, these metrics are ad cost, visits, cost per click etc. Find highly impressive Content Marketing Dashboard For Effective Tracking B2B Electronic Commerce Startup Information PDF on Slidegeeks to deliver a meaningful presentation. You can save an ample amount of time using these presentation templates. No need to worry to prepare everything from scratch because Slidegeeks experts have already done a huge research and work for you. You need to download Content Marketing Dashboard For Effective Tracking B2B Electronic Commerce Startup Information PDF for your upcoming presentation. All the presentation templates are 100 percent editable and you can change the color and personalize the content accordingly. Download now.
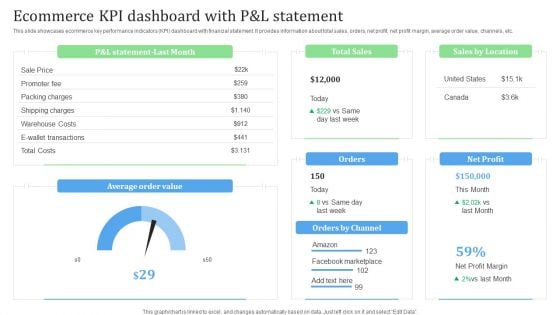
Ecommerce KPI Dashboard With P And L Statement Financial Management Strategies Background PDF
This slide showcases ecommerce key performance indicators KPI dashboard with financial statement. It provides information about total sales, orders, net profit, net profit margin, average order value, channels, etc.Whether you have daily or monthly meetings, a brilliant presentation is necessary. Ecommerce KPI Dashboard With P And L Statement Financial Management Strategies Background PDF can be your best option for delivering a presentation. Represent everything in detail using Ecommerce KPI Dashboard With P And L Statement Financial Management Strategies Background PDF and make yourself stand out in meetings. The template is versatile and follows a structure that will cater to your requirements. All the templates prepared by Slidegeeks are easy to download and edit. Our research experts have taken care of the corporate themes as well. So, give it a try and see the results.
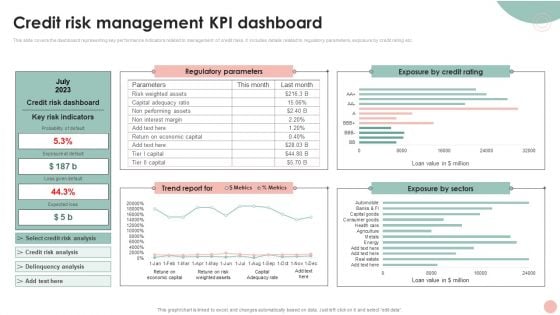
Company Risk Assessment Plan Credit Risk Management KPI Dashboard Rules PDF
This slide covers the dashboard representing key performance indicators related to management of credit risks. It includes details related to regulatory parameters, exposure by credit rating etc. Do you have an important presentation coming up. Are you looking for something that will make your presentation stand out from the rest. Look no further than Company Risk Assessment Plan Credit Risk Management KPI Dashboard Rules PDF. With our professional designs, you can trust that your presentation will pop and make delivering it a smooth process. And with Slidegeeks, you can trust that your presentation will be unique and memorable. So why wait. GrabCompany Risk Assessment Plan Credit Risk Management KPI Dashboard Rules PDF today and make your presentation stand out from the rest.
Shipping And Logistics Tracking Dashboard With Shipments And Fleet Status Ideas PDF
This slide covers Key performance indicators to track the automation system of the company. This dashboard includes Logistics Efficiency Status, delivery time accuracy etc. Get a simple yet stunning designed Shipping And Logistics Tracking Dashboard With Shipments And Fleet Status Ideas PDF. It is the best one to establish the tone in your meetings. It is an excellent way to make your presentations highly effective. So, download this PPT today from Slidegeeks and see the positive impacts. Our easy to edit Shipping And Logistics Tracking Dashboard With Shipments And Fleet Status Ideas PDF can be your go to option for all upcoming conferences and meetings. So, what are you waiting for Grab this template today.
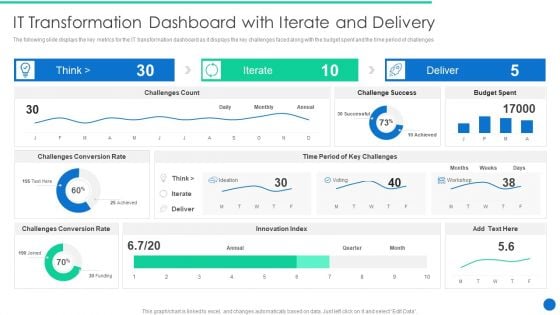
ERP Digital Transformation Journey It Transformation Dashboard With Iterate And Delivery Clipart PDF
The following slide displays the key metrics for the IT transformation dashboard as it displays the key challenges faced along with the budget spent and the time period of challenges. Deliver and pitch your topic in the best possible manner with this ERP Digital Transformation Journey It Transformation Dashboard With Iterate And Delivery Clipart PDF. Use them to share invaluable insights on Challenges Conversion, Budget Spent, Innovation Index and impress your audience. This template can be altered and modified as per your expectations. So, grab it now.
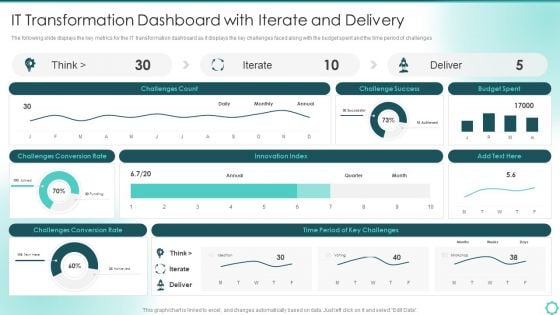
Digitalization Of Transportation Enterprise IT Transformation Dashboard With Iterate And Delivery Designs PDF
The following slide displays the key metrics for the IT transformation dashboard as it displays the key challenges faced along with the budget spent and the time period of challenges. Deliver and pitch your topic in the best possible manner with this Digitalization Of Transportation Enterprise IT Transformation Dashboard With Iterate And Delivery Designs PDF. Use them to share invaluable insights on Innovation Index, Budget Spent, Conversion Rate and impress your audience. This template can be altered and modified as per your expectations. So, grab it now.
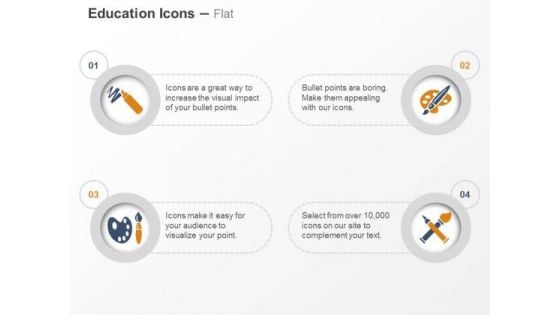
Color Paint Board Brush Sketch Ppt Slides Graphics
This power point template has been designed with icons of color, paint board and brush with sketch. This icon template is suitable for drawing and artwork related topics. Use this icons diagram slide to make impressive presentations.
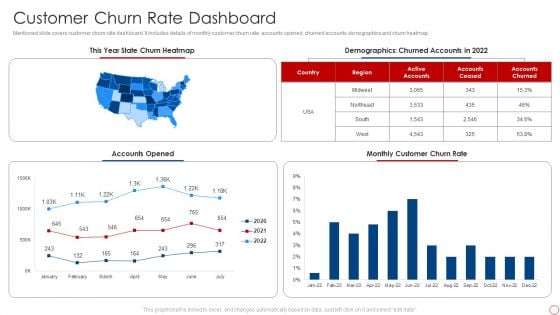
Kpis For Evaluating Business Sustainability Customer Churn Rate Dashboard Guidelines PDF
Mentioned slide covers customer churn rate dashboard. It includes details of monthly customer churn rate, accounts opened, churned accounts demographics and churn heatmap. Deliver an awe inspiring pitch with this creative Kpis For Evaluating Business Sustainability Customer Churn Rate Dashboard Guidelines PDF bundle. Topics like Accounts Opened, Monthly Customer, Churn Rate, Demographics can be discussed with this completely editable template. It is available for immediate download depending on the needs and requirements of the user.
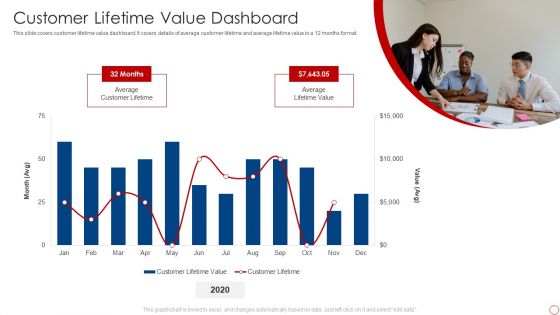
Kpis For Evaluating Business Sustainability Customer Lifetime Value Dashboard Clipart PDF
This slide covers customer lifetime value dashboard. It covers details of average customer lifetime and average lifetime value in a 12 months format. Deliver and pitch your topic in the best possible manner with this Kpis For Evaluating Business Sustainability Customer Lifetime Value Dashboard Clipart PDF. Use them to share invaluable insights on Average Customer Lifetime, Average Lifetime Value and impress your audience. This template can be altered and modified as per your expectations. So, grab it now.
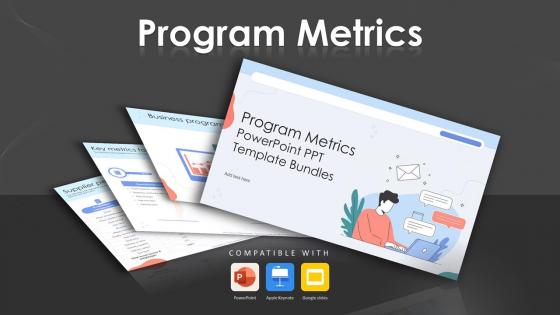
Program Metrics Powerpoint Ppt Template Bundles
Increase your chances of writing a winning business proposal and grabbing your prospects attention with this well-crafted, innovative Program Metrics Powerpoint Ppt Template Bundles. This Business Program Continuity, Program Management, Supplier Performance Evaluation-slide presentation template comes with in-built content to help you outline a presentation that can serve as an industry benchmark. The complete deck also makes use of an impressive color scheme to create a visual impact and hook the audience. Use this PPT to plan how your business can be the Numero uno in its segment within no time at all. Download now to showcase your brand USP and offerings to engage your client. Our Program Metrics PowerPoint Template Bundles are thoughtfully crafted to offer a visually appealing background for any topic, helping you deliver a professional presentation.
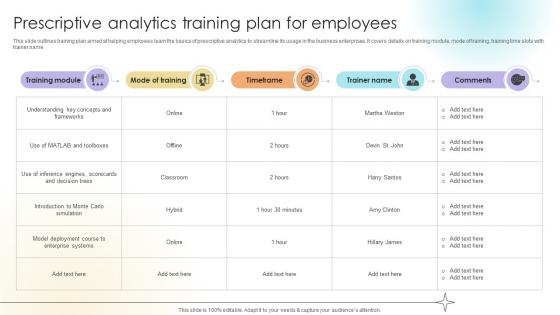
Prescriptive Analytics Training Plan For Employees Data Analytics SS V
This slide outlines training plan aimed at helping employees learn the basics of prescriptive analytics to streamline its usage in the business enterprises. It covers details on training module, mode of training, training time slots with trainer name.Slidegeeks has constructed Prescriptive Analytics Training Plan For Employees Data Analytics SS V after conducting extensive research and examination. These presentation templates are constantly being generated and modified based on user preferences and critiques from editors. Here, you will find the most attractive templates for a range of purposes while taking into account ratings and remarks from users regarding the content. This is an excellent jumping-off point to explore our content and will give new users an insight into our top-notch PowerPoint Templates. This slide outlines training plan aimed at helping employees learn the basics of prescriptive analytics to streamline its usage in the business enterprises. It covers details on training module, mode of training, training time slots with trainer name.

KPI Dashboard Showing Results Of Sales And Marketing Project Campaign Formats PDF
Following slide showcases performance KPI dashboard used to evaluate marketing project campaign results. The dashboard provides overview of key metrics such as total revenue, marketing spend, profit and cost per acquisition, leads etc. Showcasing this set of slides titled KPI Dashboard Showing Results Of Sales And Marketing Project Campaign Formats PDF. The topics addressed in these templates are Marketing Spend, Revenue, Profit Per Acquisition. All the content presented in this PPT design is completely editable. Download it and make adjustments in color, background, font etc. as per your unique business setting.
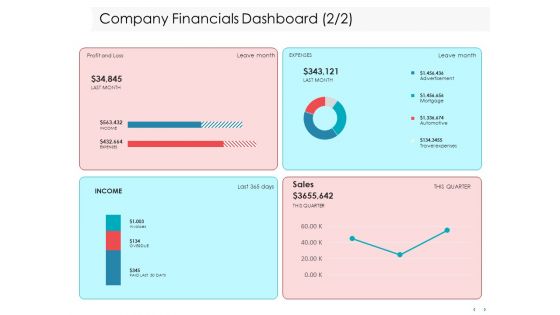
Managing CFO Services Company Financials Dashboard Profit Ppt Infographics Example File PDF
Presenting this set of slides with name managing cfo services company financials dashboard profit ppt infographics example file pdf. The topics discussed in these slides are revenue, customers, vendors, profit, expense, performance. This is a completely editable PowerPoint presentation and is available for immediate download. Download now and impress your audience.
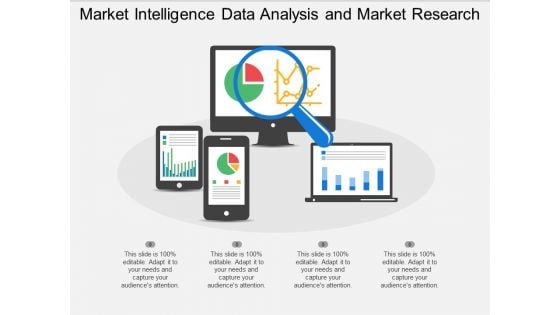
Market Intelligence Data Analysis And Market Research Ppt PowerPoint Presentation Professional Templates
This is a market intelligence data analysis and market research ppt powerpoint presentation professional templates. This is a four stage process. The stages in this process are digital analytics, digital dashboard, marketing.

Brand Kickoff Promotional Plan Marketing Channels With KPIs To Be Tracked Portrait Pdf
This template covers brand launch success tracking key performance indicators such as Engagement Likes, Comments, and Share, Followers growth, Story metrices Story Replies, Story Tap back and Forward, Story Impression etc. Boost your pitch with our creative Brand Kickoff Promotional Plan Marketing Channels With KPIs To Be Tracked Portrait Pdf. Deliver an awe-inspiring pitch that will mesmerize everyone. Using these presentation templates you will surely catch everyones attention. You can browse the ppts collection on our website. We have researchers who are experts at creating the right content for the templates. So you do not have to invest time in any additional work. Just grab the template now and use them. This template covers brand launch success tracking key performance indicators such as Engagement Likes, Comments, and Share, Followers growth, Story metrices Story Replies, Story Tap back and Forward, Story Impression etc.
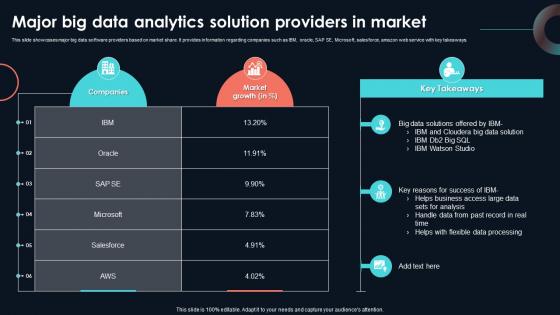
Major Big Data Analytics Solution Providers Developing Strategic Insights Using Big Data Analytics SS V
This slide showcases major big data software providers based on market share. It provides information regarding companies such as IBM, oracle, SAP SE, Microsoft, salesforce, amazon web service with key takeaways. Crafting an eye-catching presentation has never been more straightforward. Let your presentation shine with this tasteful yet straightforward Major Big Data Analytics Solution Providers Developing Strategic Insights Using Big Data Analytics SS V template. It offers a minimalistic and classy look that is great for making a statement. The colors have been employed intelligently to add a bit of playfulness while still remaining professional. Construct the ideal Major Big Data Analytics Solution Providers Developing Strategic Insights Using Big Data Analytics SS V that effortlessly grabs the attention of your audience Begin now and be certain to wow your customers This slide showcases major big data software providers based on market share. It provides information regarding companies such as IBM, oracle, SAP SE, Microsoft, salesforce, amazon web service with key takeaways.
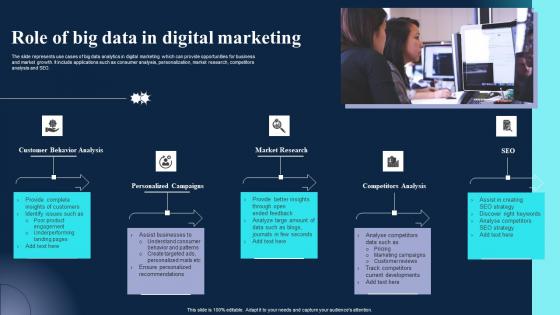
Role Of Big Data In Digital Marketing Information Pdf
The slide represents use cases of big data analytics in digital marketing which can provide opportunities for business and market growth. It include applications such as consumer analysis, personalization, market research, competitors analysis and SEO. Pitch your topic with ease and precision using this Role Of Big Data In Digital Marketing Information Pdf. This layout presents information on Behavior Analysis, Personalized Campaigns, Market Research. It is also available for immediate download and adjustment. So, changes can be made in the color, design, graphics or any other component to create a unique layout. The slide represents use cases of big data analytics in digital marketing which can provide opportunities for business and market growth. It include applications such as consumer analysis, personalization, market research, competitors analysis and SEO.
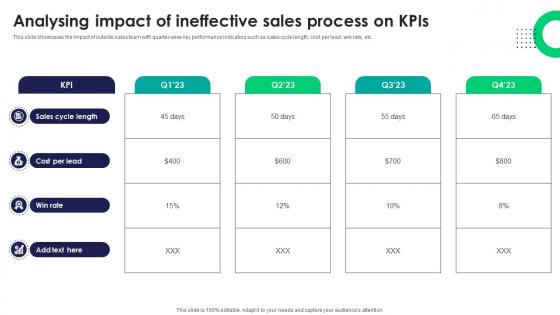
Analysing Impact Of Ineffective Sales Process On Kpis Tactics For Improving Field Sales Team SA SS V
This slide showcases the impact of outside sales team with quarter-wise key performance indicators such as sales cycle length, cost per lead, win rate, etc. Create an editable Analysing Impact Of Ineffective Sales Process On Kpis Tactics For Improving Field Sales Team SA SS V that communicates your idea and engages your audience. Whether you are presenting a business or an educational presentation, pre-designed presentation templates help save time. Analysing Impact Of Ineffective Sales Process On Kpis Tactics For Improving Field Sales Team SA SS V is highly customizable and very easy to edit, covering many different styles from creative to business presentations. Slidegeeks has creative team members who have crafted amazing templates. So, go and get them without any delay. This slide showcases the impact of outside sales team with quarter-wise key performance indicators such as sales cycle length, cost per lead, win rate, etc.
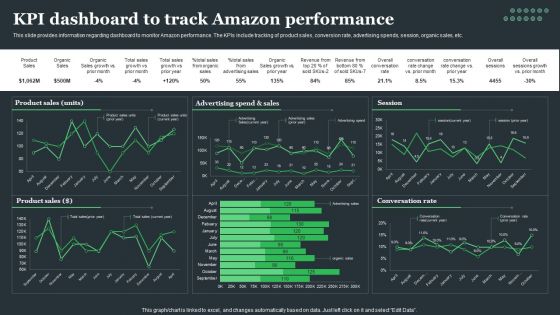
Amazon Tactical Plan KPI Dashboard To Track Amazon Performance Clipart PDF
This slide provides information regarding dashboard to monitor Amazon performance. The KPIs include tracking of product sales, conversion rate, advertising spends, session, organic sales, etc. The Amazon Tactical Plan KPI Dashboard To Track Amazon Performance Clipart PDF is a compilation of the most recent design trends as a series of slides. It is suitable for any subject or industry presentation, containing attractive visuals and photo spots for businesses to clearly express their messages. This template contains a variety of slides for the user to input data, such as structures to contrast two elements, bullet points, and slides for written information. Slidegeeks is prepared to create an impression.
Buzz Marketing Strategies For Brand Promotion Dashboard For Tracking Marketing Activities At Designs PDF
This slide covers information regarding the dashboard for tracking essential marketing activities at social media platform in terms of social traffic and conversion, referral traffic by site, key social media metrics. Deliver an awe inspiring pitch with this creative buzz marketing strategies for brand promotion dashboard for tracking marketing activities at designs pdf bundle. Topics like dashboard for tracking marketing activities at social media platform can be discussed with this completely editable template. It is available for immediate download depending on the needs and requirements of the user.
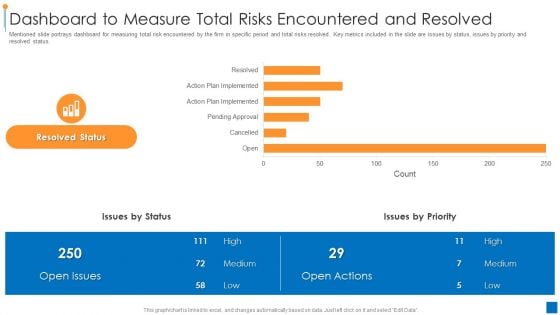
International Organization Standardization 270001 Dashboard To Measure Total Risks Encountered And Resolved Demonstration PDF
Mentioned slide portrays dashboard for measuring total risk encountered by the firm in specific period and total risks resolved. Key metrics included in the slide are issues by status, issues by priority and resolved status. Deliver and pitch your topic in the best possible manner with this international organization standardization 270001 dashboard to measure total risks encountered and resolved demonstration pdf. Use them to share invaluable insights on dashboard to measure total risks encountered and resolved and impress your audience. This template can be altered and modified as per your expectations. So, grab it now.
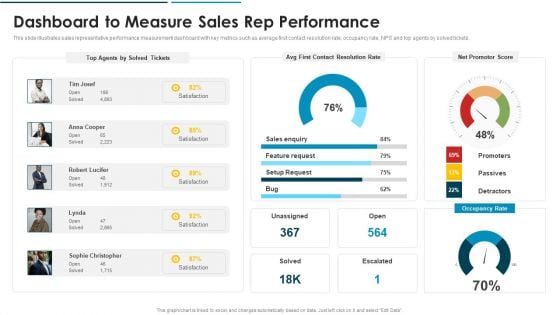
Go To Market Approach For New Product Dashboard To Measure Sales Rep Performance Formats PDF
This slide illustrates sales representative performance measurement dashboard with key metrics such as average first contact resolution rate, occupancy rate, NPS and top agents by solved tickets.Deliver and pitch your topic in the best possible manner with this Go To Market Approach For New Product Dashboard To Measure Sales Rep Performance Formats PDF Use them to share invaluable insights on Dashboard To Measure Sales Rep Performance and impress your audience. This template can be altered and modified as per your expectations. So, grab it now.
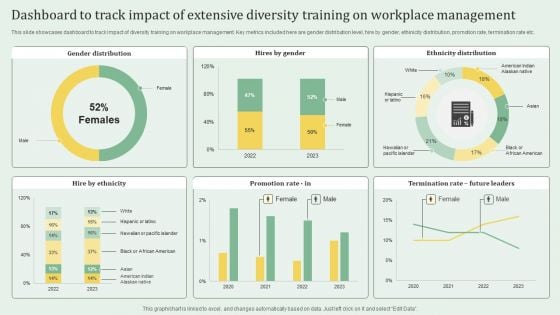
Dashboard To Track Impact Of Extensive Diversity Training On Workplace Management Portrait PDF
This slide showcases dashboard to track impact of diversity training on workplace management. Key metrics included here are gender distribution level, hire by gender, ethinicity distribution, promotion rate, termination rate etc. Pitch your topic with ease and precision using this Dashboard To Track Impact Of Extensive Diversity Training On Workplace Management Portrait PDF. This layout presents information on Dashboard To Track Impact, Extensive Diversity Training, Workplace Management. It is also available for immediate download and adjustment. So, changes can be made in the color, design, graphics or any other component to create a unique layout.
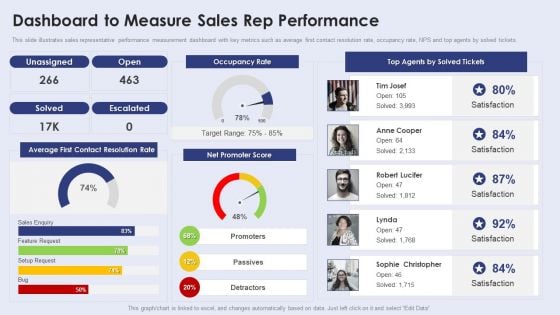
Creating New Product Launch Campaign Strategy Dashboard To Measure Sales Rep Performance Introduction PDF
This slide illustrates sales representative performance measurement dashboard with key metrics such as average first contact resolution rate, occupancy rate, NPS and top agents by solved tickets. Make sure to capture your audiences attention in your business displays with our gratis customizable Creating New Product Launch Campaign Strategy Dashboard To Measure Sales Rep Performance Introduction PDF. These are great for business strategies, office conferences, capital raising or task suggestions. If you desire to acquire more customers for your tech business and ensure they stay satisfied, create your own sales presentation with these plain slides.

Developing Strategic Insights Using Big Data Analytics Across Business Sectors Data Analytics CD V
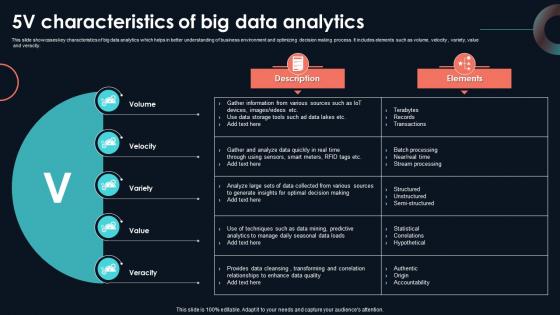
5V Characteristics Of Big Data Analytics Developing Strategic Insights Using Big Data Analytics SS V
This slide showcases key characteristics of big data analytics which helps in better understanding of business environment and optimizing decision making process. It includes elements such as volume, velocity , variety, value and veracity. Find a pre-designed and impeccable 5V Characteristics Of Big Data Analytics Developing Strategic Insights Using Big Data Analytics SS V. The templates can ace your presentation without additional effort. You can download these easy-to-edit presentation templates to make your presentation stand out from others. So, what are you waiting for Download the template from Slidegeeks today and give a unique touch to your presentation. This slide showcases key characteristics of big data analytics which helps in better understanding of business environment and optimizing decision making process. It includes elements such as volume, velocity , variety, value and veracity.
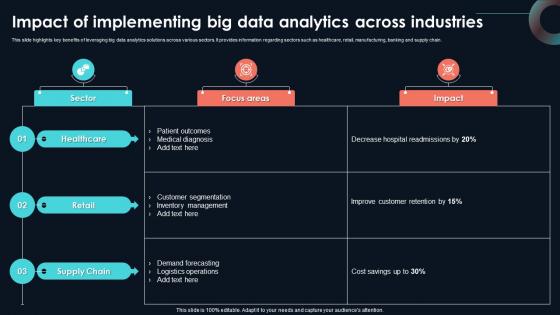
Impact Of Implementing Big Data Analytics Developing Strategic Insights Using Big Data Analytics SS V
This slide highlights key benefits of leveraging big data analytics solutions across various sectors. It provides information regarding sectors such as healthcare, retail, manufacturing, banking and supply chain. Find a pre-designed and impeccable Impact Of Implementing Big Data Analytics Developing Strategic Insights Using Big Data Analytics SS V. The templates can ace your presentation without additional effort. You can download these easy-to-edit presentation templates to make your presentation stand out from others. So, what are you waiting for Download the template from Slidegeeks today and give a unique touch to your presentation. This slide highlights key benefits of leveraging big data analytics solutions across various sectors. It provides information regarding sectors such as healthcare, retail, manufacturing, banking and supply chain.
CRM System Deployment Plan CRM Dashboard For Tracking Sales Pipeline Pictures PDF
This slide covers the CRM KPI dashboard for monitoring lead status in the sales funnel. It includes metrics such as open pipeline value, open pipeline by product package, pipeline value forecast, etc. Deliver an awe inspiring pitch with this creative CRM System Deployment Plan CRM Dashboard For Tracking Sales Pipeline Pictures PDF bundle. Topics like Pipeline Value Forecast, Open Pipeline Value, Branding can be discussed with this completely editable template. It is available for immediate download depending on the needs and requirements of the user.
Optimizing Consumer Lead Nurturing Procedure Enhanced Lead Performance Tracking Dashboard Pictures PDF
This slide covers the KPI dashboard for tracking improved lead management system performance. It includes metrics such as visitors, social media followers, email subscribers, organic leads, etc. Find a pre designed and impeccable Optimizing Consumer Lead Nurturing Procedure Enhanced Lead Performance Tracking Dashboard Pictures PDF. The templates can ace your presentation without additional effort. You can download these easy to edit presentation templates to make your presentation stand out from others. So, what are you waiting for Download the template from Slidegeeks today and give a unique touch to your presentation.
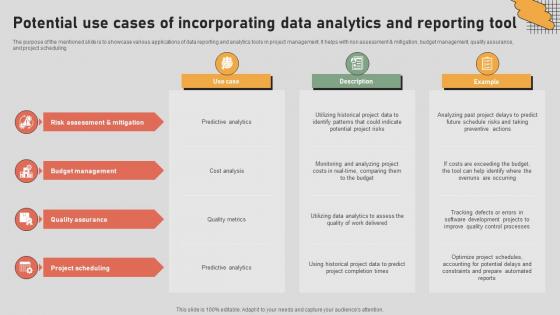
The Digital Project Managers Potential Use Cases Of Incorporating Data Analytics And Reporting
The purpose of the mentioned slide is to showcase various applications of data reporting and analytics tools in project management. It helps with risk assessment and mitigation, budget management, quality assurance, and project scheduling. Presenting this PowerPoint presentation, titled The Digital Project Managers Potential Use Cases Of Incorporating Data Analytics And Reporting, with topics curated by our researchers after extensive research. This editable presentation is available for immediate download and provides attractive features when used. Download now and captivate your audience. Presenting this The Digital Project Managers Potential Use Cases Of Incorporating Data Analytics And Reporting. Our researchers have carefully researched and created these slides with all aspects taken into consideration. This is a completely customizable The Digital Project Managers Potential Use Cases Of Incorporating Data Analytics And Reporting that is available for immediate downloading. Download now and make an impact on your audience. Highlight the attractive features available with our PPTs. The purpose of the mentioned slide is to showcase various applications of data reporting and analytics tools in project management. It helps with risk assessment and mitigation, budget management, quality assurance, and project scheduling.
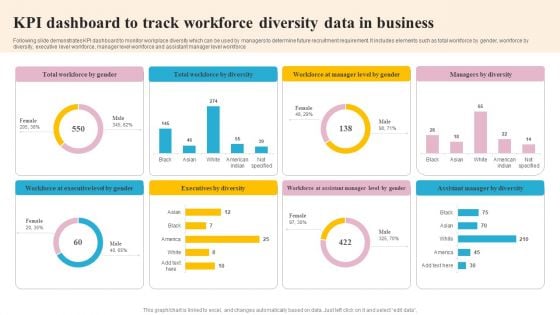
KPI Dashboard To Track Workforce Diversity Data In Business Mockup PDF
Following slide demonstrates KPI dashboard to monitor workplace diversity which can be used by managers to determine future recruitment requirement. It includes elements such as total workforce by gender, workforce by diversity, executive level workforce, manager level workforce and assistant manager level workforce. Pitch your topic with ease and precision using this KPI Dashboard To Track Workforce Diversity Data In Business Mockup PDF. This layout presents information on Executives By Diversity, Workforce By Diversity, Executive Level By Gender. It is also available for immediate download and adjustment. So, changes can be made in the color, design, graphics or any other component to create a unique layout.
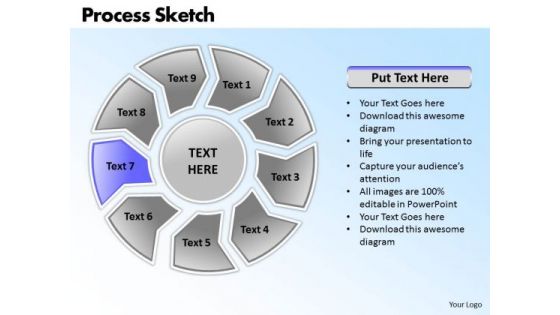
Ppt Circular Military Decision Making Process PowerPoint Presentation Sketch Templates
PPT circular military decision making process powerpoint presentation sketch Templates-Use this Astonishing PowerPoint Diagram to abstract the different phases of a single procedure. It symbolizes forever and ever, interminable, looped, no end of, no end to, on a treadmill, perpetual, prolonged, regular etc. It shows the highlighted seventh stage to be explained. This Business Diagram can be used in Marketing, Banking, and Management etc. You can edit text, color, shade and style as per you need.-PPT circular military decision making process powerpoint presentation sketch Templates-Arrow, Art, Blue, Business, Button, Circular, Clip, Design, Diagram, Drop, Element, Glowing, Graph, Graphic, Icon, Illustration, Isolated, Process, Round, Set, Shadow, Sphere, Symbol Our Ppt Circular Military Decision Making Process PowerPoint Presentation Sketch Templates provide classic cover. Drape your thoughts in them and dazzle the audience.
Strategy Playbook For Ecommerce Business Dashboard Tracking Essential Kpis For Ecommerce Performance Rules PDF
This slide provides information regarding essential KPIs for ecommerce performance dashboard tracking average bounce rate, new vs. old customers, channel revenue vs. channel acquisitions costs, channel revenue vs. sales, average conversion rate, etc. Deliver an awe inspiring pitch with this creative Strategy Playbook For Ecommerce Business Dashboard Tracking Essential Kpis For Ecommerce Performance Rules PDF bundle. Topics like Returning Customers, Acquisition Cost, Channel Revenue can be discussed with this completely editable template. It is available for immediate download depending on the needs and requirements of the user.
Magnifying Glass For Research Analysis Ppt PowerPoint Presentation Topics
This is a magnifying glass for research analysis ppt powerpoint presentation topics. This is a five stage process. The stages in this process are magnifying glass, research, analysis, management, strategy.
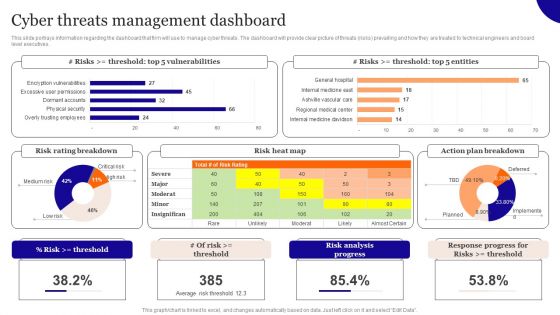
Cyber Threats Management Dashboard Introduction PDF
This slide portrays information regarding the dashboard that firm will use to manage cyber threats. The dashboard will provide clear picture of threats risks prevailing and how they are treated to technical engineers and board level executives. Slidegeeks is one of the best resources for PowerPoint templates. You can download easily and regulate Cyber Threats Management Dashboard Introduction PDF for your personal presentations from our wonderful collection. A few clicks is all it takes to discover and get the most relevant and appropriate templates. Use our Templates to add a unique zing and appeal to your presentation and meetings. All the slides are easy to edit and you can use them even for advertisement purposes.
Customer Loyalty Template 1 Ppt PowerPoint Presentation File Influencers
This is a customer loyalty template 1 ppt powerpoint presentation file influencers. This is a two stage process. The stages in this process are customer loyalty lifecycle, loyalty program performance dashboard, business, strategy.
Business Analysis Data Monitoring Vector Icon Ppt Powerpoint Presentation Ideas Design Ideas
This is a business analysis data monitoring vector icon ppt powerpoint presentation ideas design ideas. This is a one stage process. The stages in this process are feedback loop icon, evaluation icon, assessment icon.
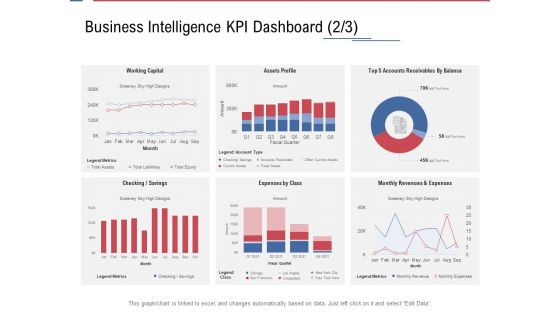
Data Assimilation Business Intelligence KPI Dashboard Sky Ppt Background Images PDF
Deliver an awe inspiring pitch with this creative data assimilation business intelligence kpi dashboard sky ppt background images pdf bundle. Topics like expenses, working capital, checking savings, revenues, assets can be discussed with this completely editable template. It is available for immediate download depending on the needs and requirements of the user.
customer loyalty template 1 ppt powerpoint presentation infographic template summary
This is a customer loyalty template 1 ppt powerpoint presentation infographic template summary. This is a two stage process. The stages in this process are customer loyalty lifecycle, loyalty program performance dashboard, opportunity, business, management.
Customer Loyalty Template 2 Ppt PowerPoint Presentation Slides Skills
This is a customer loyalty template 2 ppt powerpoint presentation slides skills. This is a two stage process. The stages in this process are customer loyalty lifecycle, loyalty program performance dashboard, opportunity, business, management.


 Continue with Email

 Home
Home


